Technical Manual for Drilling Works for Technical Support Plan for the Drillers in DDCA (2013) - page 3
DDCAP Technical Manual for Tool Fishing and Well Rehabilitation
For Technical Support Plan for the Drillers in DDCA
12.2 FISHING TOOLS (TA CODE 12-2)
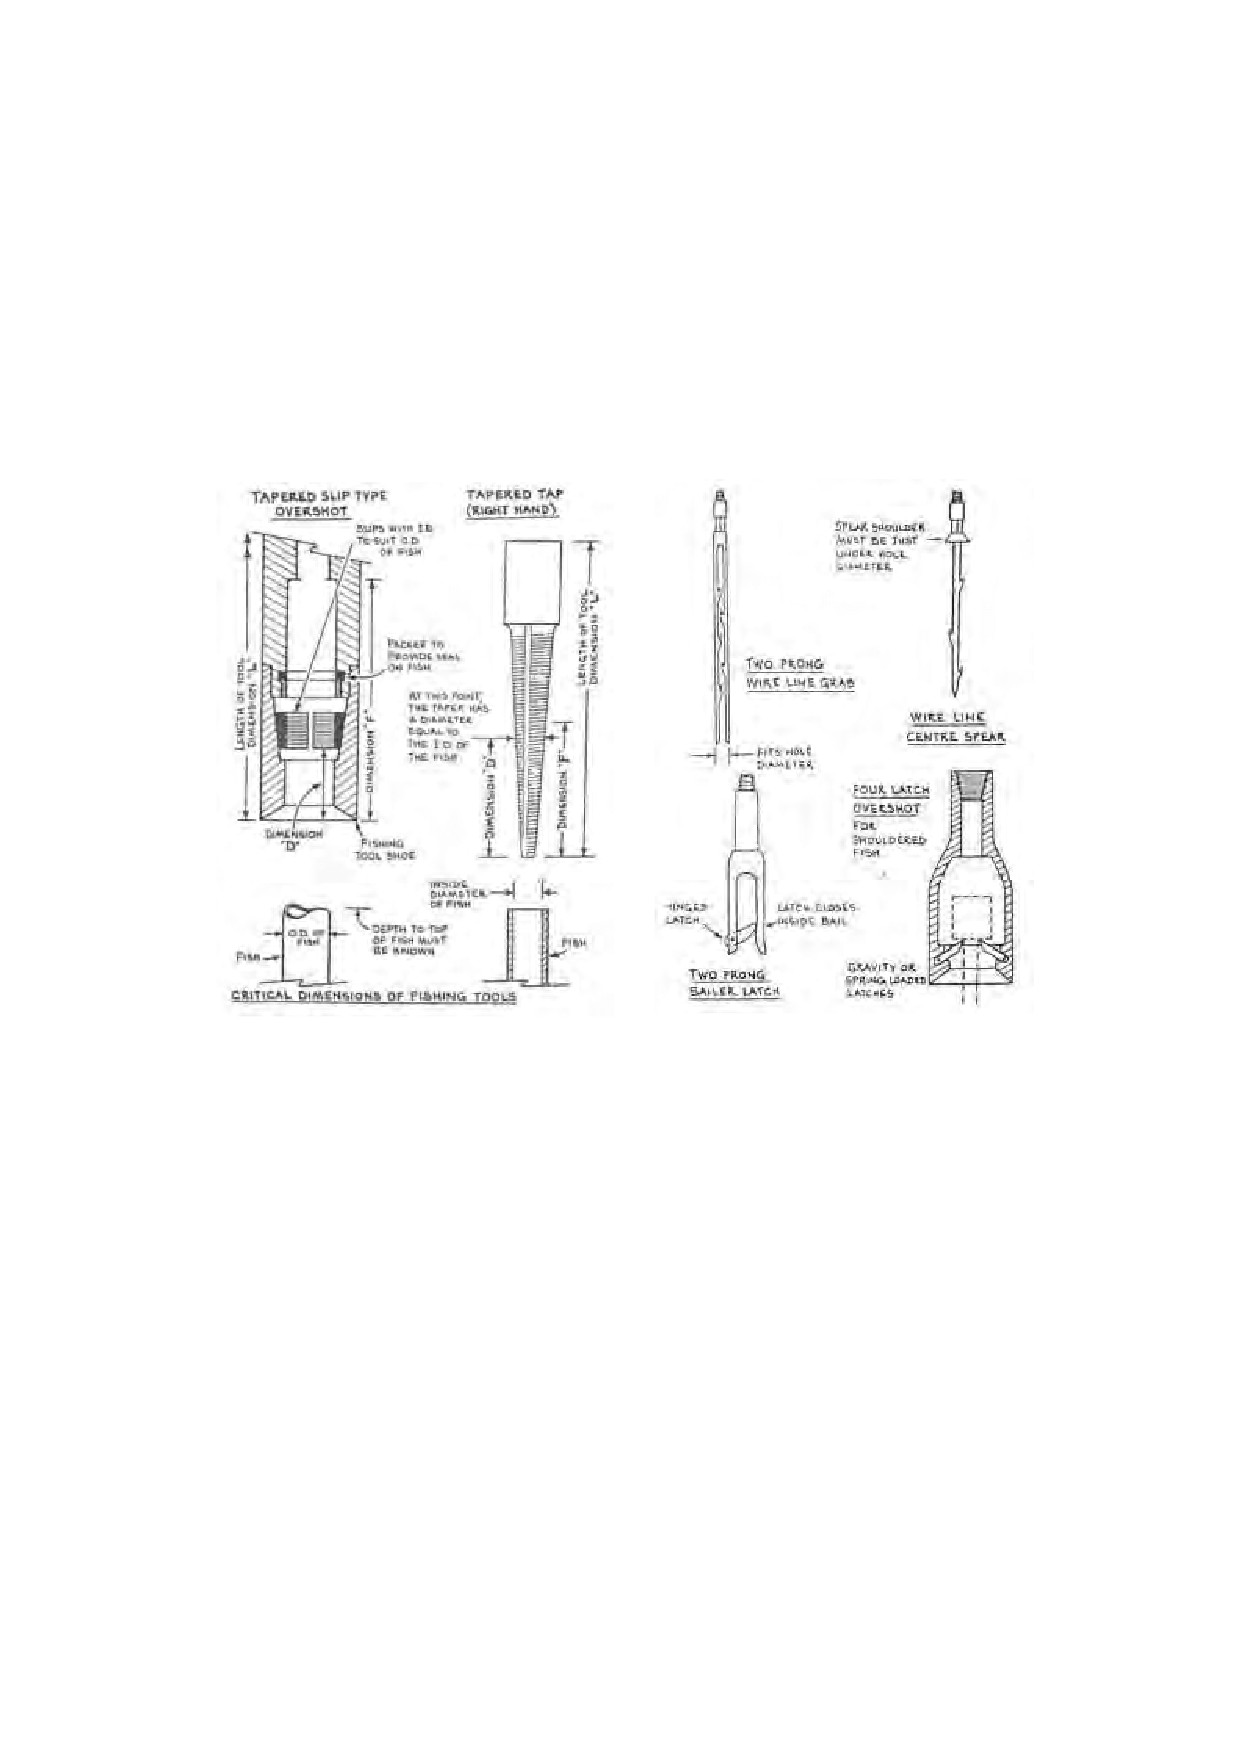
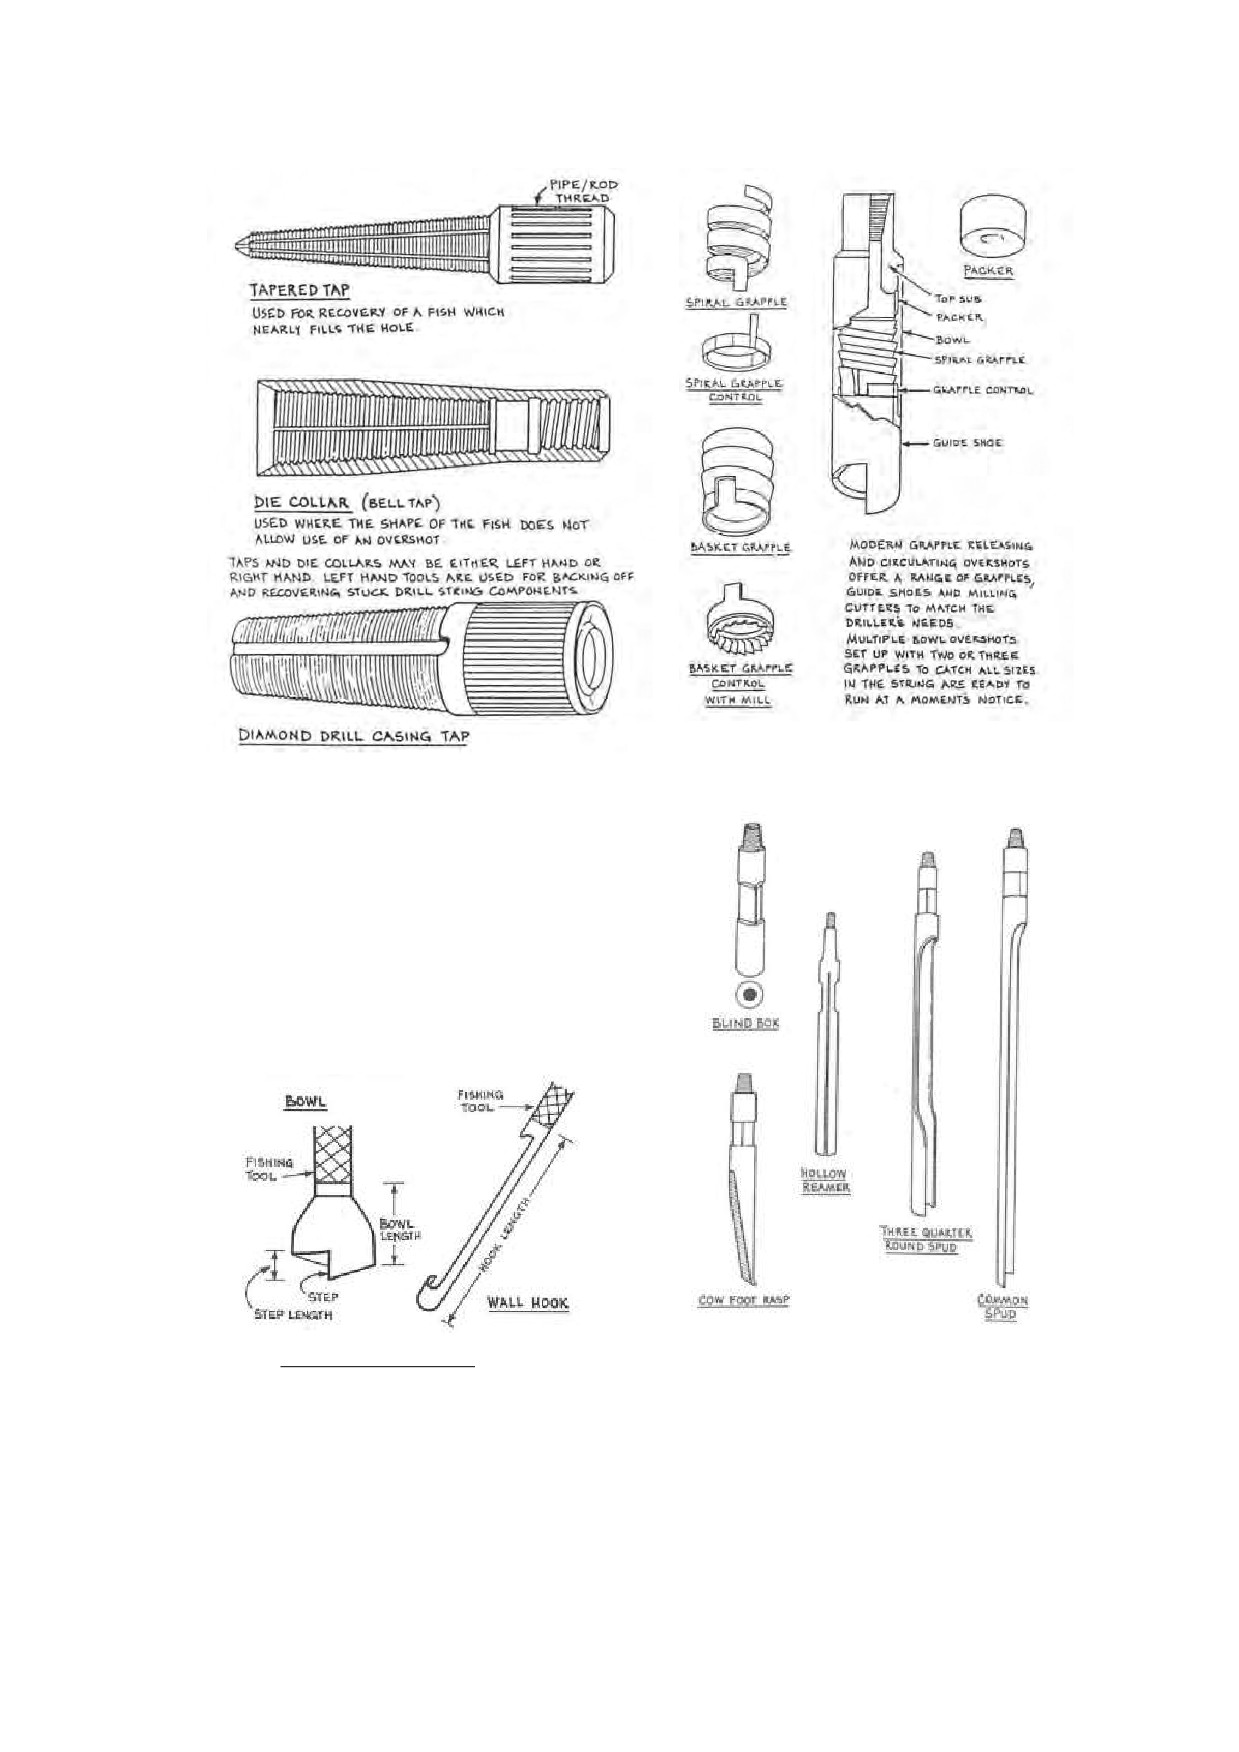
There are many types of fishing tools as shown in Figure 3 and Figure 4. These tools are
selected depending on the purpose of each stage of tool fishing works.
Each fishing tool is manufacture for certain range of dimension of fallen materials. It is not
possible to keep stock of fishing tools for all types and dimensions of fallen materials.
Therefore, the skills for manufacturing “order-made” fishing tools to be fit to the target fallen
material and down-hole conditions is important, too.
Engaging the Fish
Hooks and Latching Tools
Source: Australian Driling Industry Trining Committee
Figure 3 Fishing Tools (1/2)
5
DDCAP Technical Manual for Tool Fishing and Well Rehabilitation
For Technical Support Plan for the Drillers in DDCA
Taps and Die Collar
Grapple Overshot
Tools for Catching
Tools to Straighten the Fish
Source: Australian Driling Industry Trining Committee
Figure 4 Fishing Tools (2/2)
6
DDCAP Technical Manual for Tool Fishing and Well Rehabilitation
For Technical Support Plan for the Drillers in DDCA
13 WELL REHABILITATION (TA CODE 13)
13.1 PHENOMENAN AND CAUSES OF WELL DETERIORATION (TA CODE 13-1)
13.1.1 WELL FAILURE BY INCRUSTATION
Chemical and biological incrustations are major causes of well failure. Water quality chiefly
determines the occurrence of incrustation. The surface characteristics of the screen itself may also
play a part in regulating the rate at which incrustation occurs. If the screen is constructed of
rough-surface metal, for example, incrustants may build up at a faster rate. The kind and amount of
dissolved minerals and gases in natural waters determine their tendency to deposit mineral matter
as incrustation.
Groundwater normally moves slowly and remains in contact with the minerals of the aquifer
material for hundreds or thousands of years in a quasi-chemical equilibrium with its environment.
Any change in the physical or chemical conditions (such as pumping a well) upsets the equilibrium
and may cause precipitation of relatively insoluble materials.
The incrustation often forms a hard, brittle, cement- like deposit similar to the scale found in water
pipes. It may also be soft, paste-like sludge or gelatinous material, depending on conditions.
The major forms of incrustation include:
Precipitation of calcium and magnesium carbonates or their sulfates.
Precipitation of iron and manganese compounds, primarily their hydroxides or hydrated
oxides.
Slime-producing iron bacteria or other slime-forming organisms (biofouling).
(1) Causes of Carbonate Incrustation:
Chemical incrustation usually results from the precipitation of carbonates, mainly of calcium, from
groundwater in the proximity of the well screen. Other substances, such as aluminium silicates and
iron compounds, may also be entrapped in the scale-like carbonates that cement sand grains
together around the screen. The deposits fill the voids, and the flow of water into the well is
reduced proportionately.
The explanation is that calcium carbonate can be carried in solution in proportion to the amount of
dissolved carbon dioxide in the groundwater. The ability of water to hold carbon dioxide in solution
varies with pressure - the higher the pressure, the higher the concentration of carbon dioxide.
When water is pumped from a well in an unconfined aquifer the hydrostatic pressure in the deeper
portions of the aquifer is decreased with greatest change being at the well.
Because of the reduction in pressure, some carbon dioxide is released from the water. When this
occurs, the water is unable to carry its full load of dissolved calcium carbonate and part of this
material is precipitated onto the well screen and in the formation material adjacent to the well
screen.
Pumping a well in a confined aquifer produces a similar pressure reduction and resulting
precipitation.
Formation of calcium carbonate precipitate from calcium bicarbonate is the classic example:
Ca(HCO3)2
-∆P CaCO3↓ + CO2↑ + H2O
where ∆P is a change in pressure.
Solubility of calcium bicarbonate is 1300 mg/l while the solubility of calcium carbonate is 13 mg/l.
Carbon dioxide (CO2) escapes when the head, or pressure, is reduced.
Magnesium bicarbonate changes to magnesium carbonate in the same manner when the carbon
dioxide is released, but magnesium carbonate incrustation occurs only in special instances because
7
DDCAP Technical Manual for Tool Fishing and Well Rehabilitation
For Technical Support Plan for the Drillers in DDCA
it is still soluble at concentrations over 5000 mg/l (Kemmer, 1979). Precipitation occurs, therefore,
only when the carbonate concentration exceeds this level.
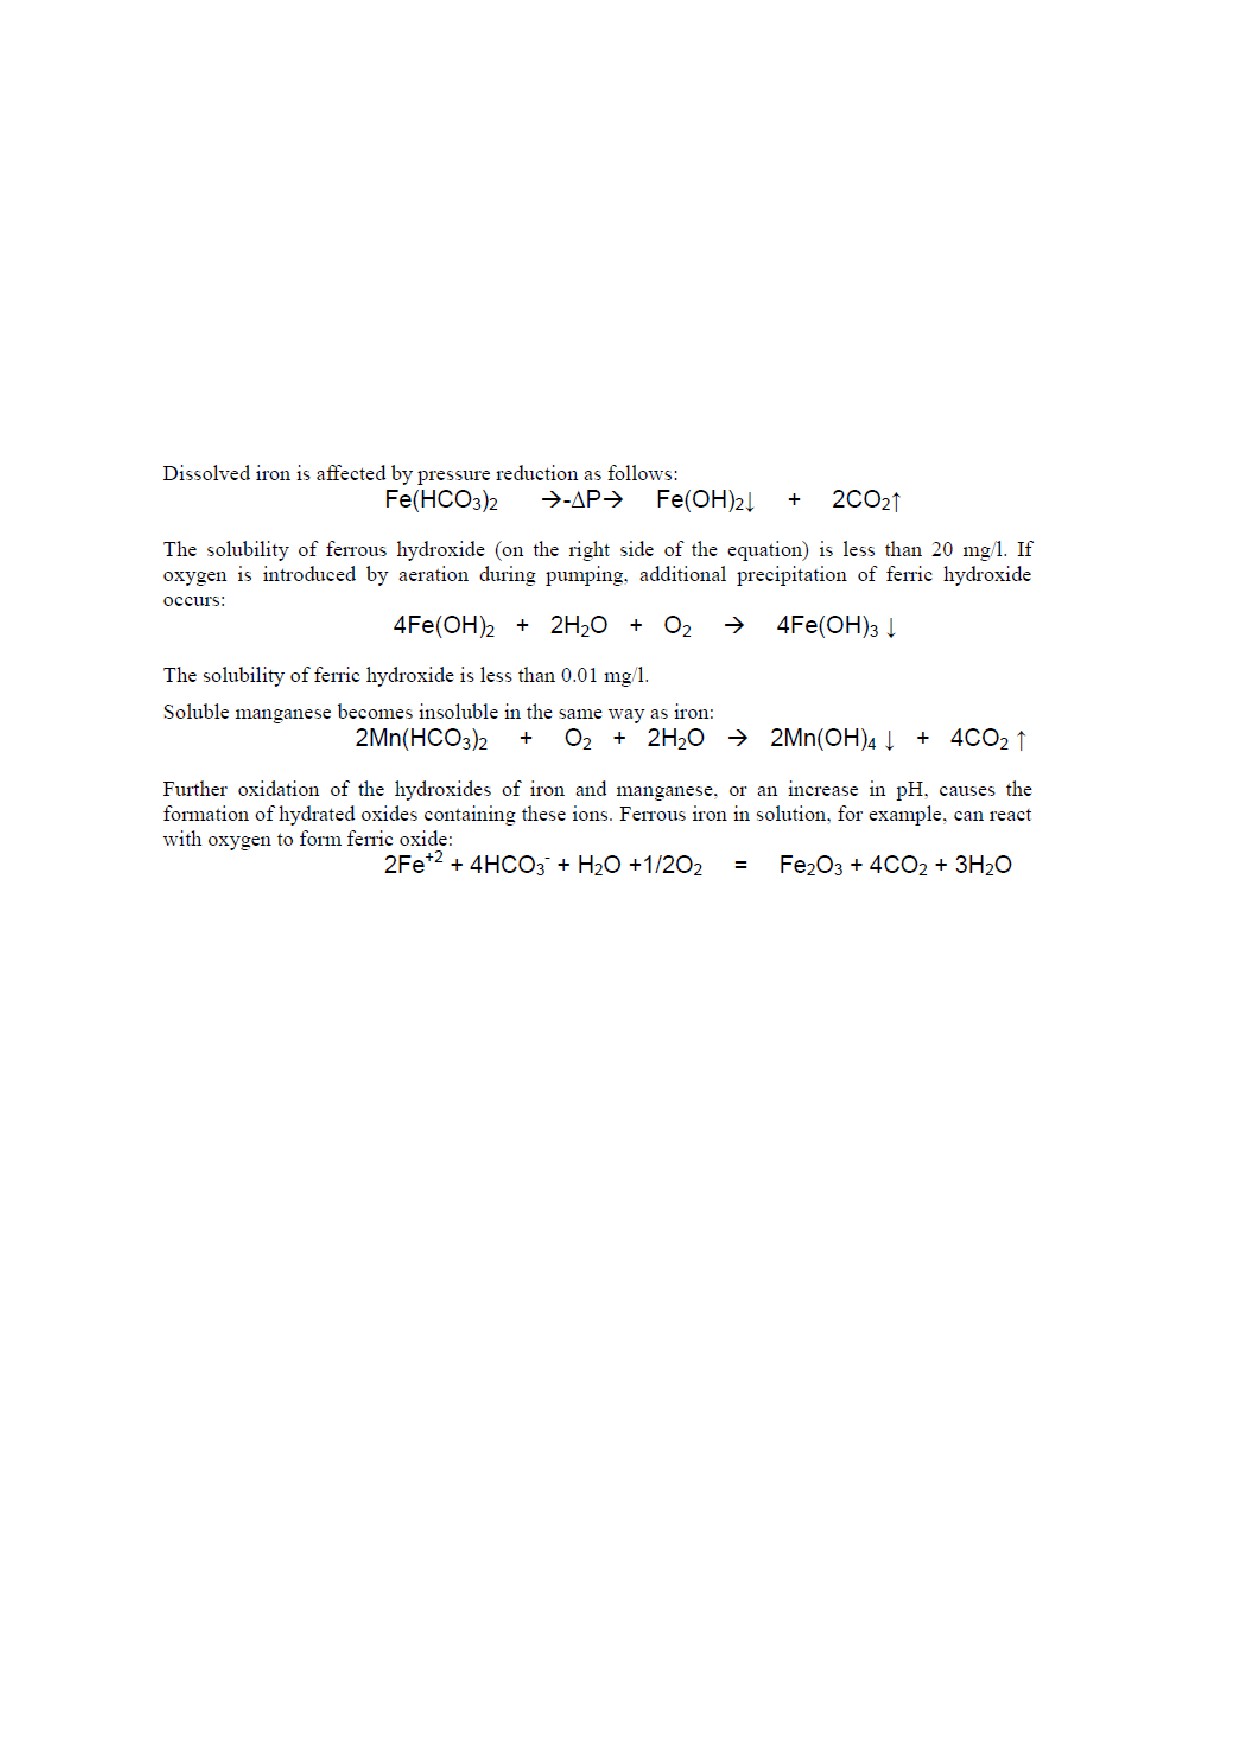
(2) Causes of Iron and Manganese Incrustation:
Many rocks throughout the world contain iron and manganese, and are the source of iron and
manganese ions found in groundwater if the pH is about 5 or less.
Velocity- induced pressure changes due to pumping can disturb the chemical equilibrium of the
groundwater and result in the deposition of insoluble iron and manganese hydroxides. These
hydroxides are gel-like and may occupy relatively large volumes. Over time, they harden into scale
deposits.
The ferric oxide is a reddish brown deposit similar to rust, whereas the hydrated ferrous oxide is a
black sludge.
The insoluble manganese oxide is also black or dark brown.
Iron and manganese deposits are often found associated with calcium and magnesium carbonate
scale.
In the cone of depression around a well in an unconfined aquifer, air enters the voids and oxidizes
iron in the films of water adhering to individual sand grains. If pumping is started and stopped
intermittently, a coating of iron oxide can build up, thereby gradually reducing the void space in
this part of the formation. This action reduces the formation’s storage capacity in the vicinity of the
well, and the cone of depression enlarges more rapidly than it would otherwise.
(3) Well Failure Caused by Iron Bacteria:
Iron bacteria occur widely in wells open to the atmosphere when sufficient iron and/or manganese
are present in the groundwater in conjunction with dissolved organic material, bicarbonate, or
carbon dioxide.
The principal forms of iron bacteria plug wells by enzymatically catalyzing the oxidation of iron
(and manganese), using the energy to promote the growth of threadlike slimes, and accumulating
large amounts of ferric hydroxide in the slime.
In this process, the bacteria obtain their energy by oxidizing ferrous ions to ferric ions, which are
then precipitated as hydrated ferric hydroxide on or in their mucilaginous sheaths. Precipitation of
the iron and the rapid growth of the bacteria create a voluminous material that quickly plugs the
screen pores of the sediment surrounding the well bore.
8
DDCAP Technical Manual for Tool Fishing and Well Rehabilitation
For Technical Support Plan for the Drillers in DDCA
Sometimes the explosive growth rates of iron bacteria can render a well virtually useless within a
matter of months.
Many other forms of iron bacteria induce the precipitation of iron through nonenzymatic means.
Found almost everywhere in both water and soil, these bacteria promote precipitation of iron by:
Raising the pH of the water through metabolic and photosynthetic processes.
Changing the redox potential of the water by algal photosynthesis. In this process, oxygen
given off by plants increases the redox potential, thereby causing the precipitation of iron.
Liberating chelated iron by inducing a breakdown in the bond between iron and oxalate,
citrate, humic acids, or tannins.
Many forms of enzymatic bacteria that could grow in water wells prefer water with the following
general physical and chemical characteristics:
Has an iron content of 1 to 25 mg/l and contains only traces of organic matter.
Low in oxygen, typically in the 0.1 to 1.0 mg/l range.
Usually fresh.
Contains over 20 mg/l carbon dioxide.
Has a redox potential in the range of 200 to 300 millivolts (mv).
Has a pH in the range of 6 to 7.6.
Has a temperature from 40 to 600F (4.4 to 15.60C).
There are, however, other forms of iron bacteria that can grow in waters having extremely low pH
(2 to 6) and much higher temperatures [60 to 1850F (15.6 to 850C)]
A second classification of iron bacteria is the one based on the physical form of the organisms.
There are three general forms:
The capsulated coccoid form which consists of numerous short rods surrounded by a mucoid
capsule. The deposit surrounding the capsule is hydrous ferric oxide, a rust-brown
precipitate.
The stalked iron-fixing bacteria composed of twisted bands resembling a ribbon or chain
with a bean-shaped bacterial cell at the end of the twisted stalk.
The filamentous group that take different shapes and structures.
Under each form are numerous genera and species.
If the presence of iron bacteria is suspected in a well, samples of the organism can be obtained by
a filtering device attached to the discharge of the pump for one week. The water passing through
the filter during this period leaves a dark brown precipitate on the porcelain cover which can be
examined for iron bacteria by a qualified laboratory.
Another method of sample collection is to examine the material scraped from valves or pump
discharge lines from suspected wells, pump shaft seals, water closets, or small steel objects
suspended temporarily in the well.
However, unless a microscope of at least 1000X is available, it is best to send the samples to a
laboratory or firm familiar with iron bacteria identification.
(4) Prevention and Treatment of Incrustation Problems:
So far, means of preventing the incrustation of well screens has not been found. One unique
method does exist, however, that is designed to reduce the amount of iron incrusting materials
reaching the well screen. This method, called the Vyredox System, uses a series of injection wells
located in a circle around the production well. Oxygenated water is injected into the wells to
oxidize iron in solution and promote the growth of iron bacteria so that little iron reaches the
production well.
9
DDCAP Technical Manual for Tool Fishing and Well Rehabilitation
For Technical Support Plan for the Drillers in DDCA
For most wells where incrusting material cannot be removed before reaching the well, several
actions can be taken to delay incrustation and make it a less serious problem:
The well screen should be designed to have the maximum possible inlet area to reduce the
flow velocity to a minimum through the screen openings.
The well should be developed thoroughly.
The pumping rate may be reduced and the pumping period increased, thereby decreasing
entrance velocities.
The pumping load may be divided among a larger number of smaller diameter wells instead
of obtaining all of the supply from only one or a few larger diameter wells.
A more frequent maintenance or cleaning procedure - by qualified water well contractor-
should be undertaken wherever local experience shows considerable difficulty from
incrustation.
In localities where incrustation is prevalent, samples of the incrusting material and water should be
analyzed. The proportions of the various materials shown by the analyses should indicate the kind
of treatment and the type of chemicals that would be most successful in recovering well yield.
13.1.2 WELL FAILURE FROM CORROSION:
Metals are generally extracted from ores of stable mineral compounds that are in physical and
chemical harmony with their natural environment. In the elemental state most metals are not
inherently stable.
In the environment, elemental metals naturally revert back into more stable mineral compounds.
This completely natural process is called corrosion. It changes the physical and chemical properties
of metals, frequently destroys the usefulness of of fabricated metallic articles or structures, and may,
over time, reduce or destroy metal products.
Corrosion can severely limit the useful life of water wells in four ways:
Enlargement of screen slots or development of holes in the casing, followed by sand
pumping.
Reduction in strength, followed by failure of well screen or casing.
Deposition of corrosion products, thereby blocking screen-slot openings and reducing yield.
Inflow of low-quality water caused by corrosion of the casing.
(1) Chemical and Electrochemical Corrosion:
Corrosion results from chemical and electrochemical processes. Chemical corrosion occurs when a
particular constituent is present in water in sufficient concentration to cause rapid removal of
material over broad areas. Commonly these constituents are carbon dioxide, oxygen, hydrogen
sulfide, hydrochloric acid, chloride, and sulfuric acid.
Chemical corrosion can cause severe damage in wells, regardless of the amount of total dissolved
solids. The number of wells affected by chemical corrosion is, however, small compared to those
affected by electrochemical corrosion.
In electrochemical corrosion, flow of an electric current facilitates the corrosive attack on a metal.
Two conditions are necessary:
A difference of an electrical potential on metal surfaces.
Water containing enough dissolved solids to be a conductive fluid (electrolyte).
A potential (electrical) difference may develop between two different kinds of metals, or between
nearby but separate areas on the surface of the same metal.
Difference in potential on the same steel pipe, for example, can occur:
10
DDCAP Technical Manual for Tool Fishing and Well Rehabilitation
For Technical Support Plan for the Drillers in DDCA
At heat affected areas around welded joints.
At heated areas around torch-cut slots.
At work-hardened areas around machine-cut slots.
At cut surfaces of exposed threads at pipe joints.
At breaks in surface coatings such as paint and mill scale.
In the above cases both a cathode and an anode develop, and metal is removed from the anode.
Bimetallic corrosion results when two different metals are in contact and immersed in an
electrolyte. A galvanic cell is created an corrosion occurs. A well screen made of two different
metals, such as low-carbon steel and stainless steel, will be damaged because the mild-steel portion
is corroded by the galvanic action.
When electrochemical corrosion takes place, corrosion products may be deposited at the cathode.
These deposits are usually voluminous. If iron or steel is corroded, the corrosion products are iron
combined with other elements and are normally ferric hydroxide or ferric oxide.
Deposition of corrosion products that results in blocked screen-slot openings and reduced well
yields is evidence of electrochemical corrosion.
11
DDCAP Technical Manual for Tool Fishing and Well Rehabilitation
For Technical Support Plan for the Drillers in DDCA
13.2 METHODS OF WELL REHABILITATION (TA CODE 13-2)
13.2.1 GENERAL
The major purposes of well rehabilitation are:
(1) To revive the well yield by cleaning the clogged screen and neighbouring aquifer
(2) To remove the sedimentation of sand at the bottom of a well
(3) To repair the damaged screen and/or casing which produce sand and/or clay into the pumped
water
For above (1), mechanical methods such as air-lifting, bailing, brushing, swabbing etc., and
chemical methods using acid are used.
For (2) air-lifting or bailing is used.
The countermeasures for (3) need more complex and expensive process. Double-casing methods
are commonly used if the diameter of internal casing to be installed is sufficiently enough to install
the pump. Principles of the above methods are described below.
13.2.2 MECHANICAL CLEANING
Mechanical cleaning is the method of removing scale, sand, silt which clogs the screen and
neighbouring aquifer by hydraulic force and/or direct physical contact of cleaning devises. The
following methods are generaly used (See Figure 5 and Figure 6).
(1) Bailing
(2) Brushing
(3) Jetting
(4) Pumping/Water Injection
Bailing
Swabbing
12
DDCAP Technical Manual for Tool Fishing and Well Rehabilitation
For Technical Support Plan for the Drillers in DDCA
Source: National Water Well Association of Japan
Figure 5 Mechanical Cleaning (1/2)
Pumping/Water Injection
Source: National Water Well Association of Japan
Figure 6 Mechanical Cleaning (2/2)
13
DDCAP Technical Manual for Tool Fishing and Well Rehabilitation
For Technical Support Plan for the Drillers in DDCA
13.2.3 CHEMICAL CLEANING
Mechanical methods are effective for the cleaning of the scales
on the suface of screen and casing. However, the effects
often do not reach to the inside of the neighbouring aquifer.
In this case, chemical method is used together with mechanical
method.
Various types of chemical agent for the well rehabilitation are
available for the purposes of the decomposition of scale,
disinfection of iron bacteria etc.
The instruments of chemical injection are shown in Figure 7.
Source National Water Well Association of Japan
Figure 7 Installation of Chemical
Cleaning
13.2.4 SEDIMENTATION REMOVAL
The pumped water contains certain amount of sand. The sand is deposited at the bottom of well
during the pumping operation. This sand deposit may cause the elvation of sand content in the
pumped water and/or decrease of water yield due the clogging of screen.
The deposited of sand shall be periodically removed by the measures of air-lifting and/or bailing
(See Figure 8)
Air-Lifting Method
14
DDCAP Technical Manual for Tool Fishing and Well Rehabilitation
For Technical Support Plan for the Drillers in DDCA
Bailing Method
Source National Water Well Association of Japan
Figure 8 Sedimentation Removal Method
13.2.5 DOUBLE-CASING METHOD
Especially for steel casing and screen, the holes on casing and screen occur by corrosion. These
holes will be expanded gradually. One of the popular counter-measure to repair the holes on
casing and screen is double-casing method.
Smaller casing and screen are installed inside the existing casing and screen as shown in Figure 9.
Source National Water Well Association of Japan
Figure 9 Double-Casing Method
15
DDCAP Technical Manual for Tool Fishing and Well Rehabilitation
For Technical Support Plan for the Drillers in DDCA
13.3 USAGE OF WELL CAMERA (TA CODE 13-3)
Well camera is very useful tool which can obtain the following information:
Condition of the casing and screen in a well
Screen position, casing diameter, casing materials
Figure 8 clearly shows the difference of the conditions of the screen before and after the well
rehabilitation, by well camera.
-
DDCA is now procuring one (1) set of well camera for the purposes of the well investigation.
Source: Golder Associates Ltd - Kamloops (2006)
Figure 10 Well Screen Before and after treatment of Incrustation
16
LOCAIDES GENERAL SUPPLY LIMITED
P.O. Box 33333, Dar es Salaam. Survey, Kinondoni
Tel:2700096 Fax: 2700096
email: locaides@gmail.com,bertharicky@yahoo.com
GROUNDWATER DEVELOPMENT AND MANAGEMENT
CAPACITY DEVELOPMENT PROJECT
DDCAP
OUTPUT (2) LIST OF NUMBER OF DRILLED
BOREHOLES PER YEAR
SEPTEMBER 2013
LOCAIDES GENERAL SUPPLY LIMITED
Output (2) List of Number of Drilled Boreholes per Year
Table 1table shows number of drilled borehole per year. Total number of drilled borehole up to 2011/2013 is 12,932.
Table 1 Number of drilled boreholes per year
Financial
Borehole
Financial
Borehole
Financial
Borehole
Financial
Borehole
Financial
Borehole
Year
Drilled
Year
Drilled
Year
Drilled
Year
Drilled
Year
Drilled
19301931
13
1950-1951
41
1970-1971
144
1990-1991
151
2010-2011
244
1931-1932
10
1951-1952
38
1971-1972
272
1991-1992
186
2011-2013
269
1932-1933
15
1952-1953
47
1972-1973
286
1992-1993
152
1933-1934
16
1953-1954
54
1973-1974
314
1993-1994
139
1934-1935
12
1954-1955
62
1974-1975
291
1994-1995
212
1935-1936
11
1955-1956
45
1975-1976
284
1995-1996
73
1936-1937
38
1956-1957
44
1976-1977
253
1996-1997
335
1937-1938
14
1957-1958
29
1977-1978
193
1997-1998
352
1938-1939
10
1958-1959
34
1978-1979
156
1998-1999
505
1939-1940
4
1959-1960
41
1979-1980
150
1999-2000
583
1940-1941
5
1960-1961
40
1980-1981
282
2000-2001
404
1941-1942
6
1961-1962
41
1981-1982
110
2001-2002
390
1942-1943
13
1962-1963
21
1982-1983
98
2002-2003
422
1943-1944
5
1963-1964
36
1983-1984
133
2003-2004
516
1944-1945
13
1964-1965
41
1984-1985
240
2004-2005
485
1945-1946
13
1965-1966
29
1985-1986
96
2005-2006
466
1946-1947
18
1966-1967
52
1986-1987
193
2006-2007
467
1
Output (2) List of Number of Drilled Boreholes per Year
Financial
Borehole
Financial
Borehole
Financial
Borehole
Financial
Borehole
Financial
Borehole
Year
Drilled
Year
Drilled
Year
Drilled
Year
Drilled
Year
Drilled
1947-1948
16
1967-1968
93
1987-1988
158
2007-2008
493
1948-1949
30
1968-1969
106
1988-1989
204
2008-2009
443
1949-1950
35
1969-1970
125
1989-1990
180
2009-2010
292
Total
12,932
(Data source: DDCA)
2
LOCAIDES GENERAL SUPPLY LIMITED
P.O. Box 33333, Dar es Salaam. Survey, Kinondoni
Tel:2700096 Fax: 2700096
email: locaides@gmail.com,bertharicky@yahoo.com
GROUNDWATER DEVELOPMENT AND MANAGEMENT
CAPACITY DEVELOPMENT PROJECT
DDCAP
OUTPUT (4) REQUIREMENT COMPLETED
OCTOBER 2012
LOCAIDES GENERAL SUPPLY LIMITED
Table of Contents
1.CURRENT STATUS OF DATA MANAGEMENT OF DDCA
1
2.EXISTING WELL COMPLETION REPORT
2
3.INTRODUCTION OF NEW DATABASE SYSTEM
2
4.REVISION OF FORMS
3
5.DATA SHARING WITH JICA’S WELL DATABASE
4
6.CHANGE OF DATABASE SOFTWARE TO MS-EXCEL
5
6.1 Database Structure in MS-Excel
5
6.2 Information Retrieval from WID
5
Figures
Figure 1 Flow of current organization of report
1
Output (4) Requirement completed
1. CURRENT STATUS OF DATA MANAGEMENT OF DDCA
DDCA started drilling works since 1931 when it was the former Drilling Department of MoW
and continues drilling works after the transition to DDCA in 1997. Total number of boreholes
drilled by DDCA is approximately 10,000. Paper-based borehole completion reports are
principally stored in registry room of DDCA. However, most of the borehole completion
reports of former Drilling Department are stored in Water Resources Department (WRD) of
MoW and in the DDCA Office in Dodoma.
Currently, the completion report is submitted to Basin Water Office and client after approval of
DDCA headquarters. The report submitted is stored in DDCA branch office in Dodoma. The
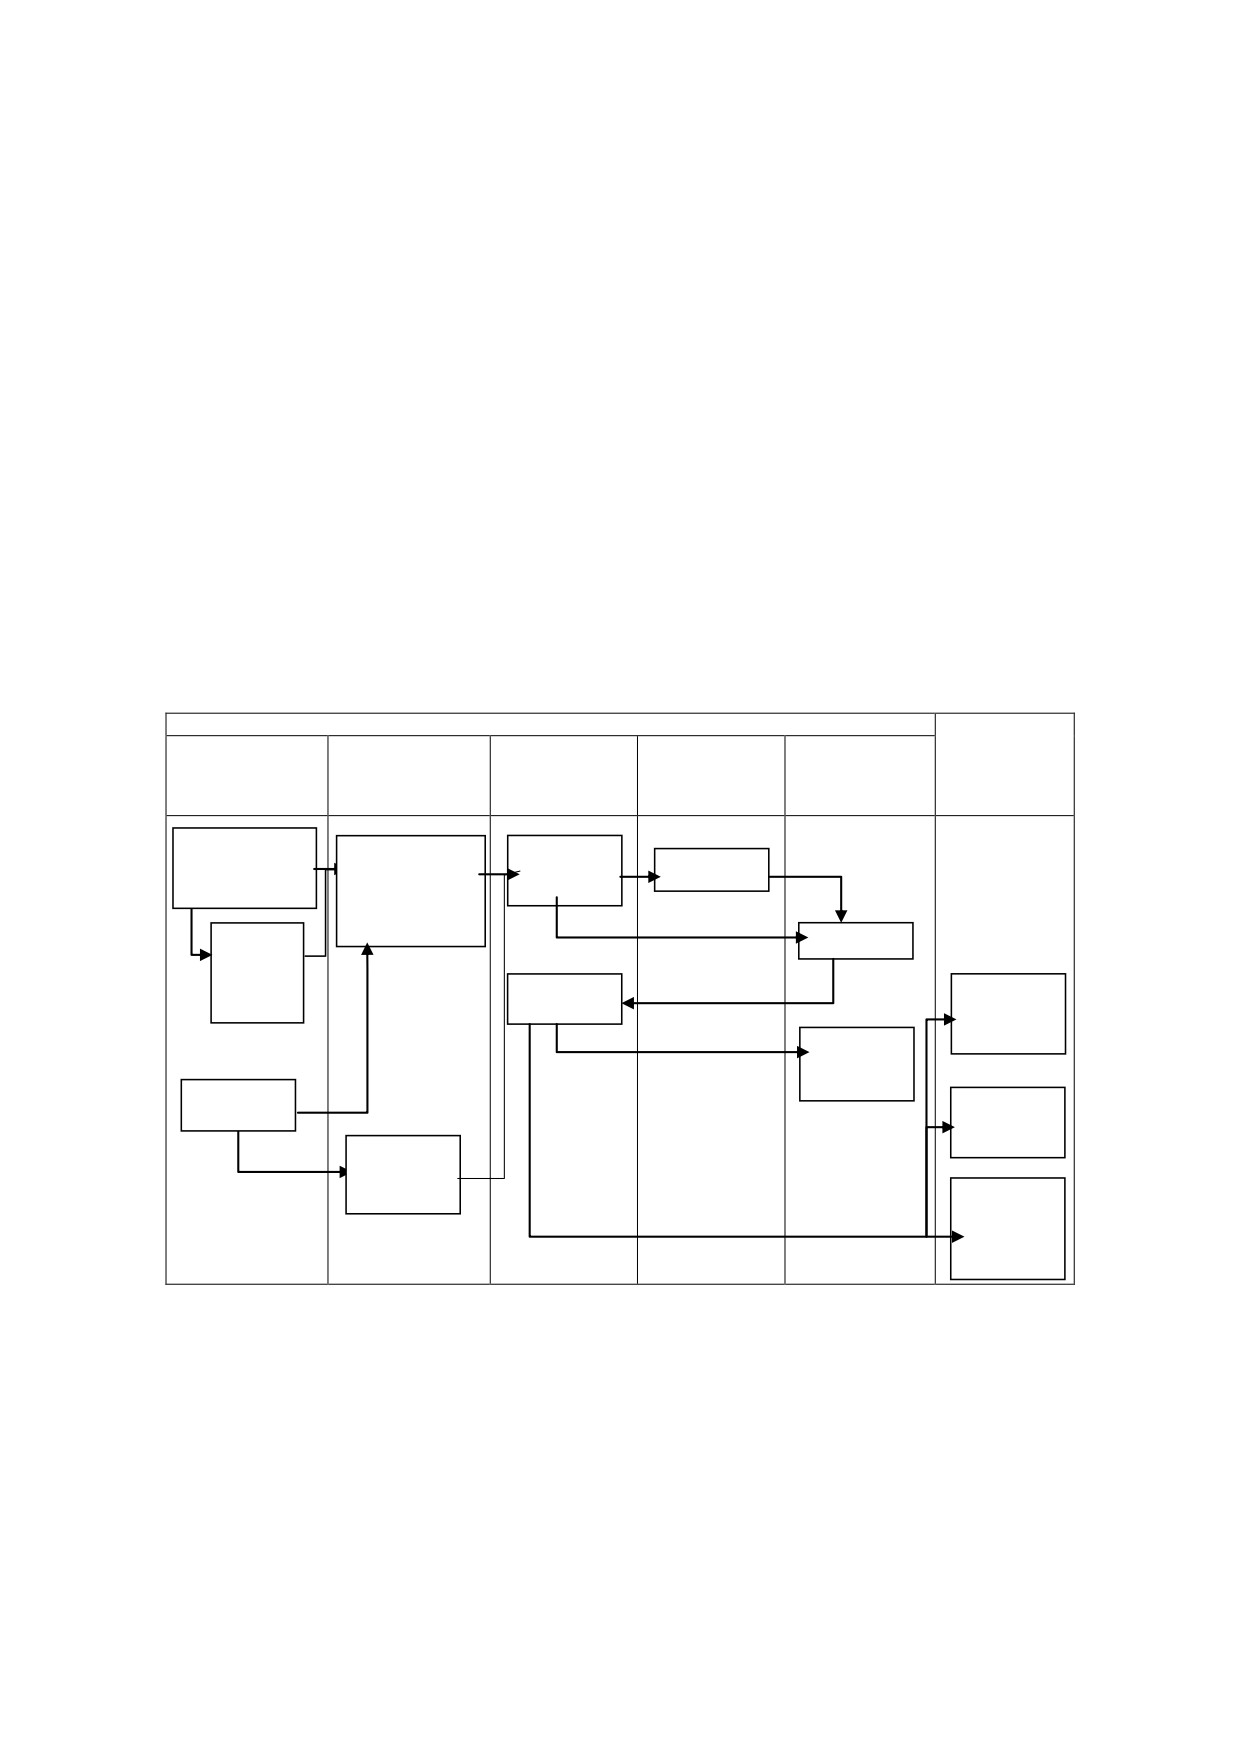
staffs who analyze the data go to refer to the stored reports. The flow of preparing the report
is shown in Figure 1.
Related Sections of DDCA
Client and
DSM Head
AutoCAD
other related
Site
Analysis
Registry Room
Quarters
Room
parties
Hand writing
[Hydro-geologist]
Check and
Drilling Report by
Drawn with
Geological
instructions
Rig in charge
AutoCAD
description and
of typing
pumping test
analysis
[DPO or
Typing up
Zonal
manager]
Check
Final check
[Basin Office]
and signature
Receive
signed report
Store a copy
of signed
report
Pumping Test
[Client]
in charge
Receive
signed report
[Laboratory]
Water Quality
Analysis
[Dodoma
DDCA
Branch
office]
Store report
Figure 1: Flow of current organization of report
1
2. EXISTING WELL COMPLETION REPORT
The well completion reports include two types of forms one is the old forms which had been
used 1931 to 1946,the other one is the existing form currently used(form 1).The forms include
on drilling work, pumping test, water quality analysis. They consistof the following seven
types of forms:
1) cover page, 2) drilling record, 3) well section drawing, 4) step pumping test result, 5)
constant rate pumping test result, 6) recovery test result, and 7) water quality analysis
result.Among the above, the form 2) and 3) are prepared by the drilling teams.
They are prepared in hand writing by each Rig in Charge and sent to the main office in Dar es
Salaam through the Zonal Manager or Drilling Project Officer (DPO). After the examination of
the Head of Drilling Section, the form 2) is typed up in the registry room and the form 3) is
prepared with Auto-CAD in the drawing room. The forms 4) to 6) are prepared by the
pumping test teams. They are filled in hand writing and checked up by the Drilling Manager,
then typed up with MS-Word in the registry room. The typed up reports of the drilling work
and the pumping test are examined by the Drilling Manager. After that they will be approved
by CEO, to submit to the clients together with the form 7) to be prepared in the laboratory and
the form 1) cover page as well.
The set of the well completion report are shown in the Appendices 1-1 to 1-6. The old form is
shown in Appendix 1-2, while the form 1 is shown in Appendix 1-3.
3. INTRODUCTION OF NEW DATABASE SYSTEM
The purpose of the database is to provide the well data which facilitate the private company to
make a proper drilling plan when they start the drilling work in the areas where they do not
have experiences.
Currently, the existing well completion reports are stored in the DDC ’s headquarters in Dar es
Salaam, DDCA branch office in Dodoma and Water Resource Department (WRD) of MoW in
Dodoma. The work of the Contractor includes the data entry of those reports into the
database.After the data entry of all existing well completion reports, DDCA staffs shall continue
the entry of the new coming data. The database shall be constructed according to the
following principles so that DDCA can update the database periodically.
The Software shall be MS-Excel as a versatile and popular one. This enables the DDCA
2
Output (4) Requirement completed
staffs to continue the update and maintenance of the database by themselves.
Too much additional tasks for the updating of new database by DDCA shall be avoided.
Therefore, the change from the existing report making system shall be as less as possible.
Necessary consideration shall be taken such as the utilization of the typed-up data of
handwriting report in existing report as inputs to new database.
Many data items in the database can be commonly used with the “Well Database in
African Countries (WDAF)” of JIC . The database shall be equipped with a function for
the easy transferring of data to the “ frican Countries Well Database” at the same time,
shall be added to the database.
4. REVISION OF FORMS
The form
2) was examined and revised upon the commencement of the database
construction.Hereafter, the existing form is called as “Form 1” (refer to the Appendix 1-2) and
the revised form is called as “Form 2” (refer to the Appendix 2). The purpose of the revision
was to add more information related to well location, well structure and drilling work record.
However, it was considered not to make the staffs spare much time for entering those
additional data. So the existing form has been utilized and only minimal items were added.
The Form 1 consists of the following items:
1) general description of the stratum, 2) record of water strike, 3) drilled diameter and depth,
4) record of casing screen, 5) record of backfilling, 6) record of gravel, 7) record of drilled
method and any other general description.
The column added in the Form 2 is as below.
(1)
General information
The column for entering either borehole newly drilled or rehabilitated was added.
The column for entering GPS coordination was added. The coordination system of GPS was
defined as Arc 1960 UTM.
The column for entering ward, village /street and sub-village were added.
The column for entering the survey reference number of the geophysical survey was added.
(2)
Description of the stratum
The column for entering the water strike was added.
(3)
Record of water strike
3
The column for entering water yield at each water strike depth was added. This information
is important to identify which aquifer was the major one.
The columns for entering the major aquifer and recovered water level were added.
(4)
Drilled diameter and depth
No addition
(5)
Record of casing and screen
The column for entering the position of screen was added.
The columns for screen diameter and depth were added in order to record the telescopic type
casing and screen.
The column for entering the diameter and depth of conductor casing and surface casing were
added.
The column for entering the hole uncased was moved to this section from the section 5 Finish
of Section Uncased of Form 1.
(6)
Finish of Section Uncased and Gravel Screen
5) Finish of Section Uncased and 6) Gravel Screen in Form 1 were combined to be 5) Clearance
Fill Up. The columns for entering Sealing Above Gravel Up To, Back Filling Up To and Sanitary
Sealing were added.
(7)
Drilling Method
The format was changed so that the data on depth and drilling method shall be filled.
The form of drilling work record revised as the above (Form 2) is shown in Appendix 2.
5. DATA SHARING WITH JICA’S WELL DATABASE
Many attributes in WDAF are same as or can be converted from those in WID.
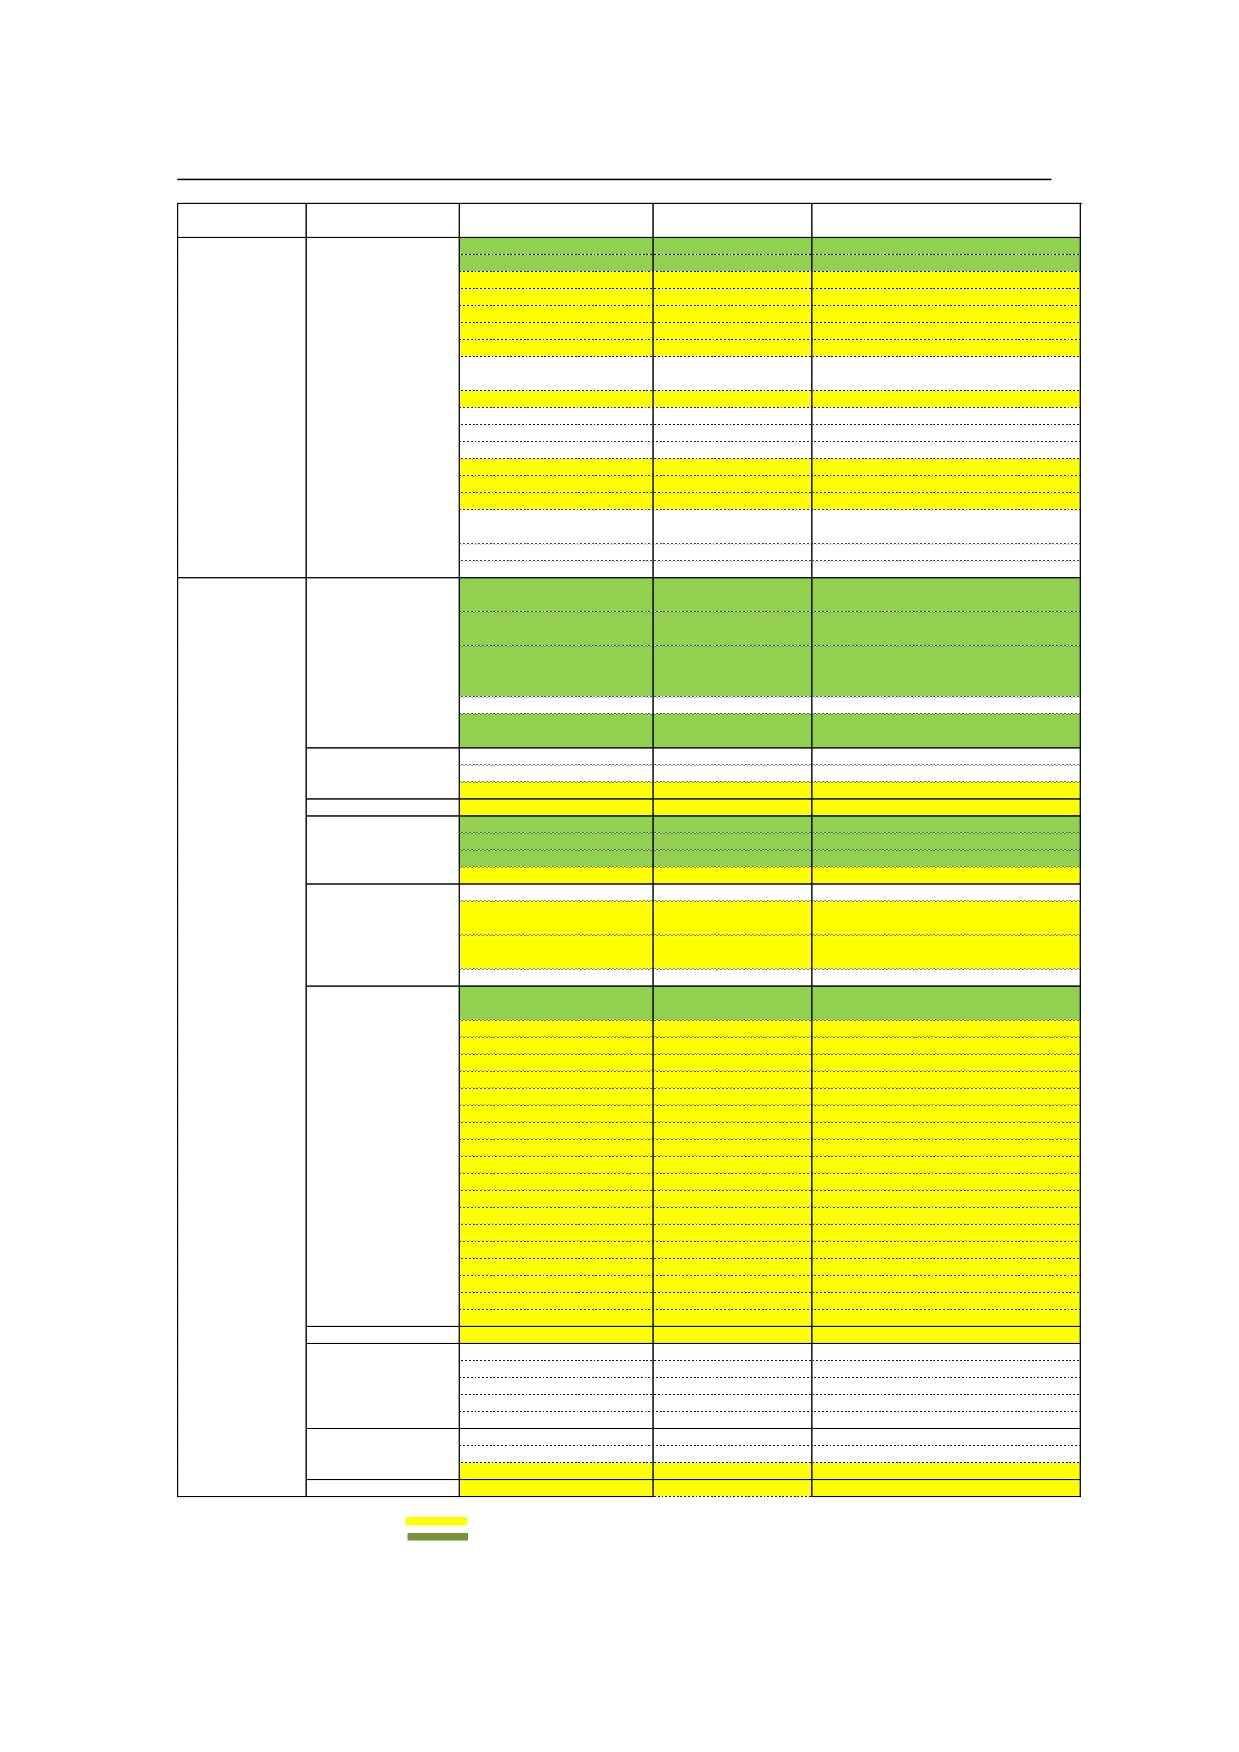
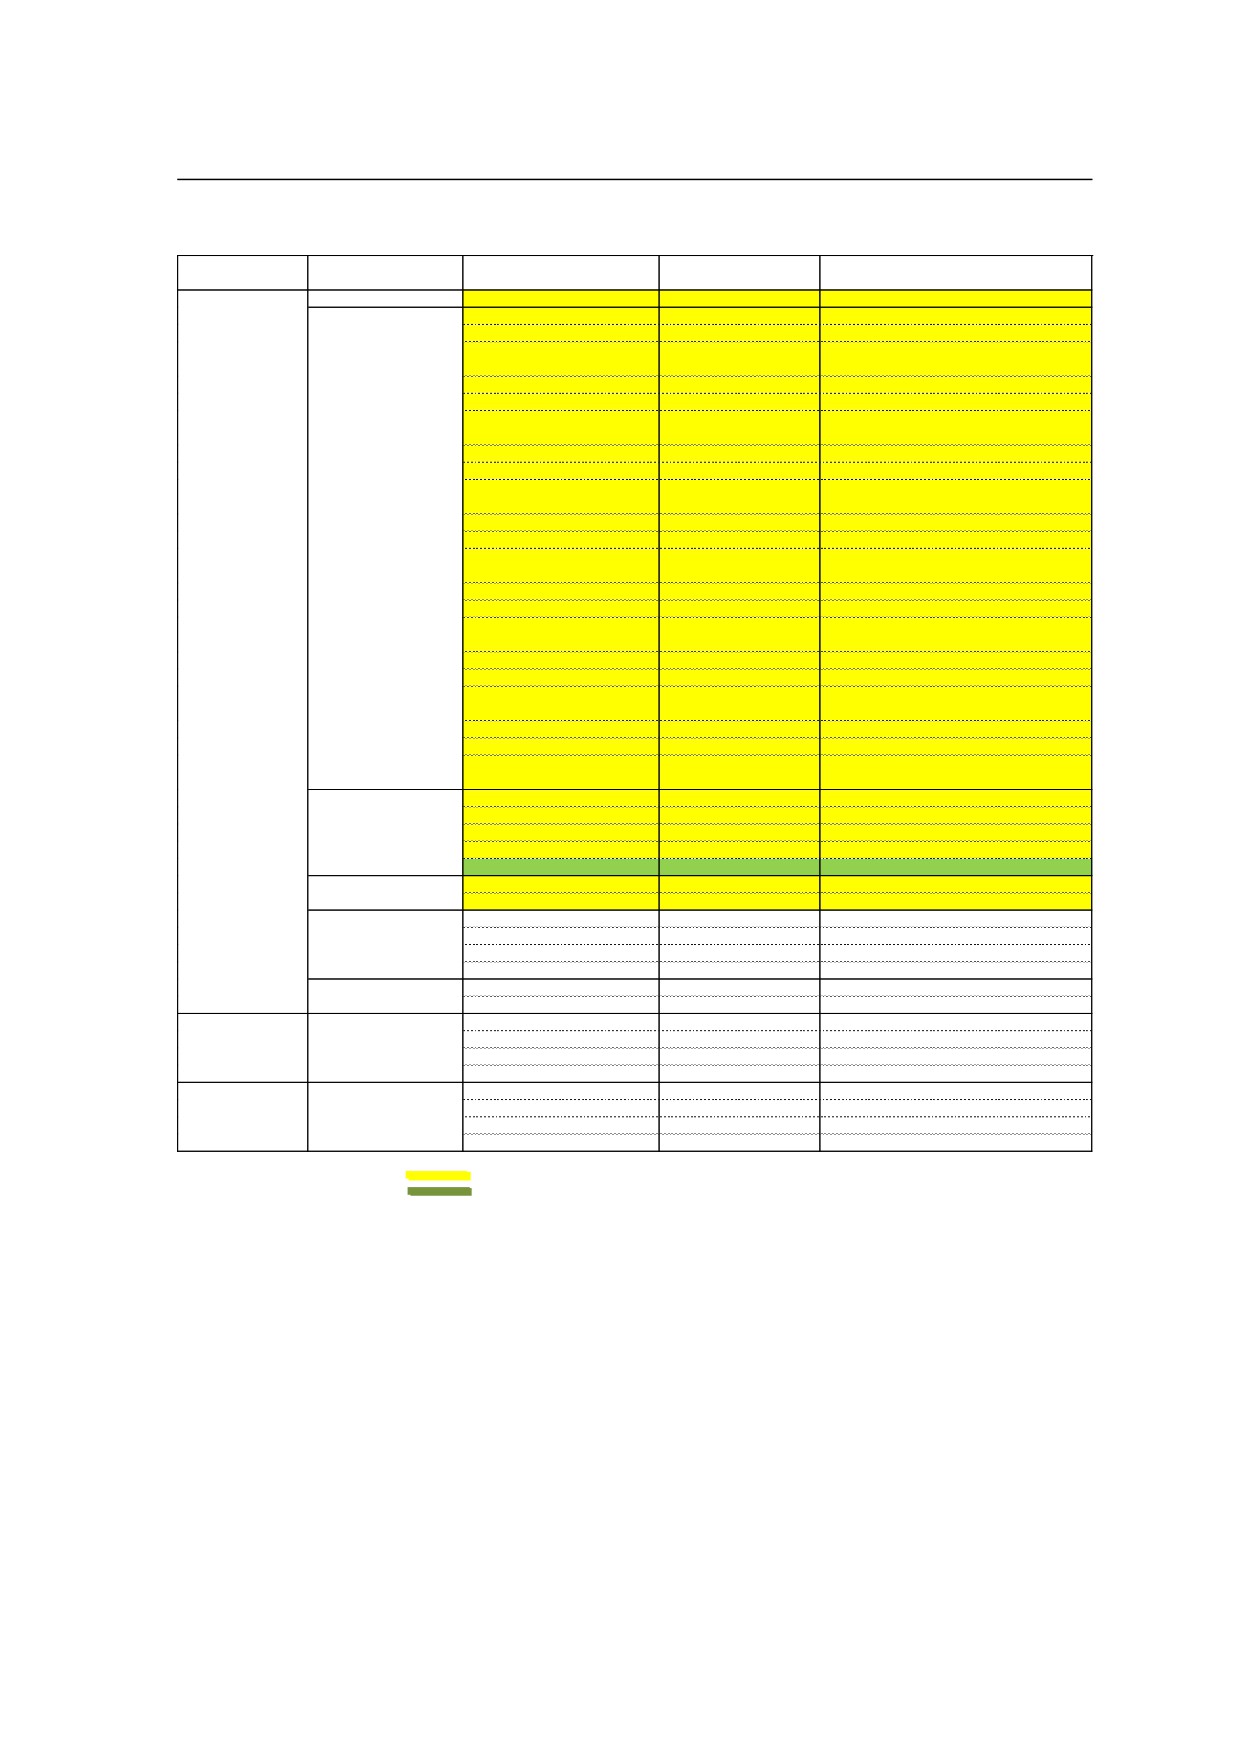
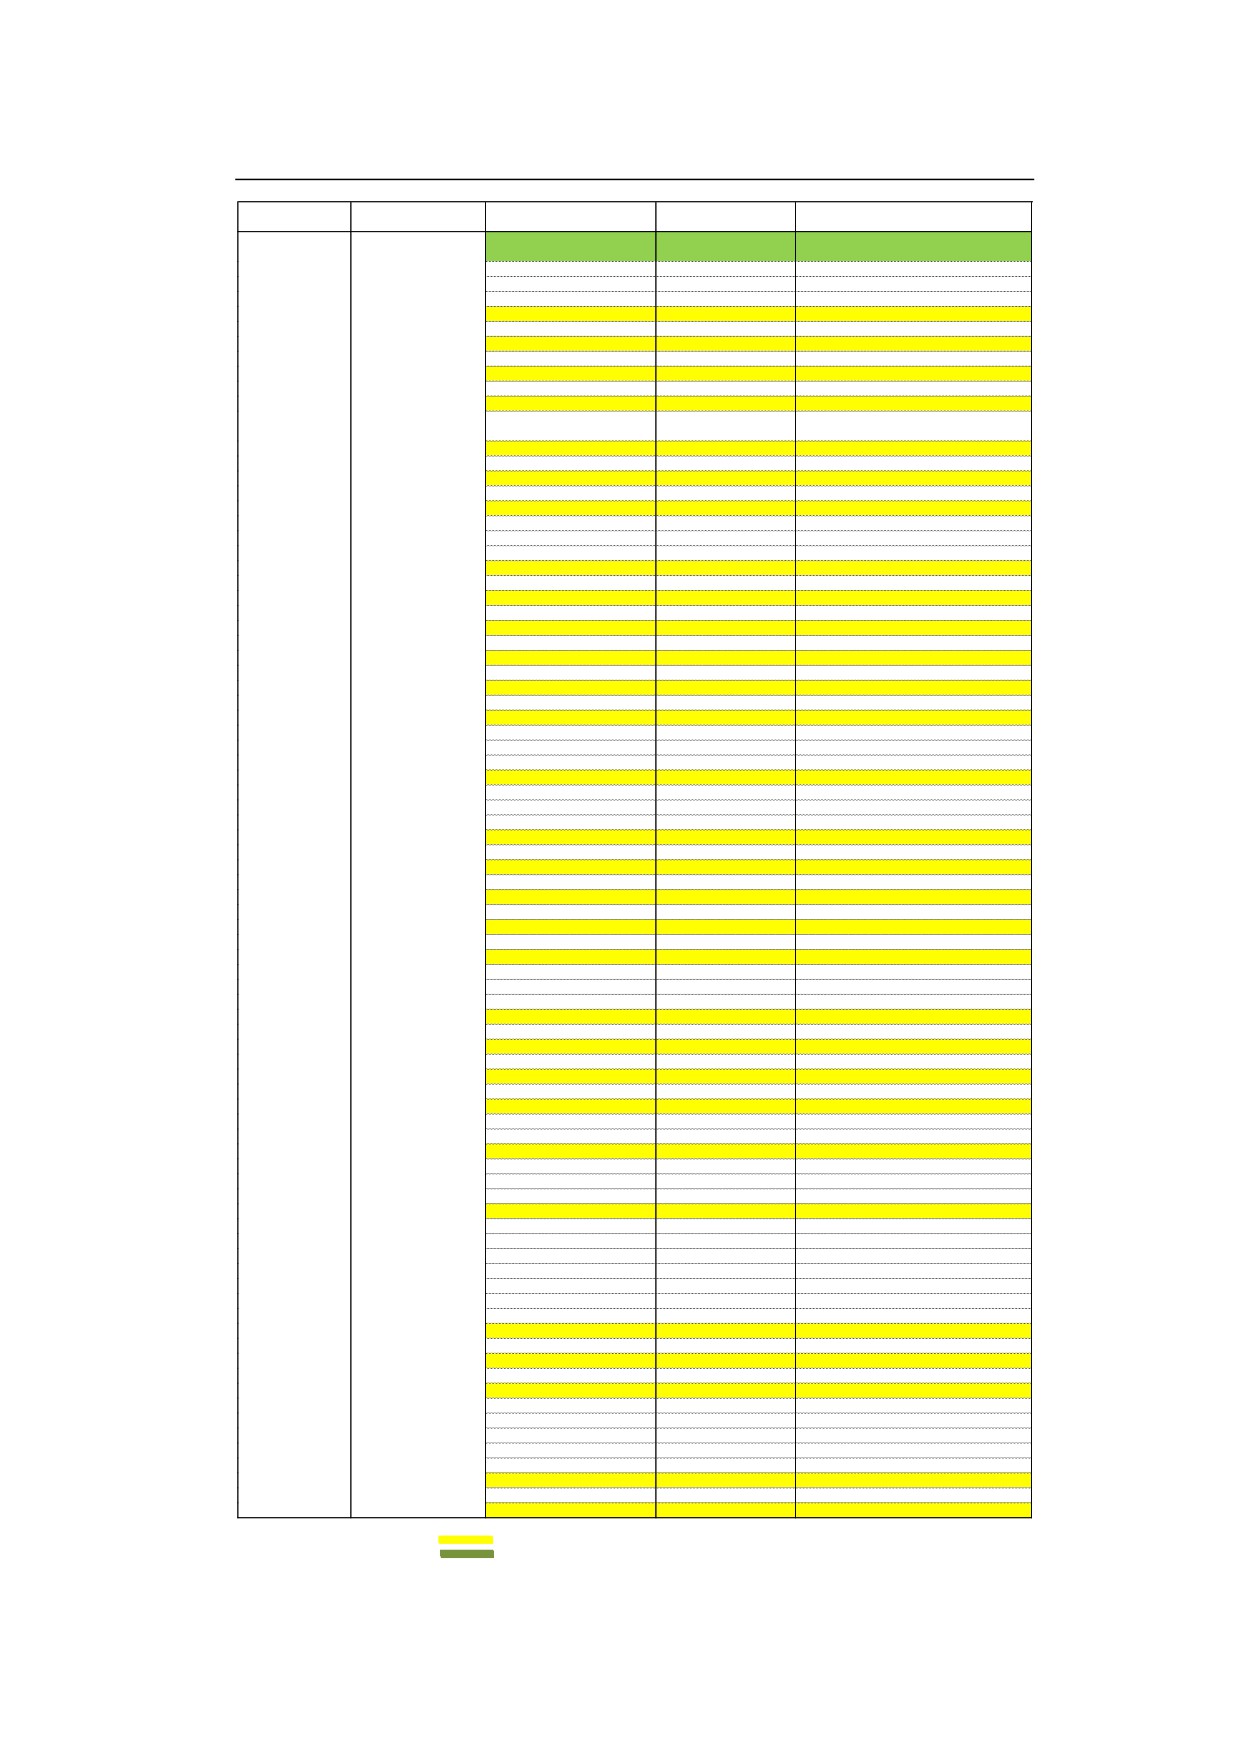
The Appendices 3-1 to 3-4 show the list of the data items of WDAF. The attributes which can
be used for WDAF are shown with filled color (yellow: can be used directly, green: can be
converted by calculation).
Not all attributes of WID can be used in WDAF since the specifications of drilling works of DDCA
differ from those of the groundwater development projects of JICA. However, the
information related to well structure, pumping test and water quality analysis are almost
4
Output (4) Requirement completed
common between above two. So it is useful to produce the data sheet in WDAF’s format
from the data which are entered in WID.
Regarding the implementation of the database, placing all attributes in a data sheet in
MS-Excel will make the data entry works complicated.
The order of the entry sheet of WID is almost same as that of the entry to the well completion
report. Therefore, efficient way for the data entry is to place only the attributes for input in
data sheet in this order. In the same context, another datasheet in a WDAF’s format shall be
set in same excel book as WID’s data sheet and the data of WDAF’s shall be automatically
referred from WID’s data sheet by measures of by direct reference or calculation.
6. CHANGE OF DATABASE SOFTWARE TO MS-EXCEL
6.1 Database Structure in MS-Excel
As mentioned in Section 1.2, the well completion report except for the well section drawing
and the result of water quality analysis are typed up in the registry in the DDCA’s headquarters.
By using these data for the well completion forms as the input for WID, too much increase of
tasks on data entry clerks for the updating WID can be avoided and sustainable operation of
WID can be ensured.
For the pumping test result, only representative data of each pumping test shall be entered to
the WID. Detailed records of draw down etc. shall be entered and saved in the datasheet to
be prepared separately from WID’s self. Currently, the pumping test results are entered to
the forms in MS-Word. By changing these forms into MS-Excel, the data could be easily
utilized for making charts and interpretation of hydraulic constant, in case it is necessary.
WID shall be constructed in MS-Excel in order to allow DDCA staffs easily maintain it by
themselves. Technical support to improve the skills in MS-Excel of DDCA’s staff shall be
provided by the Contractor and JICA Expert Team, since there are currently no staffsthat have
enough skills for the operation and maintenance of the WID.
6.2 Information Retrieval from WID
The borehole data in the WID is helpful for private drilling companies to formulate their drilling
plan and to determine the drilling method. However, if DDCA is equipped with the capacity to
provide them with filtered and/or analysed data according to the needs of the private
companies, the technical support from DDCA will be more effective.
The area-wise analyse will be special useful for the private companies. The maximum,
5
minimum and average value of well depth, well structure and well yield by area will contribute
to the accuracy improvement of the drilling plan and to the prevention of risk to start the
drilling work in inexperienced area.
The existing well completion reports of DDCA include the data of only regions and districts as
the information of well locations but do not have that of wards, villages and GPS coordinates.
DDCA decided to start to record such important data by using the revised drilling record form
which contains the column for entering those data. It means that the new well data will
include this information. On the other hand, DDCA has a plan to start to collect the GPS
coordinates of existing wells and add them to the WID. The WID is expected to provide more
useful information with improved quality by the above updating.
Apart from the area-wise analysis, the analysis by different parameters such as year or drilling
method is one of the major advantages of database. In order to achieve this, DDC ’s staffs
need to acquire the skill of data analysis by MS-Excel.
6
Appendices
Appendix 1-1
Existing Well Completion Report Form Cover Page (Sample)
Appendix 1-2
Existing Well Completion Report Form Drilling Work Record (Old form) (Sample)
Appendix 1-3
Existing Well Completion Report Form Drilling Work Record (Form 1) (Sample)
Appendix 1-4
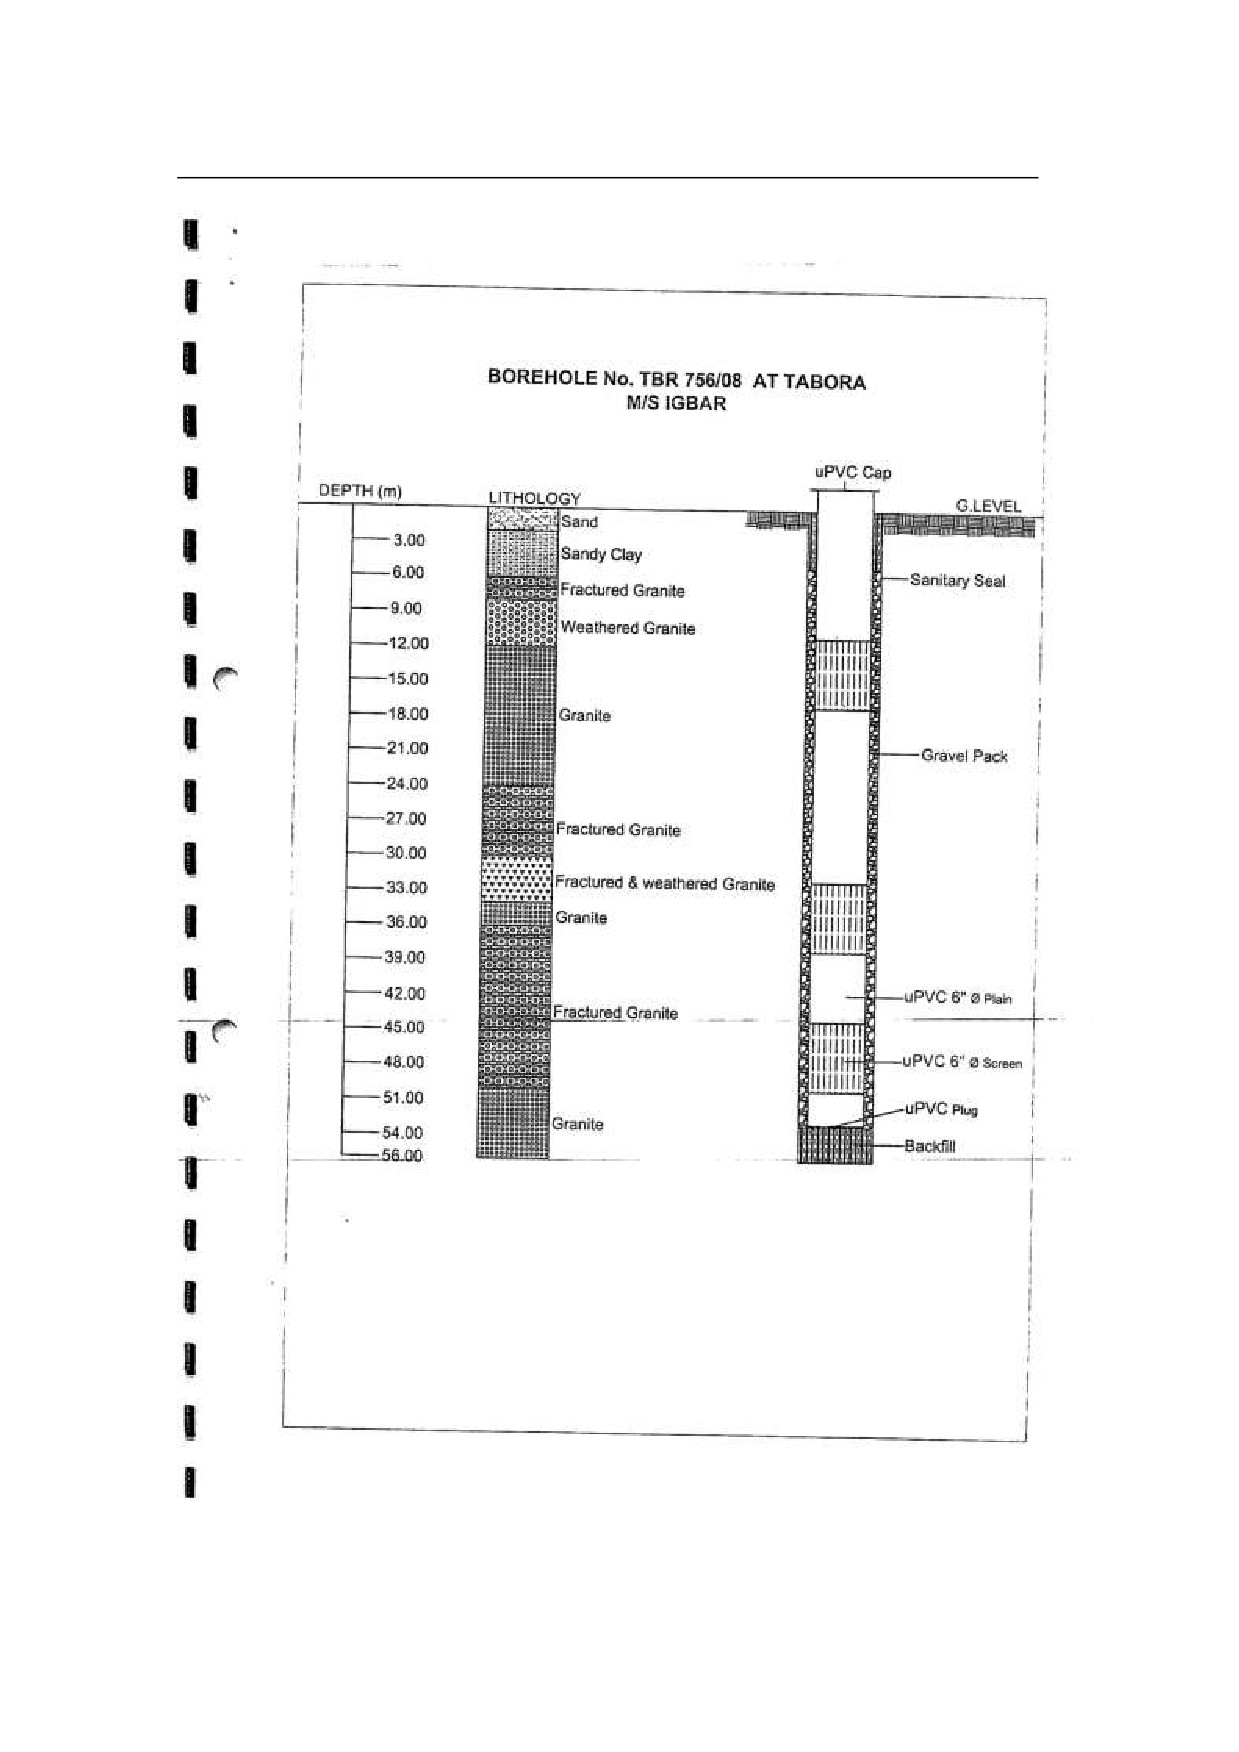
Existing Well Completion Report Form Borehole Section Drawing (Sample)
Appendix 1-5
Existing Well Completion Report Form Constant Pumping Test Result (Sample)
Appendix 1-6
Existing Well Completion Report Form Recovery Test Result (Sample)
Appendix 1-7
Existing Well Completion Report Form Water Quality Analysis Result (Sample)
Appendix 2
Revised Well Completion Report (Form 2) (Sample)
Appendix 3-1
African Countries Well Database Data Item(Well Location and Specification)
Appendix 3-2
African Countries Well Database Data Item(Pumping Test, Pump Installation
and Facility)
Appendix 3-3
African Countries Well Database Data Item (Water Quality Analysis)
Appendix 3-4
African Countries Well Database Data Item (Project Information)
Appendix 1-4
Existing Well Completion Report Form Borehole Section Drawing (Sample)
A-4
Appendix 3-1
African Countries Well Database Data Item(Well Location and Specification)
Group
Category
Data Item of African
Method Extracted
Remarks
Countries Well Database
from DDCA database
Well Location
Well Location
Country No.
For Tanzania
Country Code of Tanzania
Country
For Tanzania
Tanzania
Region
Direct Reference
Added in Revised Form
District
Direct Reference
Division
Direct Reference
Added in revised form
Village
Direct Reference
Added in revised form
Community or Site Name
Direct Reference
Borehole No. in This
No data
Project
Registered Boreholen No.
Direct Reference
Latitude
No data
Longitude
No data
Altitude
No data
UTM Zone
Direct Reference
Added in revised form
UTM X
Direct Reference
Added in revised form(Arc1960)
UTM Y
Direct Reference
Added in revised form(Arc1960)
Coordinate Collected
No data
Point
Accuracy
No data
Map
No data
Well SpecificatioWell Specifications
Positive or Negative
No data
Can be calculated by setting
Borehole
criteria for success
Reason for Negative
No data
Can be calculated by setting
criteria for success
Positive or Negative
No data
Can be calculated by setting
quality
criteria for potable water quality
standard
Remarks
No data
New Construction /
Direct Reference
Added in revised form
Rehabilitation
Geophysical Survey
Present/Absent
No data
Survey Data
No data
Survey No.
Direct Reference
Added in revised form
Drilling Date
Drilling Date
Direct Reference
Date of completion of drilling
Drilling Diameter
Bit Type
Calculation
Calculated from drilling diameter
Drilling Diameter
Calculation
Calculated from drilling diameter
Drilling Liquid
Calculation
Calculated from drilling diameter
Drilling Depth
Direct Reference
Drilling Information
Drilling Rate
No data
Water Strike Depth or Mud
Direct Reference
Water Lost Depth
Water Yield by Air
Direct Reference
Confirmed water yield
Lifting
Acceptable Yield or not
No data
Casing
Installation
Calculation
Calculated from whether or not
casing data exists
Material
Direct Reference
Diameter Size
Direct Reference
Installed Depth
Direct Reference
Top Screen Top
Direct Reference
Top Screen Bottom
Direct Reference
2nd Screen Top
Direct Reference
2nd Screen Bottom
Direct Reference
3rd Screen Top
Direct Reference
3rd Screen Bottom
Direct Reference
4th Screen Top
Direct Reference
4th Screen Bottom
Direct Reference
5th Screen Top
Direct Reference
5th Screen Bottom
Direct Reference
6th Screen Top
Direct Reference
6th Screen Bottom
Direct Reference
7th Screen Top
Direct Reference
7th Screen Bottom
Direct Reference
Toltal Screen Length
Direct Reference
Lithological Log
Geological Column
Direct Reference
Borehole Logging
Logging data
No data
Item 1
No data
Item 2
No data
Item 3
No data
Item 4
No data
Water Level
Measuring Level
No data
Height from Ground Leve
No data
Natural Water Level
Direct Reference
Image of Lithogical
Column Image
Direct Reference
: Data directly to be used in African Countries Well Database
: Data to be extracted from African Countries Well Database by Calculation
A-9
Appendix 3-2
African Countries Well Database Data Item(Pumping Test, Pump Installation
and Facility)
Group
Category
Data Item of African
Method Extracted
Remarks
Countries Well Database
from DDCA database
Pumping Test
Pumping Test Date
Test Starting Date
Direct Reference
Step Drawdown Test
1st Step Discharging Rate
Direct Reference
1st Step Pumping Time
Direct Reference
1st Step Dinamic Water
Direct Reference
Level
2nd Step Discharging Rate
Direct Reference
2nd Step Pumping Time
Direct Reference
2nd Step Dinamic Water
Direct Reference
Level
3rd Step Discharging Rate
Direct Reference
3rd Step Pumping Time
Direct Reference
3rd Step Dinamic Water
Direct Reference
Level
4th Step Discharging Rate
Direct Reference
4th Step Pumping Time
Direct Reference
4th Step Dinamic Water
Direct Reference
Level
5th Step Discharging Rate
Direct Reference
5th Step Pumping Time
Direct Reference
5th Step Dinamic Water
Direct Reference
Level
6th Step Discharging Rate
Direct Reference
6th Step Pumping Time
Direct Reference
6th Step Dinamic Water
Direct Reference
Level
7th Step Discharging Rate
Direct Reference
7th Step Pumping Time
Direct Reference
7th Step Dinamic Water
Direct Reference
Level
Constant Dicharge Ra
Starting Water Level
Direct Reference
Discharging Rate
Direct Reference
Pumping Time
Direct Reference
Draw Down Level
Direct Reference
Specific Capacity
Calculation
Recovery Test
Measured Time
Direct Reference
Recovered Water Level
Direct Reference
Pumping Test Interpr
Transmissivity
No data
Permeability
No data
Transmissivity
No data
Permeability
No data
Image of Pumping Tes
Analyzed Data
No data
Pump Test Image
No data
Water Supply PumpPump for Water Suppl
Type
No data
Model
No data
Specification
No data
Installed Depth
No data
Superstructure
Superstructure
Platform
No data
Constructional Purpose
No data
Holder
No data
Image
No data
: Data directly to be used in African Countries Well Database
: Data to be extracted from African Countries Well Database by Calculation
A-10
Appendix 3-3
African Countries Well Database Data Item (Water Quality Analysis)
Group
Category
Data Item of African
Method Extracted
Remarks
Countries Well Database
from DDCA database
Water Quality AnaWater Quality Analys
Data Present or not
Calculation
Calculated from whether or not
data exists
Color
No data
Color
No data
Color mgPt/l
No data
Color mgPt/l
Direct Reference
Turbidity
No data
Turbidity
Direct Reference
Odor
No data
Taste
Direct Reference
Temperature
No data
pH
Direct Reference
Oxidation-reduction
No data
Potential ORP
Conductivity
Direct Reference
Total Dissolved Solid TDS
No data
Total Dissolved Solid TDS
Direct Reference
Total Hardness TH
No data
Total Hardness TH
Direct Reference
Alminium Al
No data
Alminium Al
No data
Ammonium NH3
No data
Ammonium NH3
Direct Reference
Iron Fe
No data
Iron Fe
Direct Reference
Fluoride F
No data
Fluoride F
Direct Reference
Manganese Mn
No data
Manganese Mn
Direct Reference
Nitrate NO3
No data
Nitrate NO3
Direct Reference
Nitrit NO2
No data
Nitrite
Direct Reference
Disolved Oxygen DO
No data
Disolved Oxygen DO
No data
Phosphorus P
No data
Phosphorus P
Direct Reference
Phosphate PO43-
No data
Phosphate PO43-
No data
Sodium Na
No data
Sodium Na
Direct Reference
Zinc Zn
No data
Zinc Zn
Direct Reference
Calcium Ca
No data
Calcium Ca
Direct Reference
Magnesium Mg
No data
Magnesium Mg
Direct Reference
Potassium K
No data
Potassium K
Direct Reference
Bicarbonates HCO3-
No data
Bicarbonates HCO3-
No data
Carbonate CO3-
No data
Carbonate CO3-
Direct Reference
Chloride Cl-
No data
Chloride Cl-
Direct Reference
Sulfate SO42-
No data
Sulfate SO42-
Direct Reference
Alcalinite
No data
Alcalinite
Direct Reference
TAC
No data
Lead Pb
No data
Lead Pb
Direct Reference
Palladium Pd
No data
Palladium Pd
No data
Mercury Hg
No data
Mercury Hg
Direct Reference
Selenium Se
No data
Selenium Se
No data
Arsenic As
No data
Arsenic As
No data
Boron B
No data
Boron B
No data
Cadmium Cd
No data
Cadmium Cd
Direct Reference
Copper Cu
No data
Copper Cu
Direct Reference
Chromium Cr
No data
Chromium Cr
Direct Reference
Sexivalent Chromium Cr6+
No data
Sexivalent Chromium Cr6+
No data
General Bacteria
No data
General Bacteria
No data
Total Coliform
No data
Total Coliform
Direct Reference
Facal Coliform, E-Coli
No data
Facal Coliform, E-Coli
Direct Reference
: Data directly to be used in African Countries Well Database
: Data to be extracted from African Countries Well Database by Calculation
A-11

Appendix 3-4
African Countries Well Database Data Item (Project Information)
Group
Category
Data Item of African
Method Extracted
Remarks
Countries Well Database
from DDCA database
Project Information
Project Name
No data
Consultant
No data
Contractor
No data
Year Submitted Report
No data
Construction Works
No data
Started
Construction Works
No data
Finished
Drilled Boreholes
No data
Positive Boreholes
No data
Negative Boreholes
No data
Q'ty of Negative Yield
No data
Q'ty of Negative quality
No data
Q'ty of Boreholes the
No data
reason for rejection is
not knowable
Success Rate
No data
Q'ty of Rehabilitation
No data
Remarks
No data
Project Summary (Jp)
No data
Project Summary (English)
No data
A-12
LOCAIDES GENERAL SUPPLY LIMITED
P.O. Box 33333, Dar es Salaam. Survey, Kinondoni
Tel:2700096 Fax: 2700096
email: locaides@gmail.com,bertharicky@yahoo.com
GROUNDWATER DEVELOPMENT AND MANAGEMENT
CAPACITY DEVELOPMENT PROJECT
DDCAP
OUTPUT (5) SYSTEM ANALYSIS AND DESIGN
COMPLETED
OCTOBER 2012
LOCAIDES GENERAL SUPPLY LIMITED
Table of Contents
1. ATTRIBUTES TO BE STORED IN DATABASE
1
2. DESCRIPTION OF ATTRIBUTES TO BE STORED IN DATABASE
2
3. CONTENTS OF REPEATING GROUP AND MAXIMUM NUMBER OF DATA
1
4. DATABASE DESIGN
3
5: DATA ENTRY AND DATABASE MAINTENANCE ORGANIZATION
5
6: COMPUTER NETWORKING SYSTEM
8
7. TECHNICAL SUPPORT FOR UPDATE AND MAINTENACE OF DATABASE
9
Tables
Table 1: Description of Attribute
2
Figures
Figure 1: Attributes to be Stored in Database
1
Figure 2: Roles of Concerned Staffs and Flow of Well Completion Report Preparation
................................................................................................................................. 7
Figure 3: Computer Network
9
Output (5) System Analysis Completed
1. ATTRIBUTES TO BE STORED IN DATABASE
As much as possible, all the data shall be able to be entered in only one datasheet of MS-Excel,
from left to right according to the same order of the data in well completion report.
The attributes in the data sheet are lined up as a queue from left to right on the top of the
sheet. The data shall be entered to the one row under those attributes as the data to one
well. This structure is same as WDAF.
The following E-R diagram shows the attributes to be stored in the database.
Figure 1: Attributes to be Stored in Database
1
Output (5) System Analysis Completed
2. DESCRIPTION OF ATTRIBUTES TO BE STORED IN DATABASE
Table 1: Shows the description of each attribute to be stored in the database.
Table 1: Description of Attribute
No.
Data item
Description
Types of data
Remarks
1
Region
Locality information. Region of the drilling point.
text
Unique to a well
2
District
Locality information. District of the drilling point.
text
Unique to a well
3
Ward
Locality information. Ward of the drilling point.
text
Unique to a well
4
Village/Street
Locality information. Village/Street of the drilling point.
text
Unique to a well
5
Sub Village
Locality information. Sub Village of the drilling point
text
Unique to a well
Locality information. Name of the belonging facility/house/area
6
Location / Area
text
Unique to a well
etc.
7
Work Scope
New borehole construction, rehabilitation or any other scope
text
Unique to a well
8
Drilled by (Rig No.)
Rig No. of the drilling rig which drilled the borehole
Number
Unique to a well
9
Drilled by (Rig Type)
Rig type of the drilling rig which drilled the borehole
text
Unique to a well
10
Borehole No.
Officially registered number with the water office
Number
Unique to a well
11
UTM Zone
Locality information. UTM zone of the drilling point
Text
Unique to a well
12
Coordinate (X)
Locality information. UTM (X) of the drilling point
Number
Unique to a well
13
Coordinate (Y)
Locality information. UTM (Y) of the drilling point
Number
Unique to a well
14
Elevation
Locality information. Elevation of the drilling point
Number
Unique to a well
15
Applicant id
Client id registered in DDCA
Number
Unique to a well
2
Output (5) System Analysis Completed
No.
Data item
Description
Types of data
Remarks
16
Applicant Name
Client Name
Text
Unique to a well
17
Applicant Address
Client Address
Text
Unique to a well
18
Date of Commencement
Date of commencement of the drilling work
Date
Unique to a well
19
Date of Completion
Date of completion of the drilling work
Date
Unique to a well
20
Survey Ref. No.
Ref. No of survey which is for the drilling point
Number
Unique to a well
21
Drawing
Number of drawing belonging to this report
Number
Unique to a well
22
Name of Driller in charge
Name of driller in charge who drilled the borehole
Text
Unique to a well
23
Remarks
Any remarks regarding drilling works
Text
Unique to a well
24
Signature
Signature
Signature
Unique to a well
25
Strata from
Top depth of distribution range of an each lithological description
Number
Many to each well
Bottom depth of distribution range of an each lithological
26
Strata to
Number
Many to each well
description
27
General Description
Lithological description of cuttings
Text
Many to each well
28
Water Strike
The zone where the water came from
Number
Many to each well
29
Strike at Depth from
Starting depth of the zone where the water increased
Number
Many to each well
30
Strike at Depth to
Ending depth of the zone where the water increased
Number
Many to each well
31
Yield
Measured water yield at the end of the zone the water increased
Number
Many to each well
32
Water Level Rose to
Water level at the end of drilling work
Number
Unique to a well
33
Yield Tested
Yield at the end of development
Number
Unique to a well
34
Water Quality to Taste
Taste of water
Text
Unique to a well
35
Depth on Completion
Total drilling depth
Number
Unique to a well
3
Output (5) System Analysis Completed
No.
Data item
Description
Types of data
Remarks
36
Diameter Drilled
Diameter and drilled borehole
Number
Many to each well
37
Depth Drilled
Drilling depth of each diameter
Number
Many to each well
38
Casing Type
PVC, steel, FRP etc.
Text
Many to each well
39
Casing Diameter
Diameter of the installed casing
Number
Many to each well
40
Casing Length
Length of the installed casing
Number
Many to each well
41
Casing Thickness
Thickness of the installed casing
Number
Many to each well
42
Screen Position from
Top depth of each screen position
Number
Many to each well
43
Screen Position to
Bottom depth of each screen position
Number
Many to each well
44
Casing above GL
Remnant of the casing standing above ground level
Number
Unique to a well
Top of Casing
45
Material or type of top plug
Text
Unique to a well
Secured/Top Plug
Bottom End of Casing
46
Protected with Bottom
Material or type of bottom plug
Text
Unique to a well
plug
47
Hole Uncased up to
Top depth of zone without permanent casing
Number
Unique to a well
48
Backfilled to
Top depth of bottom back filling
Number
Unique to a well
49
Filled with
Material for backfilling
Text
Unique to a well
50
Average Size
Average size of the material of backfilling
Number
Unique to a well
51
Other Method
Text
Unique to a well
52
Length
Length of the installed casing
Number
Unique to a well
Conductor Casing
53
Diameter of the conductor casing
Number
Unique to a well
Diameter
4
Output (5) System Analysis Completed
No.
Data item
Description
Types of data
Remarks
54
Conductor Casing GL to
Installation depth of the conductor casing
Number
Unique to a well
55
Surface Casing GL to
Installation depth of the surface casing
Number
Unique to a well
57
Diameter from
Top depth of gravel zone
Number
Unique to a well
58
Diameter to
Bottom depth of gravel zone
Number
Many to each well
59
Gravel Type
Gravel type
Text
Many to each well
60
Sealing Position
Top depth of sealing position above gravel
Number
Unique to a well
61
Sealing Material
Material of sealing above gravel
Text
Unique to a well
62
Average Size
Average size of the gravel
Number
Unique to a well
63
Inserted from
Top depth of the gravel position
Number
Unique to a well
64
Inserted to
Bottom depth the gravel position
Number
Unique to a well
No. of Cubic Meter
65
Volume of gravel
Number
Unique to a well
Inserted
66
Bottom Backfilling up to
Top depth of bottom backfilling below permanent casing
Number
Unique to a well
Bottom Backfilling up
67
Material of bottom backfilling
Text
Unique to a well
Material
Bottom Backfilling up
68
Material size of bottom backfilling
Number
Unique to a well
Material Size
69
Gravel Filling up to
Top depth of gravel packing
Number
Unique to a well
70
Gravel Filling up Material
Material of gravel
Text
Unique to a well
Gravel Filling up Material
71
Size of gravel
Number
Unique to a well
Size
72
Sealing above Gravel up
Top depth of sealing position above gravel
Number
Unique to a well
5
Output (5) System Analysis Completed
No.
Data item
Description
Types of data
Remarks
to
Sealing above Gravel up
73
Material of sealing above gravel
Text
Unique to a well
Material
74
Backfilling up to
Top depth of backfilling above sealing
Number
Unique to a well
75
Backfilling up Material
Material of backfilling above sealing
Text
Unique to a well
Backfilling up Material
76
Size of material of backfilling above sealing
Number
Unique to a well
Size
77
Sanitary Sealing from
Bottom depth of sanitary sealing (it should be "backfilling up to")
Number
Unique to a well
78
Sanitary Sealing to
Top of sanitary sealing (normally it is GL)
Number
Unique to a well
79
Sanitary Sealing Material
Material for sanitary sealing
Text
Unique to a well
80
Method Name
Drilling method
Text
Many to each well
81
From
Started depth of the drilling method
Number
Many to each well
82
To
ended depth of the drilling method
Number
Many to each well
83
Date from
Commencement date of pumping test
Date
Unique to a well
84
Step SWL
Static water level at the beginning of step drawdown test
Number
Unique to a well
85
Step Discharge Rate
Discharge rate of the step drawdown test
Number
Many to each well
86
Step Pumping Time
Pumping time of the step
Number
Many to each well
87
Step DWL
Drawdown water level of the step
Number
Many to each well
88
Constant SWL
Static water level at the beginning of constant test
Number
Unique to a well
89
Constant Discharge Rate
Discharge rate of the constant test
Number
Unique to a well
90
Constant Pumping Time
Pumping time of the constant discharge test
Number
Unique to a well
91
Constant DWL
Drawdown of the constant test
Number
Unique to a well
6
Output (5) System Analysis Completed
No.
Data item
Description
Types of data
Remarks
Recovery Measuring
92
Duration of recovery measuring
Number
Unique to a well
Time
93
Recovery WL rose to
Water level at the end of the recovery test
Number
Unique to a well
94
Conducted for
Purpose of the pumping test
Text
Unique to a well
95
Conducted by
Operator of the pumping test
Text
Unique to a well
96
SWL at
Static water level at the beginning of the pumping test
Number
Unique to a well
97
Draw down
Drawdown of the pumping test
Number
Unique to a well
98
Yield
Yield of the pumping test
Number
Unique to a well
Type of pumping test like preliminary, step drawdown, constant
99
Type of Pumping Test
Text
Unique to a well
rate, or recovery.
100
No. of Steps
Number of steps. Constant rate test and recovery is one step.
Number
Unique to a well
Out Flow Measurement
101
The volume of the equipment to measure the discharging.
Number
Unique to a well
with Tank Capacity of
102
Airlift Size
Airlift pipe size
Number
Unique to a well
103
ALSP laced at depth of
The length of the airlift pipe
Number
104
Pump Cylinder Size
Pump cylinder size
Number
Unique to a well
105
PCS Placed at Depth of
Pump cylinder setting depth
Number
Unique to a well
106
Equipment
Equipment
Text
Unique to a well
107
Pump Model
Pump model
Text
Unique to a well
108
EPM Placed at Depth of
Pump setting depth
Number
Many to each well
109
Date
Started date of pumping test
Date
Many to each well
110
Time Hour
Measured time; hour
Number
Many to each well
7
Output (5) System Analysis Completed
No.
Data item
Description
Types of data
Remarks
111
Time Minute
Measured time; minute
Number
Many to each well
112
Meter
Measured value: meter
Number
Many to each well
113
Centimeter
Measured value: centimeter
Number
Many to each well
114
Yield LPH
Discharging
Number
Many to each well
Discharge Measured
115
Equipment to measure discharging
Text
Many to each well
Using
116
Remarks
Remarks regarding the pumping test
Text
Many to each well
117
Date
Starting date of recovery test
Date
Many to each well
118
Time Hour
Measured time; hour
Number
Many to each well
119
Time Minutes
Measured time; minute
Number
Many to each well
120
Time Difference
Total duration from the beginning of constant test
Number
Many to each well
121
WL Raised to
Recovered water level
Number
Many to each well
122
Additional Notes
Additional notes
Text
Many to each well
123
Remarks
Remarks regarding the pumping test
Text
Many to each well
124
Turbidity
One of parameter of water quality
Number
Unique to a well
125
Color
One of parameter of water quality
Text
Unique to a well
126
Settable Matter
One of parameter of water quality
Text
Unique to a well
127
PH
One of parameter of water quality
Number
Unique to a well
128
Taste
One of parameter of water quality
Text
Unique to a well
Conductivity at
129
One of parameter of water quality
Text
Unique to a well
25C/Salinity
130
Total Dissolved Solid
One of parameter of water quality
Number
Unique to a well
8
Output (5) System Analysis Completed
No.
Data item
Description
Types of data
Remarks
Total Non filterable
131
One of parameter of water quality
Number
Unique to a well
Residual at 105C
Total Volatile and Fixed
132
One of parameter of water quality
Number
Unique to a well
Residual at 550C
133
Alkalinity (as CaCo3)
One of parameter of water quality
Number
Unique to a well
134
Phenolphthalein
One of parameter of water quality
Number
Unique to a well
135
Total Alkalinity
One of parameter of water quality
Number
Unique to a well
136
Hardness (as CaCo3)
One of parameter of water quality
Number
Unique to a well
137
Carbonate
One of parameter of water quality
Number
Unique to a well
138
Non Carbonate
One of parameter of water quality
Number
Unique to a well
139
Total Hardness
One of parameter of water quality
Number
Unique to a well
140
Calcium
One of parameter of water quality
Number
Unique to a well
141
Magnesium
One of parameter of water quality
Number
Unique to a well
142
Sodium
One of parameter of water quality
Number
Unique to a well
143
Potassium
One of parameter of water quality
Number
Unique to a well
144
Cadmium
One of parameter of water quality
Number
Unique to a well
145
Chromium
One of parameter of water quality
Number
Unique to a well
146
Copper
One of parameter of water quality
Number
Unique to a well
147
Iron
One of parameter of water quality
Number
Unique to a well
148
Lead
One of parameter of water quality
Number
Unique to a well
149
Manganese
One of parameter of water quality
Number
Unique to a well
150
Mercury
One of parameter of water quality
Number
Unique to a well
9
Output (5) System Analysis Completed
No.
Data item
Description
Types of data
Remarks
151
Zinc
One of parameter of water quality
Number
Unique to a well
152
Total Nitrogen
One of parameter of water quality
Number
Unique to a well
153
Ammonical Nitrogen
One of parameter of water quality
Number
Unique to a well
154
Organic Nitrogen
One of parameter of water quality
Number
Unique to a well
155
Nitrate Nitrogen
One of parameter of water quality
Number
Unique to a well
156
Total Phosphorus
One of parameter of water quality
Number
Unique to a well
157
Orthophosphate
One of parameter of water quality
Number
Unique to a well
158
Sulphate
One of parameter of water quality
Number
Unique to a well
159
Chloride
One of parameter of water quality
Number
Unique to a well
160
Fluoride
One of parameter of water quality
Number
Unique to a well
161
Others Total Coliform
One of parameter of water quality
Number
Unique to a well
162
Faecal Strep otococci
One of parameter of water quality
Number
Unique to a well
163
AsmgKMnO/L
One of parameter of water quality
Number
Unique to a well
164
BOD(5Days)
One of parameter of water quality
Number
Unique to a well
165
Chlorine Residual
One of parameter of water quality
Number
Unique to a well
166
Remarks
Remarks regarding water quality analysis
Text
Unique to a well
167
Note
Note
Text
Unique to a well
168
Reporting Officer Name
Name of the laboratory which analysed water quality
Text
Unique to a well
169
Signature
Person who signed
Signature
Unique to a well
170
Position
Position of the signer
Text
Unique to a well
171
Ref No.
Reference number of the analysis
Number
Unique to a well
10
Output (5) System Analysis Completed
No.
Data item
Description
Types of data
Remarks
172
Telephone
Telephone number of the laboratory
Number
Unique to a well
173
Telegram
Telegram of the laboratory
Number
Unique to a well
E-mail
174
Email
E-mail address of the laboratory
Unique to a well
address
175
Fax No.
Fax number of the laboratory
Number
Unique to a well
Person or organization who requested the analysis. It may be
176
Analysis Requested by
Text
Unique to a well
DDCA
177
Dated
Analysis date
Date
Unique to a well
Date Received At
178
Date that the laboratory received the water sample
Date
Unique to a well
Laboratory
Date Collected For
179
Date that the water sample was collected at site
Date
Unique to a well
Analysis
Time Collected For
180
Time that the water sample was collected at site
Date
Unique to a well
Analysis
181
Temperature
Temperature
Number
Unique to a well
182
Purpose of Sampling
Purpose of sampling
Text
Unique to a well
Preservative Added/Type
183
of Treatment to Water
Preservatives for the water sample before analysis if added
Text
Unique to a well
before Sampling
11
3. CONTENTS OF REPEATING GROUP AND MAXIMUM NUMBER
OF DATA
The attributes without filled color in the Appendix 4 are repeating groups to a well or a
pumping test (hereafter called as “repeating group”). Therefore, it is necessary to secure the
necessary numbers of columns which allows the maximum possible numbers of data in data
sheet in MS-Excel.
The contents of the repeating group and the maximum number of the data are described
below.
In case the data exceeds to the maximum number of the data, the necessary number of the
column in data sheet in MS-Excel shall be added.
(1) Strata
The record of strata includes the following attributes;
Strata From: the depth of each starting stratum
Strata To: the depth of each ending stratum
Description of strata: description on each stratum
Water Strike: whether or not there was water strike at each stratum
The division of the strata at each well is of two to three at minimum and more than 10 at most.
Accordingly, 20 numbers of the data would be enough for the record of strata.
Principally, all data shall be included in one data sheet. However, as the strata record has
many data, they shall be entered in separated data sheet. This makes the work of data entry
easier.
(2) Water Strike
The record of water strike includes the following attributes;
Depth of Water Strike From: the starting depth of the water strike
Depth of Water Strike To: the ending depth of the water strike
Yield: Measured yield
The maximum number of the data shall be six since the supposed numbers of water strike are
zero to six.
Output (5) System Analysis Completed
(3) Drilled diameter/depth
The drilled diameter/depth includes the following attributes;
Drilled Diameter: the diameter drilled in each drilling stage
Drilled Depth: the depth drilled in each drilling stage
The number of the data item is equal to the number of drilling stage. Since DDCA has 1 to 3
drilling stages, the maximum number shall be three.
(4) Casing screen
The casing screen includes the following attributes. There are three data types i.e.
Specification on the casing, screen position and casing diameter/depth. The contents and the
maximum number of the each data are described as below.
1) Specification of casing
Casing Type: material of the casing such as PVC, steel or stainless steel
Casing Diameter: nominal diameter of the casing
Casing Length: the total length of the installed casing
These attributes are for the production casing and screen. Normally, one type of the
productive casing screen is installed from top to bottom. However, for the large
diameter well, sometimes telescopic-type structure is used which are composed of large
diameter pump housing and other smaller casing and screen. In this case, the number of
the data becomes two.
Accordingly, the maximum number of the data shall be two.
2) Screen position
Screen Positioned From: the top depth of each screen
Screen Positioned To: the bottom depth of each screen
Normally, the screen is divided into one part to five. The maximum numbers of the data
in the WDAC were seven. Therefore, the same numbers i.e. 7 is used for the WID.
3) Casing diameter/depth
Diameter From: the top depths of shallow part and deep part of production casing
Diameter To: the bottom depths of shallow part and deep part of production casing and
screen
These attributes are for the record of the depth of pump housing, in case that
telescopic-type production casing and screen are used.
The number of the data is one, for normal straight-type casing screen and two for
2
telescopic-type casing and screen.
Accordingly, the maximum number of the data shall be two.
(5) Drilling method
The drilling method includes the following attributes;
Method: To be selected from four types, i.e. mud rotary, air rotary, air percussion (DTH)
and cable tools
From: the depth of starting each method
To: the depth of ending each method
Normally, multiple drilling methods are used by DDCA for a borehole, depending on the type of
drilling equipment and/or geological condition.
Normally, as much as two methods are used
for a borehole while the all the four methods are used in some cases.
Accordingly, the maximum number of the data shall be four.
(6) Step pumping test
The step pumping test includes the following attributes;
Step pumping test yield: final yield of each step
Step pumping test pumping time: pumping time of each step
Step pumping test dynamic water level: final dynamic level of each step
Normally, the numbers of step are four to five for DDCA. In WDAF, the maximum numbers of
step was seven. Therefore, the same number, 7, shall be applied in this database.
4. DATABASE DESIGN
Based on the above analysis, ER Diagram was designed (Figure 2). This design is used to
construct data entry system for existing borehole reports. After completion of data entry, the
entered data will be exported to excel format. The main components of excel database are
borehole data, pumping test data and water quality data.
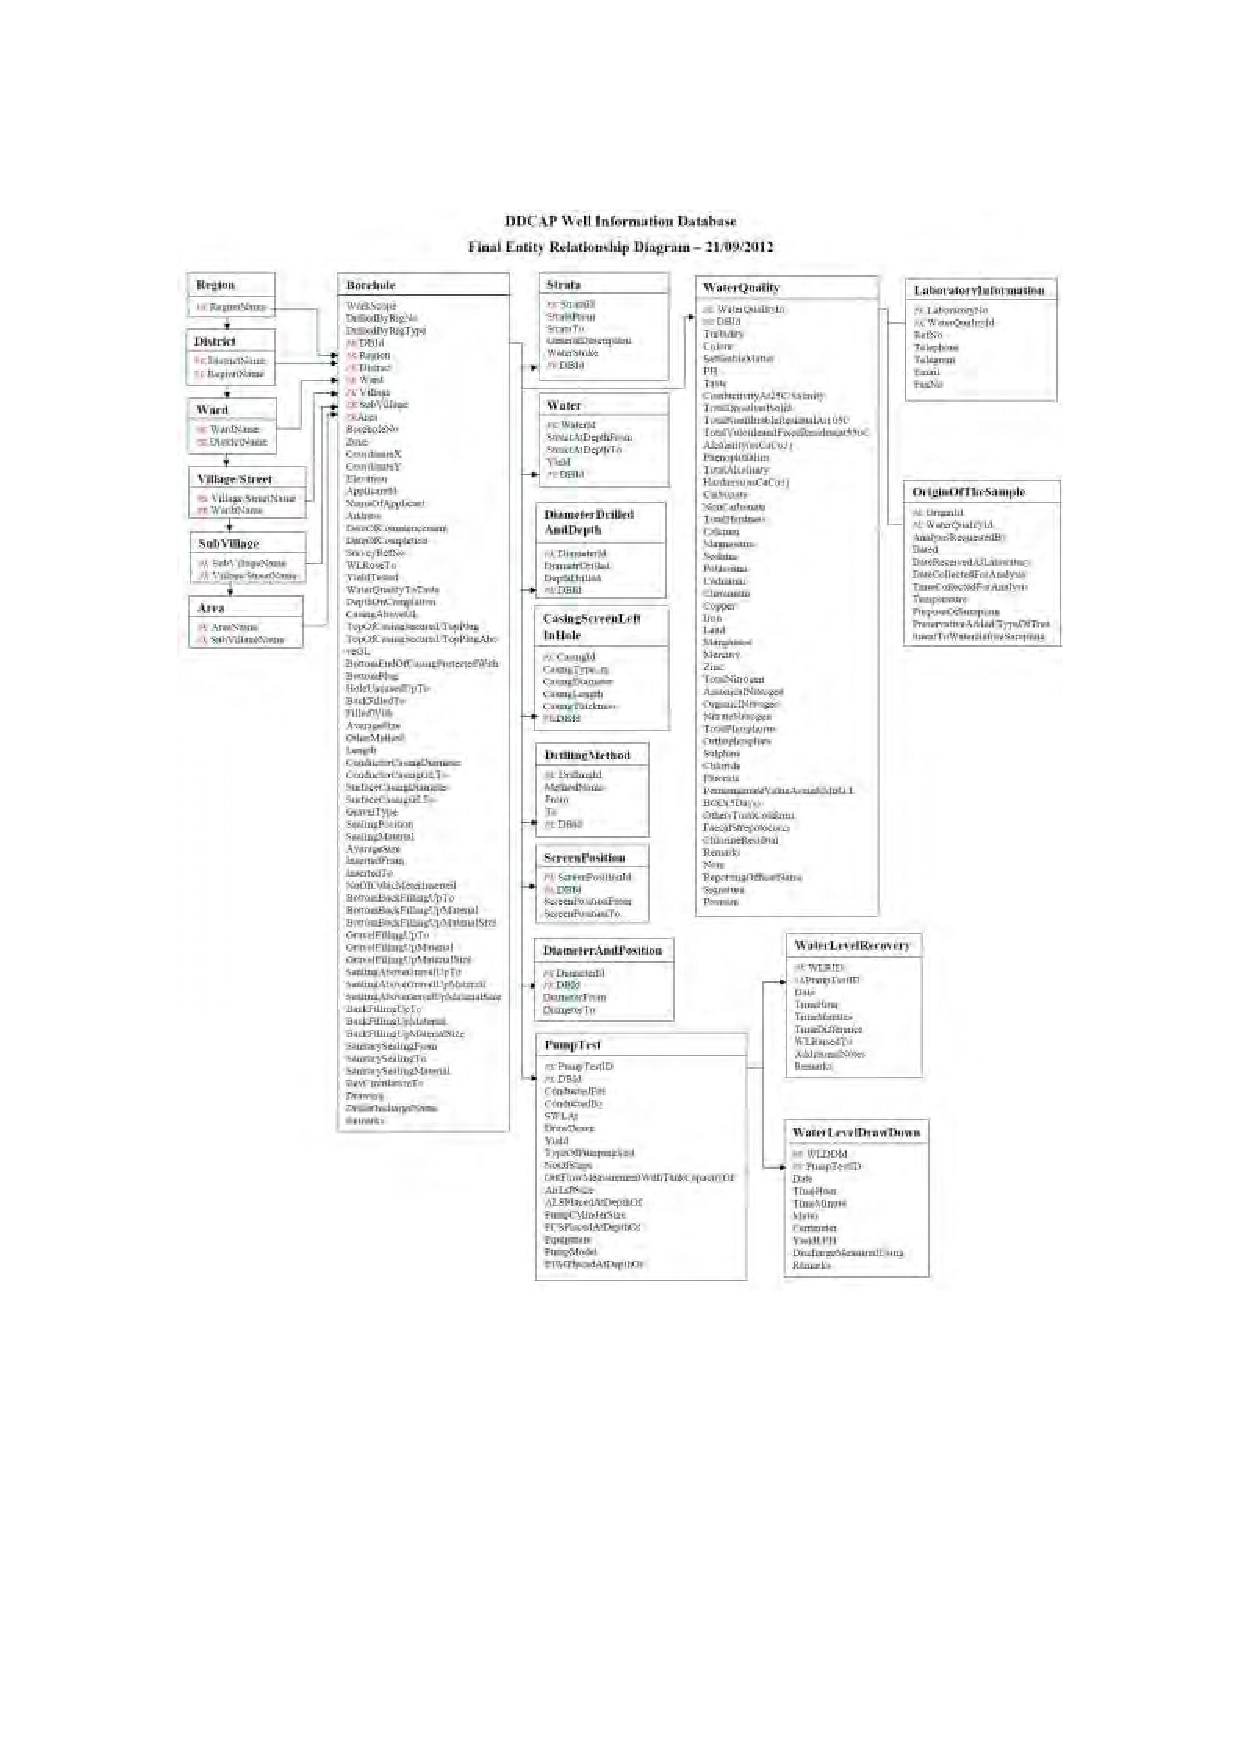
Output (5) System Analysis Completed
Figure 2: ER Diagram of database
4
5: DATA ENTRY AND DATABASE MAINTENANCE
ORGANIZATION
The WID will be updated by the new data entry from the drilling work record
form and pumping test record form which are filled by handwriting on site and
water quality analysis report which are prepared in the laboratory.
The rolls of concerned staffs with the preparation of the well completion report,
the update and maintenance of the WID are described below.
(1) Rig in charge
Each rig in charge of the drilling team fills in the drilling record form by
handwriting on drilling site and submits it to the Zonal Managers or DPOs.
(2) Zonal Managers and DPOs
The Zonal Managers or DPOs receive the drilling record form submitted from the
Rig in charge and forward it to the Head of Drilling Section of DDCA’s
Headquarters.
(3) Pumping test in charge
Pumping test in charge fills in the form by handwriting on site and submits it to
the Drilling Manager of DDC ’s headquarters.
(4) Hydrogeologist in Survey Section of the Technical Support Division in DDCA’s
headquarters
Hydrogeologist analyzes the drill cuttings on site or in DDC
’s headquarters and
prepares a casing programme. These results are supposed to inform the Rig in
charge.
He is responsible for the control of the survey reference numbers and informs
the Rig in charge of it.
He browses the WID for the purpose to check the record of strata and casing
program and to interpret the survey result.
(5) Water quality analysis laboratory
The water samples which are collected in the end of the pumping test will be
sent to the water quality analysis laboratory to conduct the analysis.
Output (5) System Analysis Completed
The water quality analysis laboratory will prepare the water quality analysis
report and submit it to the Head of Drilling Section.
(6) Head of Drilling Section of the DDCA’s Headquarters
The Head of Drilling Section examines the well completion report form
submitted from each staff in charge.
After the examination, he gives the instruction to the data entry clerk of the
registry room to finalize the drilling record form and pumping test record form by
data entry in WID and to finalize the well section drawing to the drawing room
by Auto-CAD.
He compiles the final version of the well completion report and submits it to the
CEO for his approval. After that, he submits it to the client.
He is responsible for the supervision of the entire process of preparation of the
well completion report, the update and the information retrieval from the WID
for providing data to the private drilling companies.
(7) Drawing room in the DDCA’s Headquarters
The well section drawings are prepared with Auto-CAD based on the handwritten
drilling work record form and well section drawing form after the examination of
the Head of Drilling Section.
(8) Registry Room in the DDCA’s Headquarters
After the examination by the Head of the Drilling Section, the handwritten
drilling work record form and the pumping test form are handed to the data
entry clerk of the registry room for finalization. The finalized forms are
submitted to the Head of Drilling Section.
(9) Computer room
The computer room is mainly in charge of the calculation related to the account
issues. This room is not directly related to the data entry to the WID.
However, the server computer is installed in this room and the staffs in this room
shall be of the network administrator.
(10) Data entry room
The data entry room is in charge of the management of the information related
to the contracts of drilling works such as contract prices, payment, clients and
6
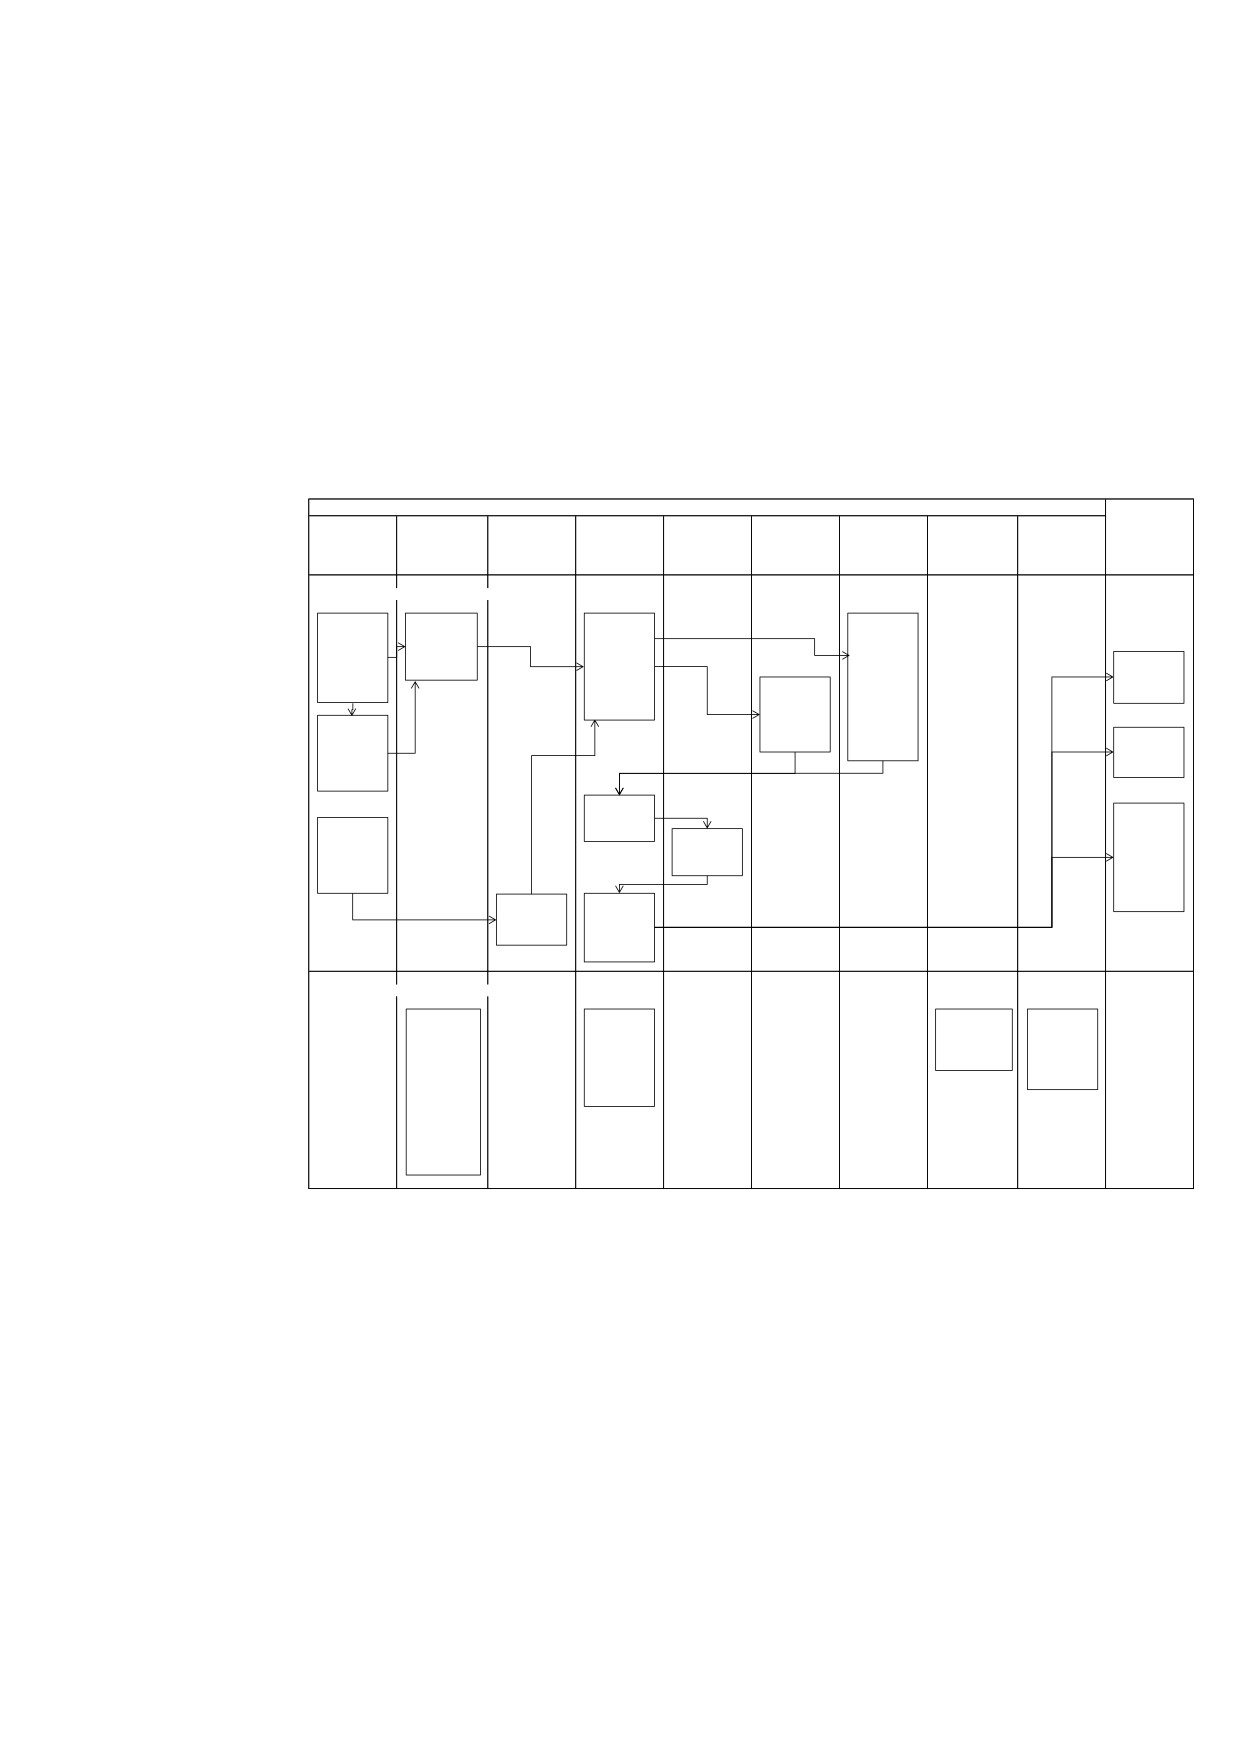
contract specifications.
Though this room is not directly related to the data entry to the WID, this room
browses the WID for the purpose of comparing the contents of the contract and
work results such as specifications, resulted amount etc.
The rolls of the concerned staffs described above and the flow of
well
completion report preparation are shown in Figure 3.
Concerned Parties related to Well Completion Report Making and Database Maintenance
Drilling and
HQ Survey
HQ Head of
Recipients of
Section
HQ Registry
HQ Computer
Pumping Test
Laboratory
Drilling
HQ CEO
HQ Drawing Room
HQ Data Entry
Reports
(Hydrogeologiss
Room
Room
Sites
Section
ts)
Report Making and Database Entry
Hand-writing
Li thological
Confi rmation
Entry to
report by ri g
log and
and
database and
in charge
pumpingtest
instruction to
finalization of
interpretation
data entry
well
To Client
and
compl etion
finalization
form and
Finalization of
Well
pumping test
Structure
form
Submitted to
Section by
DPO or Zona l
AutoCAD
To Basin
Ma na ger
Water Office
Final
confi rmation
Stori ng copies
Hand-writing
a t Centra l
report by
Approval and
Zone Office of
pumping test
Signature
DDCA and
technician
WRD of MoW
in Dodoma
Water Quality
Submissionto
Analysis
Cl i ent a nd
rel a ted
orga nizations
Reading and Maintenance of Database
Reading of
Ma i ntenance
Network
Reading
Database for
of database
Administration
database for
checki ng
and
checki ng
oflithology and
information
contra ct
database and
retri eval from
condi tions
for reference
database
for the
geophysical
survey
interpretation
Figure 3: Roles of Concerned Staffs and Flow of Well Completion Report Preparation
Among the staffs in charge shown in the above, the staffs directly related to the
update and maintenance of the WID are the Head of Drilling Sectionand the
staffs in the registry room. The Head of Drilling Section is responsible for
supervision of the data entry, maintenance and data analysis while the staffs in
the registry room are responsible for the data entry of the hand written well
completion report.
Output (5) System Analysis Completed
The Drilling Manager has an experience of making a simple borehole inventory
with MS-Excel. Even so he is required to improve the necessary skills for
database maintenance and data analysis such as making tables, creating
formulas and using the aggregate function.
The staffs in the registry room have simple skills to input values in forms in
MS-Word since they have experiences of the data entry of well completion
report to forms in MS-Word. However, they do not have any knowledge and
skills of MS-Excel. Therefore, they need to acquire the skills of MS-Excel for the
data entry in WID.
The technical support from the Contractor and JICA Expert Team in order for
DDC ’s staff to acquire the above skills is described in Section 3.
6: COMPUTER NETWORKING SYSTEM
Three computers will be procured by the Project for the construction of WID.
One computer is used as a server computer while two are used as the client
computers. Each computer is connected by wireless LAN. Total 3 sets of
computers are procured in this project. The specifications of those computers
are almost same. One computer is for server and the others are for clients.
The location to be installed and the usage of each computer are described below.
(1) Server computer
Server computer is installed into the computer room. The staffs in this room
shall be the network administrator. The WID itself is saved in this server. The
backup is done periodically for both server and client computers.
(2) Client computer
One Client computer is installed in the registry room. Update, maintenance
and information retrieval are done in this computer. The staffs in the registry
and the Head of Drilling Section use this computer.
Another Client computer is installed in the Survey Section of Technical Support
Department. Hydrogeologists mainly use it for checking the record of strata
and casing program, and for interpreting the survey result.
DDCA is planning to procure one client computer for browsing the WID to
8