Technical Manual for Drilling Works for Technical Support Plan for the Drillers in DDCA (2013) - page 2
DDCAP Technical Manual for Drilling Works
For Technical Support Plan for the Drillers in DDCA
3.5 BIT CONTROL AND REPARING FOR MUD DRILLING (TA CODE 4-5)
Rotary bits shall be correctly controlled and the proper repair and/or replacement is required. The
excessive use of bits over their lifetime brings about the following problems:
-
Under gauge of the hole which causes the wearing of bit and/or tool stucking.
-
By the wearing of bearings of roller bits, cones falls into the hole.
-
Buttons or pieces of tooth fall into the hole.
For the drag bits, periodical repairing on their blades and gauges by welding is needed.
Drillers are required to conduct proper bit record and repairing/replacement using the log sheet as
shown in Table 31 .
Table 31 Example of Bit Log Sheet
BIT LOG SHEET
Type:
Bit Size:
Part No.:
Bit No.:
Date of Issue:
To Rig No.:
Date of Return:
From Rig No.
Date
Metrage
Times
Diameter or
Type of Formation
Remark Service Record.
Drilled
Sharpened
gauge after
Penetrated
w/Bit
re-sharpened
48
DDCAP Technical Manual for Drilling Works
For Technical Support Plan for the Drillers in DDCA
3.6 AIR CONTROL FOR DTH DRILLING (TA CODE 4-6)
It can be observed that drilling with Megadrills and Megabits do by far not reach the performance
recommended by the manufacturer of the tools. Low penetration rate may result from problem of
different nature of operation of Megadrills and bits such as:
Air supply is not according to requirement resulting in not adequate air pressure in the
Megadrill or air volume is not less than 1,200 m per minute or air pressure required for A
53-15 Megadrill not less than 9.0 to 10.3 bar.
The drill bit is not sharpened properly
The Megadrill is worn-out, clearance of piston and piston case sealing O- rings worn-out etc.
Bits are very dully because of overrunning
The necessary bit weight is not on the bit or there is too much load on the bit (for A 53-15
Megadrills 680 kg minimum weight and 1,600 kg maximum weight (is recommended).
Rotation of bit is not according to the geological formation and to the expected penetration
rate per revolution. Ideally the bit should penetrate 3/8"into the formation of the drill pipe.
Generally acceptable revolution per minute are considered with 15rpm to 30rpm
No use of water injection will create problems of “collaring” or bridging caused by scopage
of small amounts of formation water into the hole. To be avoided by injecting 2 to 5 CPM of
water into the air stream.
The “back pressure” created by considerable formation water influx may reduce extremely
the penetration rate. To overcome this problem form has to be used in quantities.
Drillers are required to understand the mechanism and function of the air-compressor and the DTH
using the operation manual of the manufacturers. They have to consider the static water pressure,
back-pressure, annular velocity necessary to remove the cuttings from the borehole and conduct
proper operation of the air-compressor.
49
DDCAP Technical Manual for Drilling Works
For Technical Support Plan for the Drillers in DDCA
3.7 AIR COMPRESSOR OPERATION (TA CODE 4-7)
The specifications and structure of the air-compressor are described in Technical Item 2-4. The
air-compressor is the major and important equipment for the DTH drilling. Therefore, the drillers
are required to acquire the knowledge of the functions, maintenance and operation of the
air-compressor. Please refer to other section of this manual related to the DTH drilling, for further
comprehension of the operation of the air-compressor.
50
DDCAP Technical Manual for Drilling Works
For Technical Support Plan for the Drillers in DDCA
3.8 CASING FOR DTH DRILLING
(TA CODE 4-8)
The boreholes in hard rock formation are
normally drilled by DTH drilling methods in
three stages, i.e. surface hole drilling,
conductor hole drilling and production hole
drilling. In general the shallow part in hard
rock
formation
is
unconsolidated
overburden and is collapsible during air
drilling. Therefore, down to
5 to 30 m,
sometimes even to 60 m, this overburden
shall be drilled by the mud drilling and the
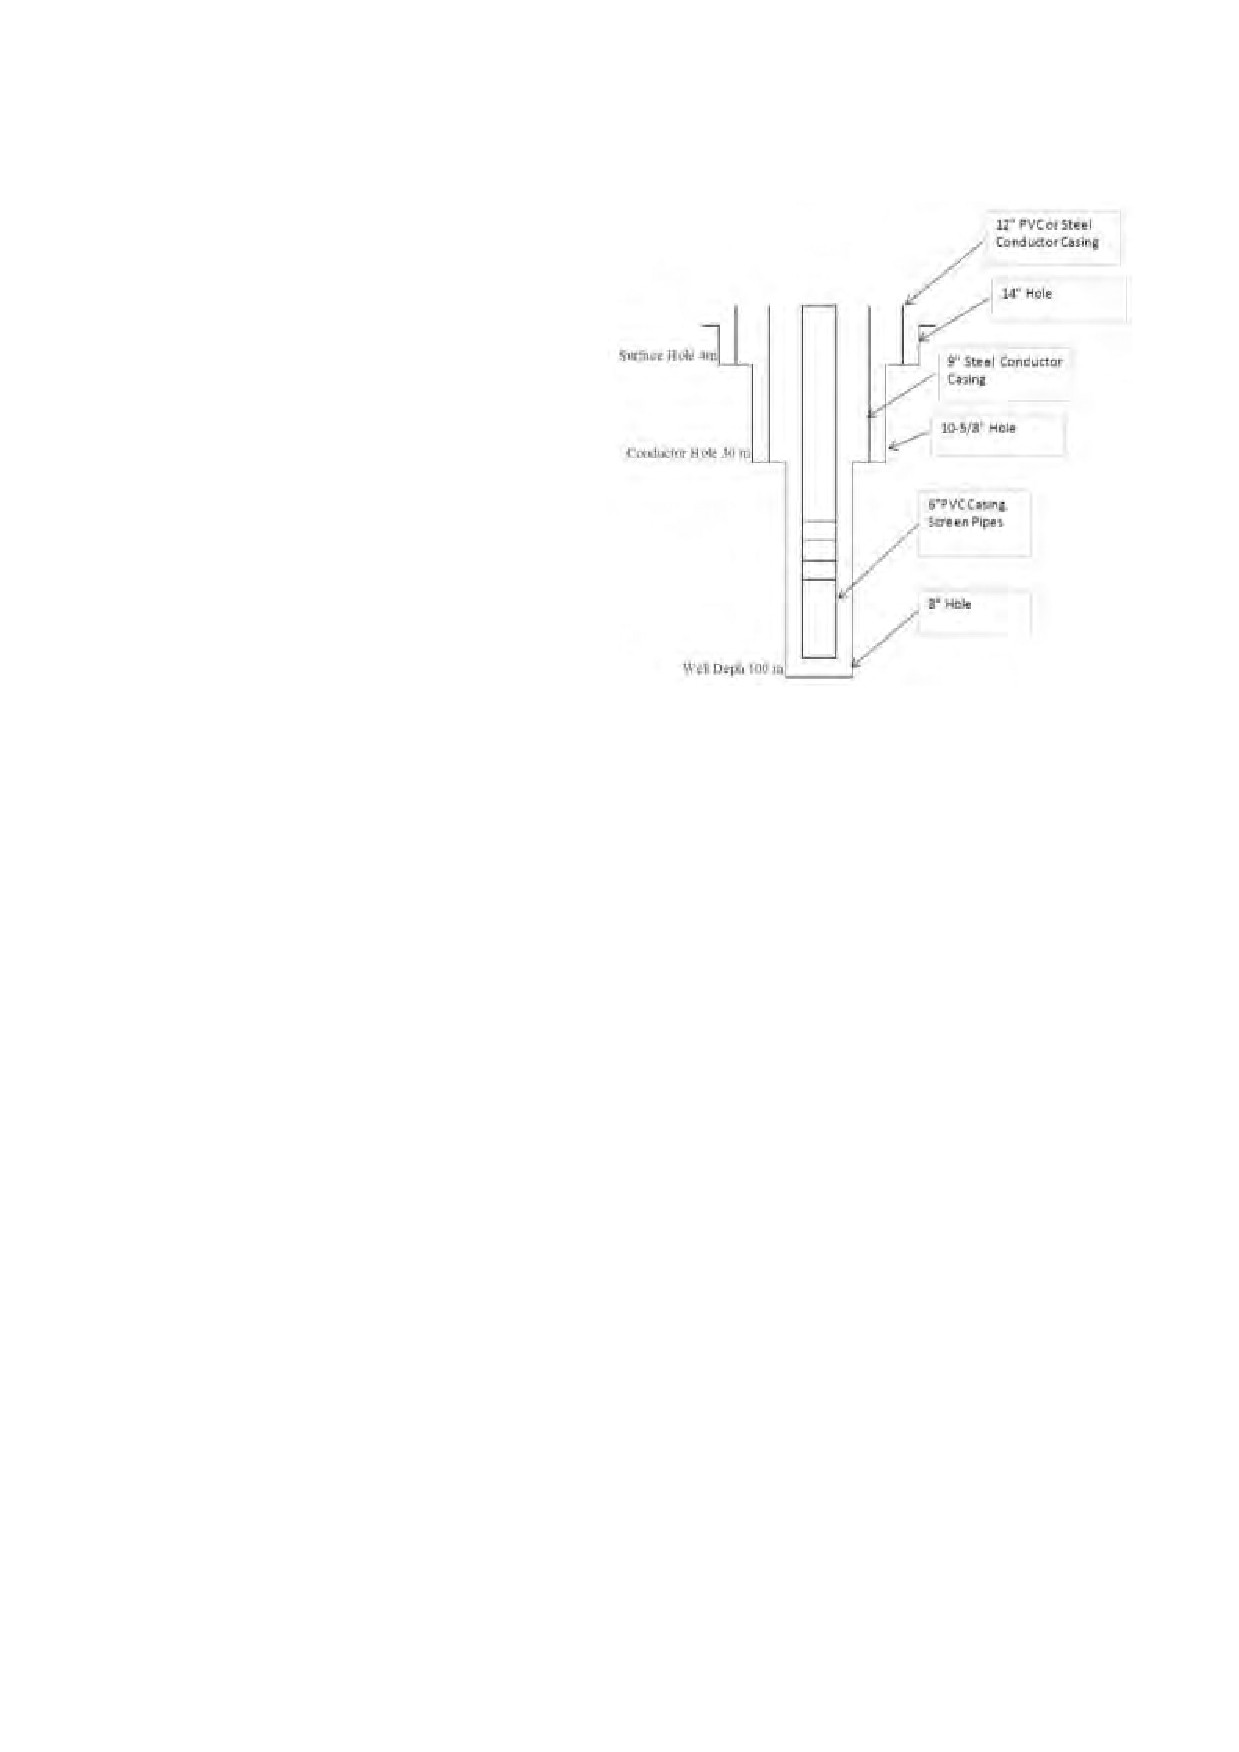
conductor casing shall be installed. Figure
23 show an example of the casing program
for DTH drilling borehole.
The surface casing is required when:
Surface water must be sealed off
Unstable formations interfere with
drilling, or
Figure 23 Example of the
Artesian flows are possible. in this case the
Casing Program for DTH Drilling
surface casing must be cemented
Borehole
The purpose of surface casing is to isolate
freshwater zones so that they are not contaminated during drilling and completion. The surface
casing is also necessary for the smooth work around the borehole during the drilling.
PVC casing and screen pipes are used for most of the boreholes in Tanzania. Please refer
Technical Item 6-1 for the specifications of PVC casing and screens and Technical Item 6-3 for the
installation procedures.
The conductor casings are in general of steel and with flush joint. In many cases they are
temporary and are to be removed after the completion of the drilling work. The preparation of the
conductor casing with sufficient number on site is quite important to obtain the smooth progress of
the drilling works by DTH. Please refer to Technical Item 2-5 for the specifications of steel
casing pipes.
51
DDCAP Technical Manual for Drilling Works
For Technical Support Plan for the Drillers in DDCA
3.9 DRILLING OPERATION FOR DTH DRILLING (TA CODE 4-9)
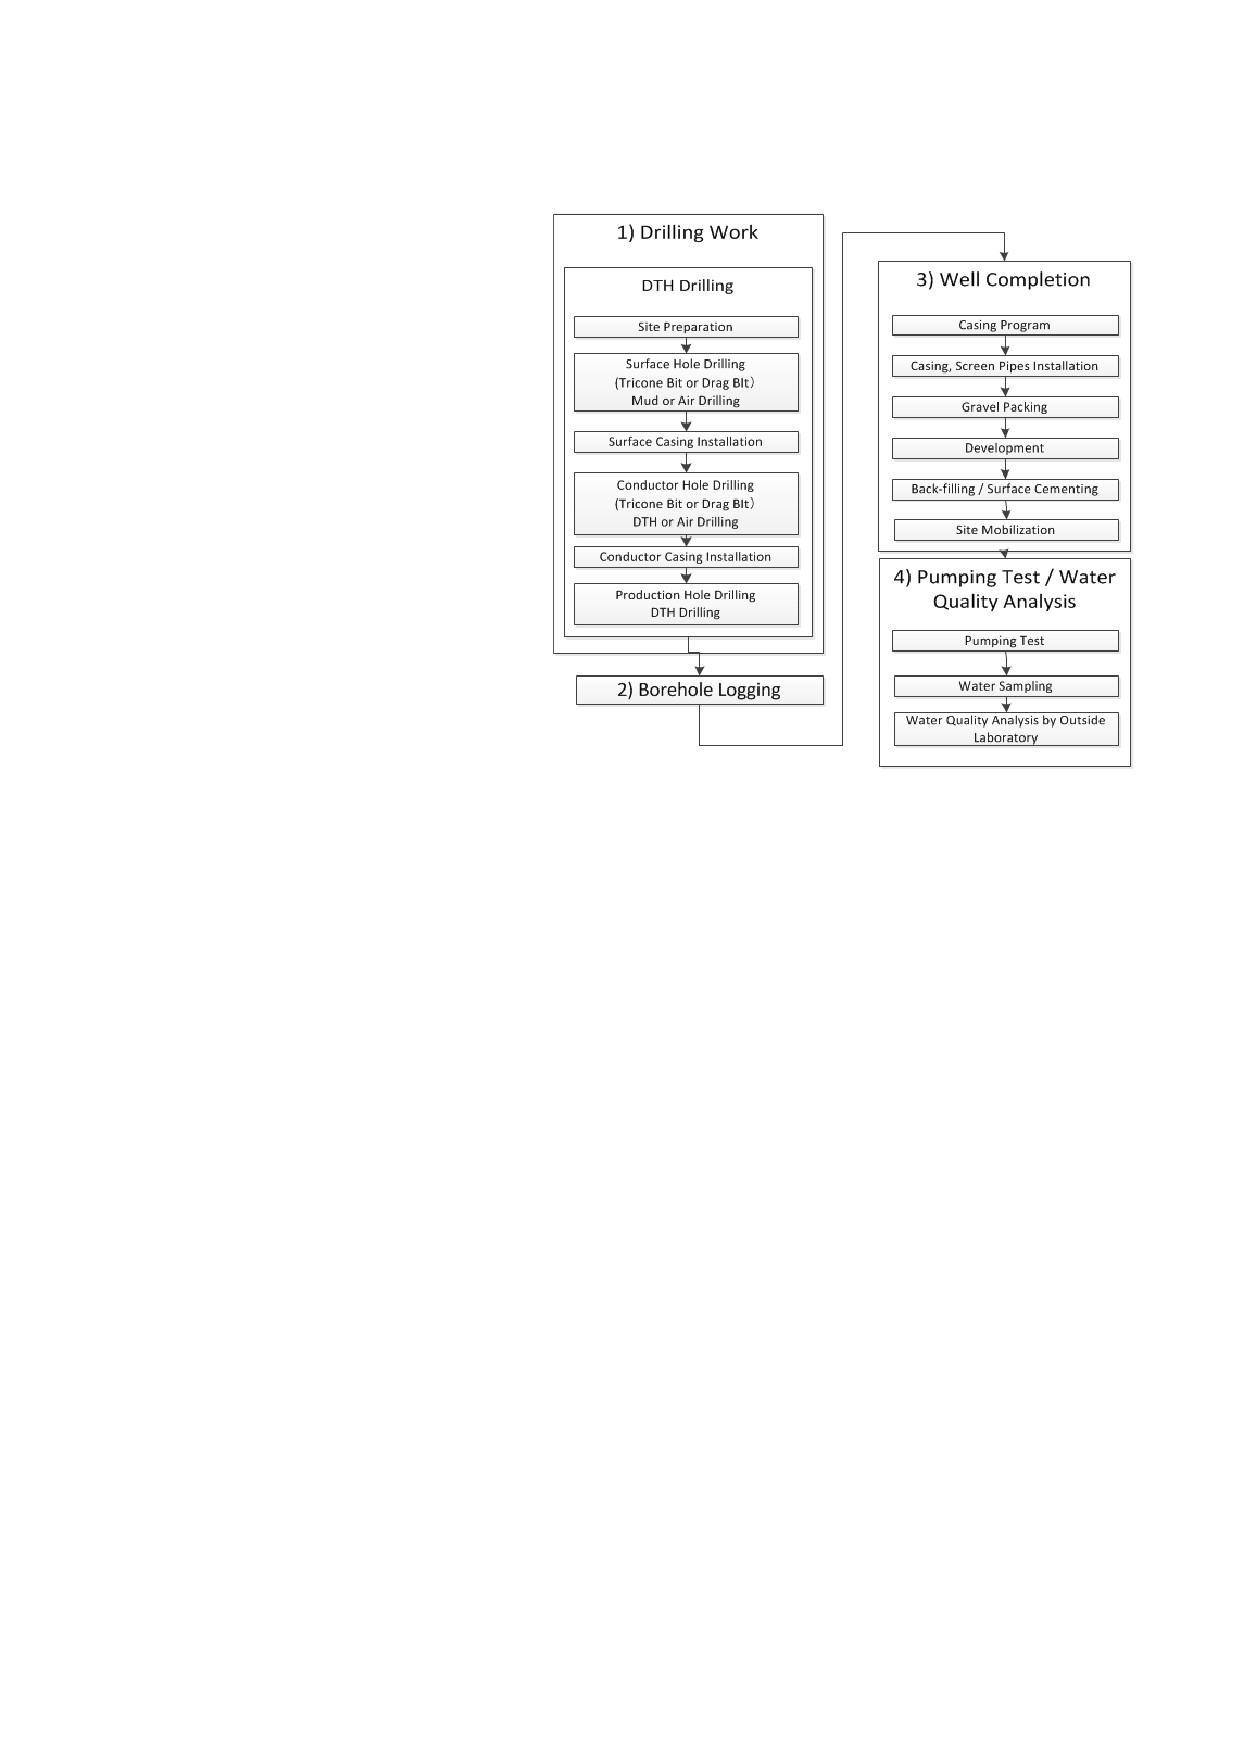
Figure 24 shows the process of the
drilling works by mud drilling method.
It includes many processes and drillers
are required to acquire lots of
knowledge
and
techniques.
Technical Item 1 to 15 covers all the
process and drillers can refer to each
material to conduct the works.
DDCA has the report forms for the
record of the drilling works. Drillers
shall keep proper records of their
works using these forms.
These
forms are commonly used between
mud drilling wells and DTH drilling
wells. Please refer to Technical Item
4-4 for the examples of well
completion forms.
Figure 24 Work Flow of DTH Drilling
52

DDCAP Technical Manual for Drilling Works
For Technical Support Plan for the Drillers in DDCA
3.10 BIT CONTROL AND REPARING FOR DTH DRILLING (TA CODE 4-10)
DTH bits shall be correctly controlled and the proper repair and/or replacement is required. The
excessive use of bits over their lifetime brings about the following problems:
-
Under gauge of the hole which causes the wearing of bit and/or tool stucking.
-
Buttons or pieces of tooth fall into the hole.
-
Progress of drilling decreases when the buttons of bits are worn.
Periodical sharpening shall be conducted to keep the good drilling progress. Please refer to
Technical Item 2-3 for the repairing of DTH Bit.
Together with Bit Log Sheet (Technical Item 3-5), DTH tool shall be controlled using the DTH log
sheet as shown in
Table 32 Example of DTH Log Sheet
DTH LOG SHEET
Model:
No. of Tool
Date of Issue:
To Rig No.:
Date of Return:
From Rig No.:
Date
Hours
Metrage
Type of Formation
Remarks, Cleaning Servicing Tool
tool/Run
Drilled
Penetrated
53
DDCAP Technical Manual for Drilling Works
For Technical Support Plan for the Drillers in DDCA
4 BOREHOLE LOGGING (TA CODE 5)
4.1 BOEREHOLE LOGGING INSTRUMENTS (TA CODE 5-1)
4.1.1 GENERAL INFORMATION ABOUT BOREHOLE LOGGING
Many of the geophysical survey methods for groundwater exploration, which are carried out on the
ground-surface, can also be used within a borehole in vertical direction.
Resistivity well logs - RES
Resistivity logging, usually called electric logging, provide a useful tool, and the information
gained increases in general the effectiveness of the well design. A good log gives a detailed
picture of the character and thickness of the various formations at the well site and an indication
of the water quality by measuring the apparent resitivity of the subsurface material
cross-sectioned in the borehole. Electric logging offers several important advantages, such as
locating the top and bottom of each distinct layer, determining relative water quality, and
differentiating fresh hard rock layers from fractured and weathered parts. A limiting factor in
electric logging is that the method can only be done in boreholes that do not have casings and are
filled with drilling fluid or water. The method is therefore best to be carried out in rotary mud
circulation boreholes.
Please note that in low-yield boreholes in hard rock formation, it is advised to carry out borehole
logging the other morning after drilling was completed to allow the water level to rise for one
night due to low recharge conditions.
Spontaneous Potential (SP) Logs
Self-potential or spontaneous potential logs are always run in conjunction with the electric logs.
Spontaneous potentials are naturally occurring electrical potentials (voltages) that result from
chemical and physical changes at the contact between different types of formation material. In
a borehole, potentials also occur between the drilling fluid in the borehole and the fluid in the
formation and also between the drilling fluid and the filter cake on the borehole wall.
As in the case of drilling DTH in Swaziland, where fluid in the borehole is the same groundwater
as in the formation, there cannot be a difference in the potential of both waters (fluids). In
general SP logs make only sense in boreholes filled with drilling fluid (drilling mud).
To measure SP at various depths, an electrode is lowered into an uncased borehole filled with
drilling fluid as one electrical terminal. The terminal of the arrangement is connected as a
ground terminal at the surface, which is often placed in the mud pit. The down-hole electrode
is usually negative with respect to the surface electrode. Any current in the circuit, which
results from electrochemical action between the drilling fluid and the formation or formation
water, is conducted to the surface through the drilling fluid column. The milli-voltmeter
connected between the electrodes, therefore, measures the drop (difference) in potential in the
drilling fluid column between the down-hole electrode and the surface electrode.
As the down-hole electrode is moved up and down in the borehole, the meter registers variations
in spontaneous potentials of the different formations. A curve showing these potentials plotted
against borehole depth provides what is called the SP log. Although the SP log may indicate
the permeable zones, there is no definite relationship between the magnitude of the SP
deflection and the permeability and porosity of the formation. Variations shown by the SP
curve are interpreted along with variations in apparent resistivity shown by the resistivity curve.
The two curves together constitute what is usually called the electric log.
The SP log is plotted on the left-hand of the curve sheet, where it can be compared easily with
the resistivity log on the right-hand side.
Natural Gamma Ray (GR) logs
In gamma logging, measurements are made of naturally occurring radiation coming from the
materials encountered in the borehole. The record of gamma radiation is used as a qualitative
guide for correlation of formations and permeability of formations.
54
DDCAP Technical Manual for Drilling Works
For Technical Support Plan for the Drillers in DDCA
Gamma radiation is emitted from certain elements in geologic materials that are unstable and decay
spontaneously into other more stable elements. Gamma rays are similar to X-rays in that having a
great ability to penetrate other materials (for example even steel casings), but gamma rays have a
shorter wave length.
Certain radioactive elements occur naturally in igneous rocks (granites, gabbros) and metamorphic
rocks (slate, mica-schist, gneiss) and as depositional particles in sedimentary rocks. Clays and
shale contain high concentration of radioactive isotopes, usually potassium. Sands and gravel on
the other hand contain primarily silica, a stable substance, and therefore emit only very low levels
of radiation.
So gamma ray curves of silica rich, light colored, acidic rocks, such as granites, gneiss and
sandstones are showing deflections in the curve to the left.
Gamma ray logging has a fundamental advantage over electrical logging. It can be done either in
cased wells or in open boreholes containing air, water, or drilling fluid. Therefore with gamma
ray it is possible logging existing wells, where logs have been lost or were not carried out. The
gamma probe is very simple, having a detecting element, which is measuring the pulses given off
by the radioactive materials in the different formations. The radiation extensity is expressed as
the average number of counts per second (cps).
The minerals normally found in sedimentary materials such as clay, silt, sand, or sandstones
contain small amounts of radioactive potassium-40, and decay products of uranium and thorium.
Potassium is an important constituent of clay minerals, mica, feldspar, and shale. Quartz sand
contains no potassium or radioactive potassium-40. Quartz sand formations emit gamma-rays at
extremely low levels. Normally the gamma logs show more cps at depths, corresponding to clay
or shale layers and few cps at depths corresponding to sand or sandstone layers, if the sand is
mostly consisting from quartz.
4.1.2 OPERATION OF BOREHOLE LOGGING
Components of the equipment of the Geologger 3030:
Power winch 3895
Geologger 3030 machine
Combination Probe (GR, SP, RES)
Sheave, sheave stand and supporting legs
2 Batteries 12 V
2 Surface electrodes
Power supply cords
Cable for Geologger 3030 to power winch
Cable for Geologger 3030 to sheave
Connection of the equipment:
1. Join up the components of the probe (GR + SP/RES) then seal the joint with insulation
tape
2. Connect slowly the winch connector to the probe turning slowly until there is a click
sound, and then lock the link
3. Connect the battery to the power winch
4. Sheave stand is then put over the borehole and sometimes there might be a need for the
sheave’s stand additional / support legs in case, when the temporary casing is more than
30 cm above the ground
5. Then wind the cable from the winch, while the probe lies on the ground, to the sheave
wheel and the direction of the wheel will be decided by the winding of the cable. The
55
DDCAP Technical Manual for Drilling Works
For Technical Support Plan for the Drillers in DDCA
winding of the cable should be in a cross manner and sometimes, just wind it straight.
Then use the lock to prevent any slippage. Lock the probe cable with the lock knob
from the wheel to avoid any slippage of the cable from the wheel and getting damaged
6. Connect the cables from power winch and sheave to connector panel of Geologger
7. Connect the earth electrodes to the connector panel and then to the ground with the
B-near (black) the borehole- and the N-30m (red) maximum away from the borehole and
they should be connected to wet ground.
8. After all the connection from the connector panel has been completed and the setting of
the sheave then the probe is put inside the borehole. Then connect the cable from the
Geologger to another battery.
Operation of the equipment:
Set the probe into the borehole and knowing the casing top above ground level, you will know
exactly the top of the spring of the probe would set level with ground level.
Set the power switch “ON” and the menu will be displayed at the LCD display. As the menu
items are displayed, they will respond to function keys shown to the left of the menu, F1 to F4.
First step
For the display and the setting of date and time, observe the following procedures:
Choose date and time by pressing F1
Setting the date by pressing the key (*) star. This enables you to set the date, “YY MM
DD”, by putting in the figures from the keyboard.
Set the time by pressing the hash key (#). This enables you to set the time, “ HH MM SS”,
by putting in the figures from the keyboard. Then enter.
Second step:
Choose system by pressing F4
System check by pressing F1
This enables the machine to check that everything is functioning well and if it is in order. It will
let you know in case, which part of the system is not ok.
Note: If there is an error, for example with the floppy disk drive, it will tell you where the error is,
and all you have to do, is to check, if the floppy disk is inside and then slightly press or move it
sideways. Then cancel and restart system check.
Third step:
Choose measure by pressing F3
Measure by pressing F1
Depth input will appear, and then change depth to zero and then press enter. Sign change due to
the direction of probe movement from sheave by pressing F1, if necessary - then press enter.
Then set the gamma range, which is normally 0. 2K cps by pressing F3 - then press enter
The ampere range is automatically set.
Input sampling interval is normally every 10 cm, but can be change to other measuring
interval.
On the display will appear >>Reset data & start. Just press enter.
After measuring press the enter key.
Enter ID No. of the borehole. Then enter.
56
DDCAP Technical Manual for Drilling Works
For Technical Support Plan for the Drillers in DDCA
Print out click play back on F2
Input of ID No. This helps to know the file, in which the recorded data are stored on the
floppy disk. This is entered with three figures e. g. M2-10-2, ID No. is 001 when
measuring down and 002 when measuring up. With more reference to the recorded data,
there is a sheet that needs to be filled for ID No. and borehole No.
Depth scale selection is normally 1/500, but select by pressing F4.
Selection of gamma scale can be selected from the keyboard from 1 to 9.
Selection of resistivity scale can be selected from the keyboard from 1 to 9.
Selection of Spontaneous Potential (SP) scale can be selected from keyboard from 1 to 5.
Please note for the scale selection of the different methods, it is important to observe constantly the
measuring keyboard, while driving the probe down. Then you know the scale in which the
measured values, ohmmeter for RES, mV for SP and cps for GR, are lying and subsequently you
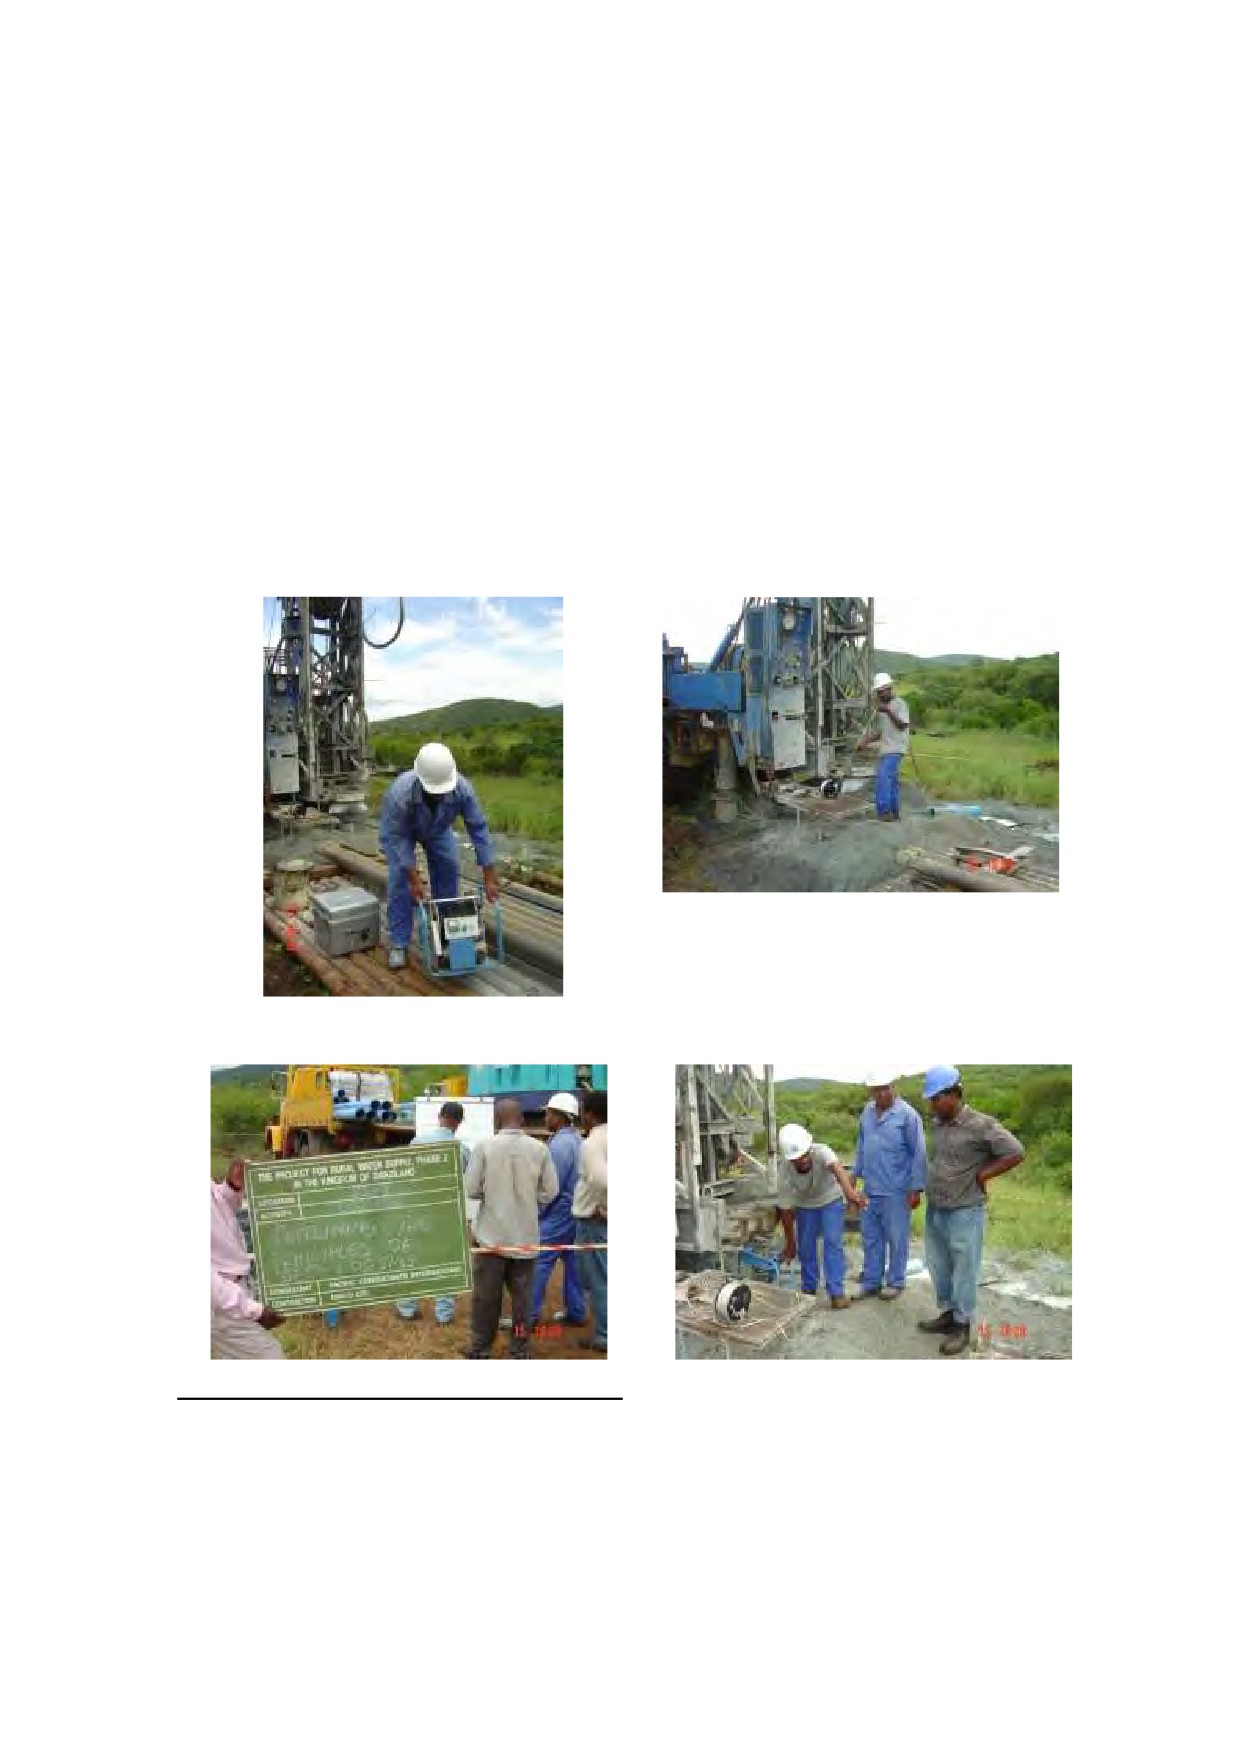
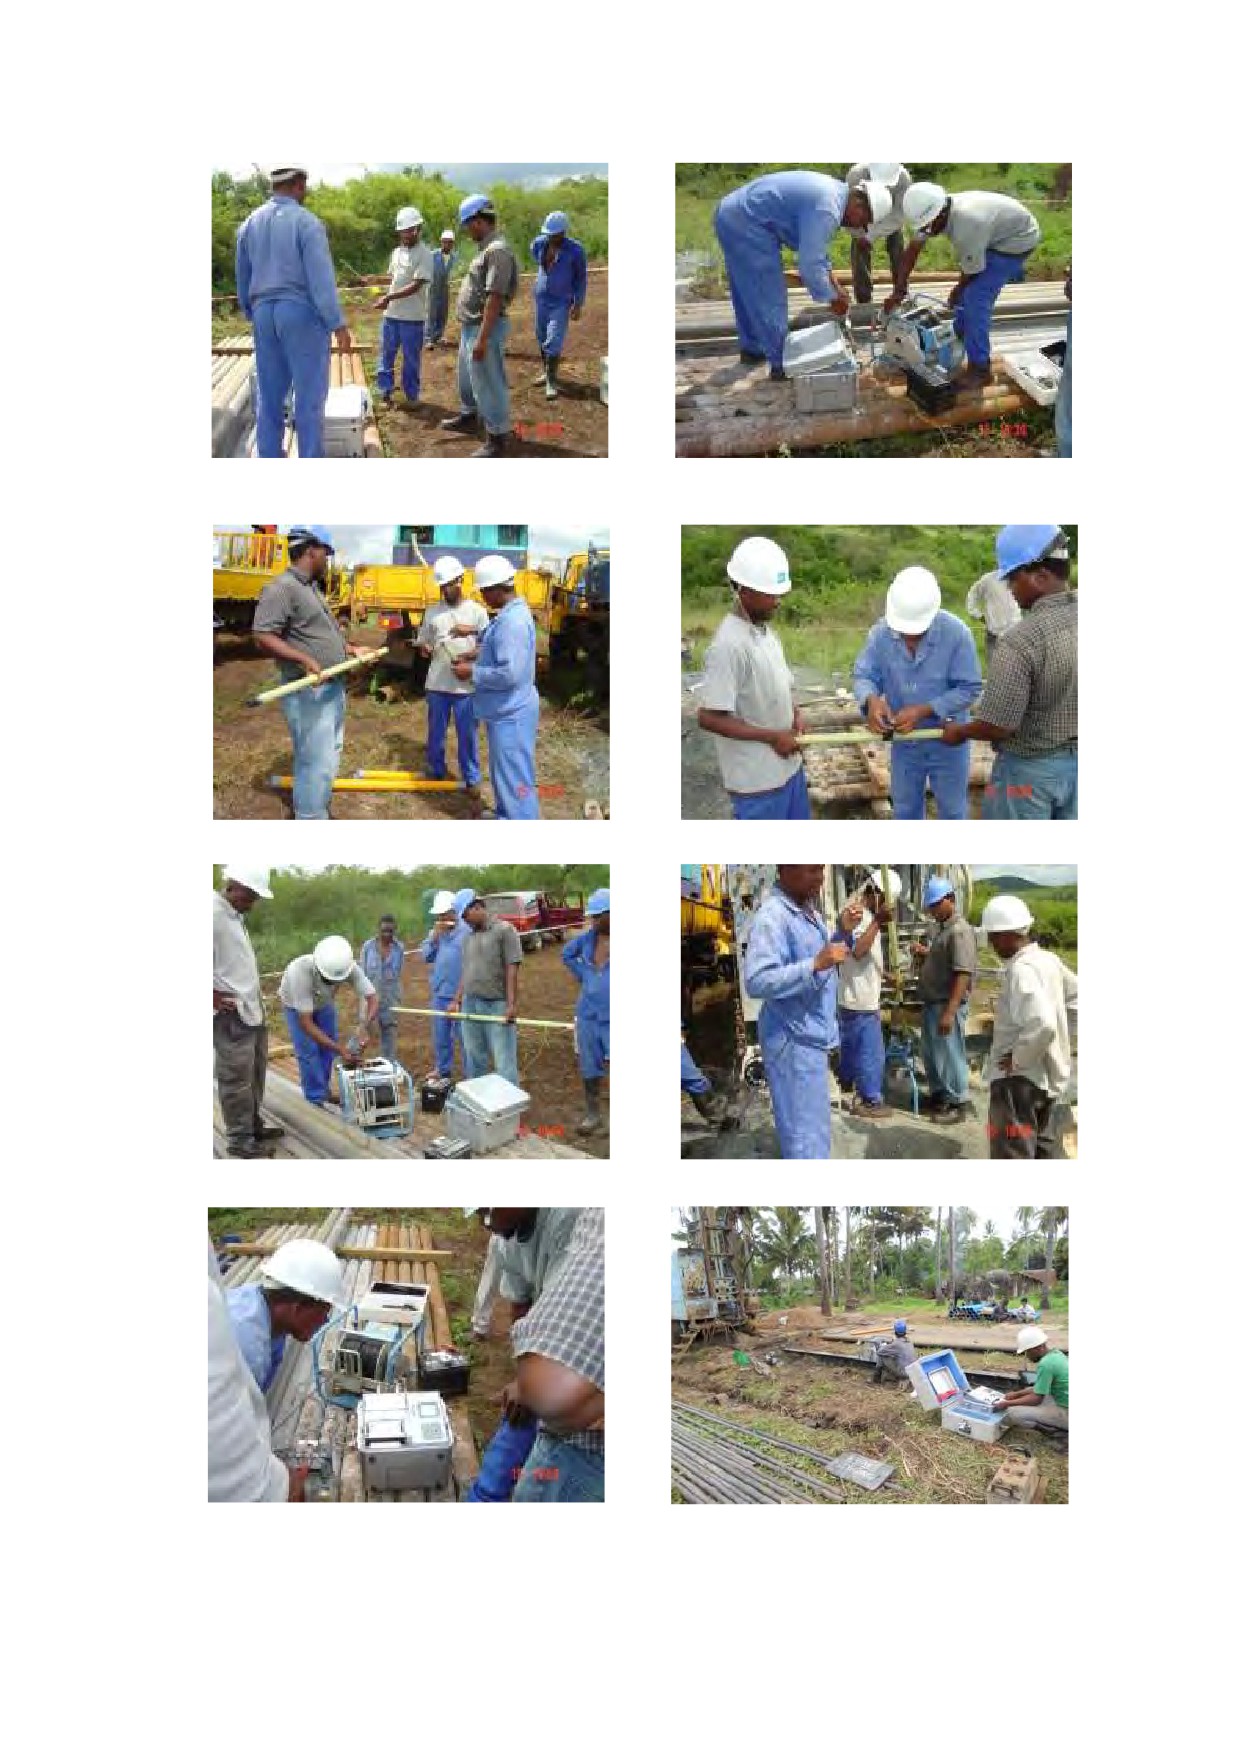
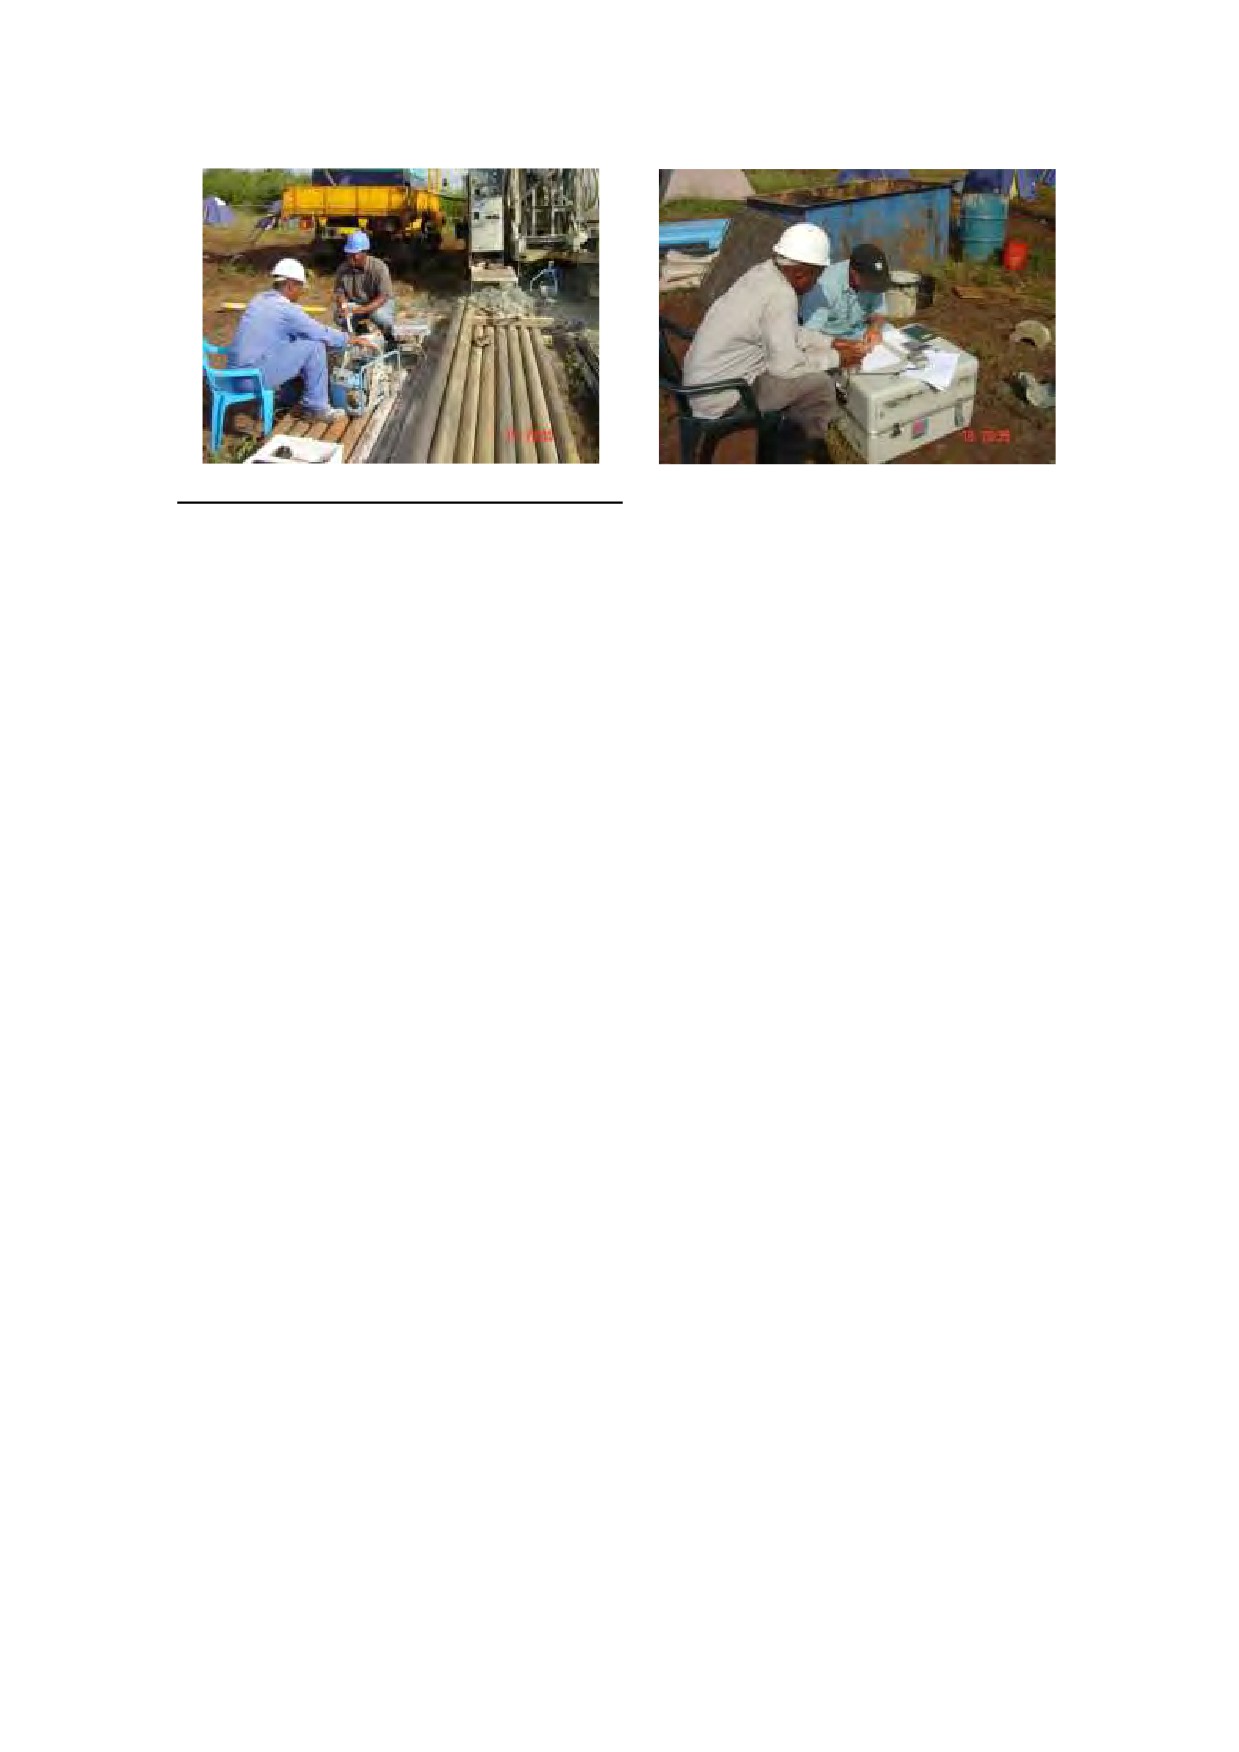
choose the appropriate scale for the print out process. The pictures of Figure 25 shows the above
procedures.
2. Preparation of the Loging Equipment
1.Measuring of the water level before
Logging
3.
Outlining the principles of the
4. Explaining the installation of sheave stand
borehole-logging methods
on top of the borehole
57
DDCAP Technical Manual for Drilling Works
For Technical Support Plan for the Drillers in DDCA
5. Arrangement of the logging equipment
6. Explanation of how to connect the cables
to the equipment
7. Explaining the probes
8. How to insulate the probes
9. Connecting the probe to the winch
10. Inserting the probe into borehole
11. Explaining operation and
12. Carrying out the borehole logging
measurementwith Geologger
58
DDCAP Technical Manual for Drilling Works
For Technical Support Plan for the Drillers in DDCA
13.
Trainee personnel running the
14. Explanation of logging interpretation and
borehole-logging
casing plan
Source: JICA’s Water Supply Project in Swaziland
Figure 25 Work Procedure of Borehole Logging (Geologer 3030)
59
DDCAP Technical Manual for Drilling Works
For Technical Support Plan for the Drillers in DDCA
4.2 INTERPRETATION OF BOREHOLE LOGGING RESULTS (TA CODE 5-2)
4.2.1 INTERPRETATION OF BOREHOLE LOGGING RESULTS
Interpretation of electric logs
The electric log cannot be used to qualitatively identify the material encountered in the borehole,
because the measured resitivity is a function of various different parameters, such as composition
of the drilling mud or the fluid in the borehole, fluids in the formation, diameter of the borehole
and the distance of the electrodes within the measuring probe. Depth related rock samples
recovered during the drilling (drilling cuttings) are required for positive identification of specific
geological formations. Dry formations are poor electrical conductors and show very high
resistivities as well as fresh and dense igneous, metamorphic and volcanic rocks, such as
granites, granodiorites, amphibolites, gneiss, dolerites, basalts and ryolites. Saturation of a
formation reduces its resistivity. The reduction again is partly controlled by the porosity of the
formation.
The type of material is only factor, which is influencing the resistivity. Water in the pore space
is always mineralized differently due to the material of the formation and it’s chemical
composition. So various different factors are influencing the resistivity and experience is an
important factor in the interpretation of electric logs. Knowledge of the general trends and the
spectrum described above are also very important. In the hard rock formation of Swaziland
high resistivities are usually indicating dense and dry hard rock types, whereas curves changing
to lower resistivity values are indicating fractures and fissures and weathered formations, which
can be filled with groundwater.
Interpretation of SP logs
Interpreting SP logs is generally very difficult and it makes only sense to analyze logs which
were carried out in an uncased borehole filled with drilling fluid and in a borehole having
distinctive clay layers to provide a so called baseline (clay line). Please note here that SP logs
published from oil-field works are completely different from SP logs run in water-wells. It is
important to understand the differences between oil-well and water-well SP curves. In general
groundwater associated with oil is salt water. The electrical conductivity of this water is
extremely high in comparison with the conductivity of the water in the drilling fluid.
Groundwater suitable for drinking water purposes has low dissolved solids, on the other hand,
and therefore has a much lower conductivity than oil-field brine. Its electrical conductivity
may be about the same as, or even less than, the conductivity of water in the drilling fluid.
Thus, the electrochemical reaction between the formation water and the drilling fluid is quite
different, depending on whether the formation water is considerably more salty than the drilling
fluid (oil-field condition), or whether the formation water has about the same salinity as the
drilling fluid (water-well condition). When a permeable formation (aquifer) contains salt water
and the drilling fluid is made with fresh water, the SP normally shows a relatively large
deflection to the left in relation to the clay baseline. The SP deflection opposite the same
formation containing fresh water, however, would be relatively small. Another way to describe
the difference is to note that the formation with salt water shows a high negative potential in
relation to clay layers, whereas the formation with fresh water shows only a slight negative
potential. Some helpful observations in interpreting SP logs for formation with fresh water:
It is often difficult to interpret a SP curve at shallow depth. SP deflections are more
pronounced in moderately deeper to deeper wells because, as depth increases, the
ground-water tends to become more highly mineralized.
The first step in interpretation is to establish a clay baseline (shale baseline) on the log.
If clay layers are not present, the SP log add little information to the interpretation. For
many wells, the SP curve may be of little value, because variations in the curve may be
insignificant.
60
DDCAP Technical Manual for Drilling Works
For Technical Support Plan for the Drillers in DDCA
Note deflections to either the left (negative) side or the right (positive) side of the clay
base-line. Formations having deflections to the left, generally indicate groundwater
having higher chemical activity than formations having deflections to the right. These
deflections indicate the positions and thickness of aquifers containing fresh water.
Deflections in the SP curve may be insignificant unless the formation has at least a
thickness of 1 - 1. 5 m.
Conclusions drawn from the SP curve will generally correlate with data from the
resistivity curve, although the SP curve will usually move in opposite direction.
The clay baseline may shift gradually or abruptly at increasing depth for no apparent
reason.
SP curves should always be used in conjunction with resisitivity or other logs, because it
may be particularly difficult to interpret the curves.
Interpretation of Gamma Ray (GR) logs
In the hard rocks, we can say simply that silica rich, light colored, acidic rocks like granites,
gneiss, contain less radioactive decaying minerals and showing less cps, than rocks with less
silica content, but high in micas, dark colored, basic rocks, like diorites, gabbros, amphibolites,
shales contain more radioactive decaying minerals, showing more cps.
A problem of interpretation is related to the borehole diameter. As we know, gamma ray can
only be detected around the borehole wall into the formation with a distance of about 0. 3 m.
Where caving clay or shales are encountered and a wash-out occurs, the gamma ray log will
indicate low cps opposite of the enlarged section of the borehole. Thus the log will appear to
indicate a sand- or granite formation. Borehole samples, the driller’s log, and a caliper log can
be used to minimize this difficulty in interpretation.
4.2.3 DETERMINATION OF SCREEN POSITION
After having successfully carried out the borehole-logging operation, the casing plan has to be
established. As described earlier, in certain low-yielding wells it might be suitable to carry out the
logging the other day, allowing the low recharging water table to rise to the static level. The
following information is necessary to establish a sound casing plan:
Situation of the static water level after completion of drilling
Depth of various or single water strikes
Description of the drill cutting samples
Penetration rate records
Measurements of water quantities at various depths
Information about the stability of the borehole wall
Drillers general observation of fracture zones and water strikes
Generally, high yielding water wells with distinctive, groundwater producing fractures zones need
only a limited quantity of screen length opposite of the fractures. Low yielding wells however, or
wells with a certain number of micro fractures need a longer screen length to exploit groundwater
as much as possible from every fracture present. In order to achieve a hydraulically good
connection between the well and the aquifer(s), it is good practice to install one screen section only,
for better inflow conditions of the groundwater into the well.
For a more safe installation of the well assembly into the well, it is common practice to drill some
1-3% deeper than the depth, at which it is intended to place the bottom cap of the casings. The
following pipe-lengths are available to install within the project:
Plain casing length of 5.72 m
Plain casing length of 2.81 m
61
DDCAP Technical Manual for Drilling Works
For Technical Support Plan for the Drillers in DDCA
Plain casing length of 0.93 m
Plain screen length of 2.81 m
The depth calculation of the casings and screens to be installed into the borehole should start from
the bottom to the top of the borehole, indicating as well the portion of casings, which is going to
stand over the ground surface. Knowing from the records the height of the drilling table of the
drilling rig above ground surface, it is possible to indicate exactly the casing depth.
Screens need to be placed opposite of groundwater bearing zones (aquifers) and not shallower than
the first water strike, which was reported during drilling. The project is not allowing the installation
of screens at a shallower depth than 20 m below ground surface.
Generally on top of the bottom cap (lowest part of the well) a so called sedimentation pipe or sump
pipe has to be installed, being a plain casing pipe with 2.81 m length.
Centralizers have to be installed around casing and screens in the depth where gravel pack is
intended to be placed, in order to keep the pipes centrically in the borehole and allowing the gravel
pack to be placed evenly around the screen pipes.
Figure 26 shows the example of logging results and casing program for a borehole in sedimentary
formation in Kisarawe region. Figure 27 shows the one for a borehole in hard rock formation in
Bagamoyo region. Principally, resistivity shows the high value at the position of the aquifer in
sedimentary formation. On the contrary the resistivity of the aquifer in hard rock formation
becomes higher than the formation with lower water contents.
62
DDCAP Technical Manual for Drilling Works
For Technical Support Plan for the Drillers in DDCA
5 GRAVEL PACKING (TA CODE 7)
5.1 DETERMINATION OF GRAVEL SIZE (TA CODE 7-1)
Various parameters shall be considered for the design of gravel pack such as aquifer
characteristics,screen size, discharge rate, hole diameter and so on. The size of the gravel shall be
principally less than the size of the slot of the screen. The velocity shall be considered upon the
decision of the hole diameter so as not to cause the sand production.
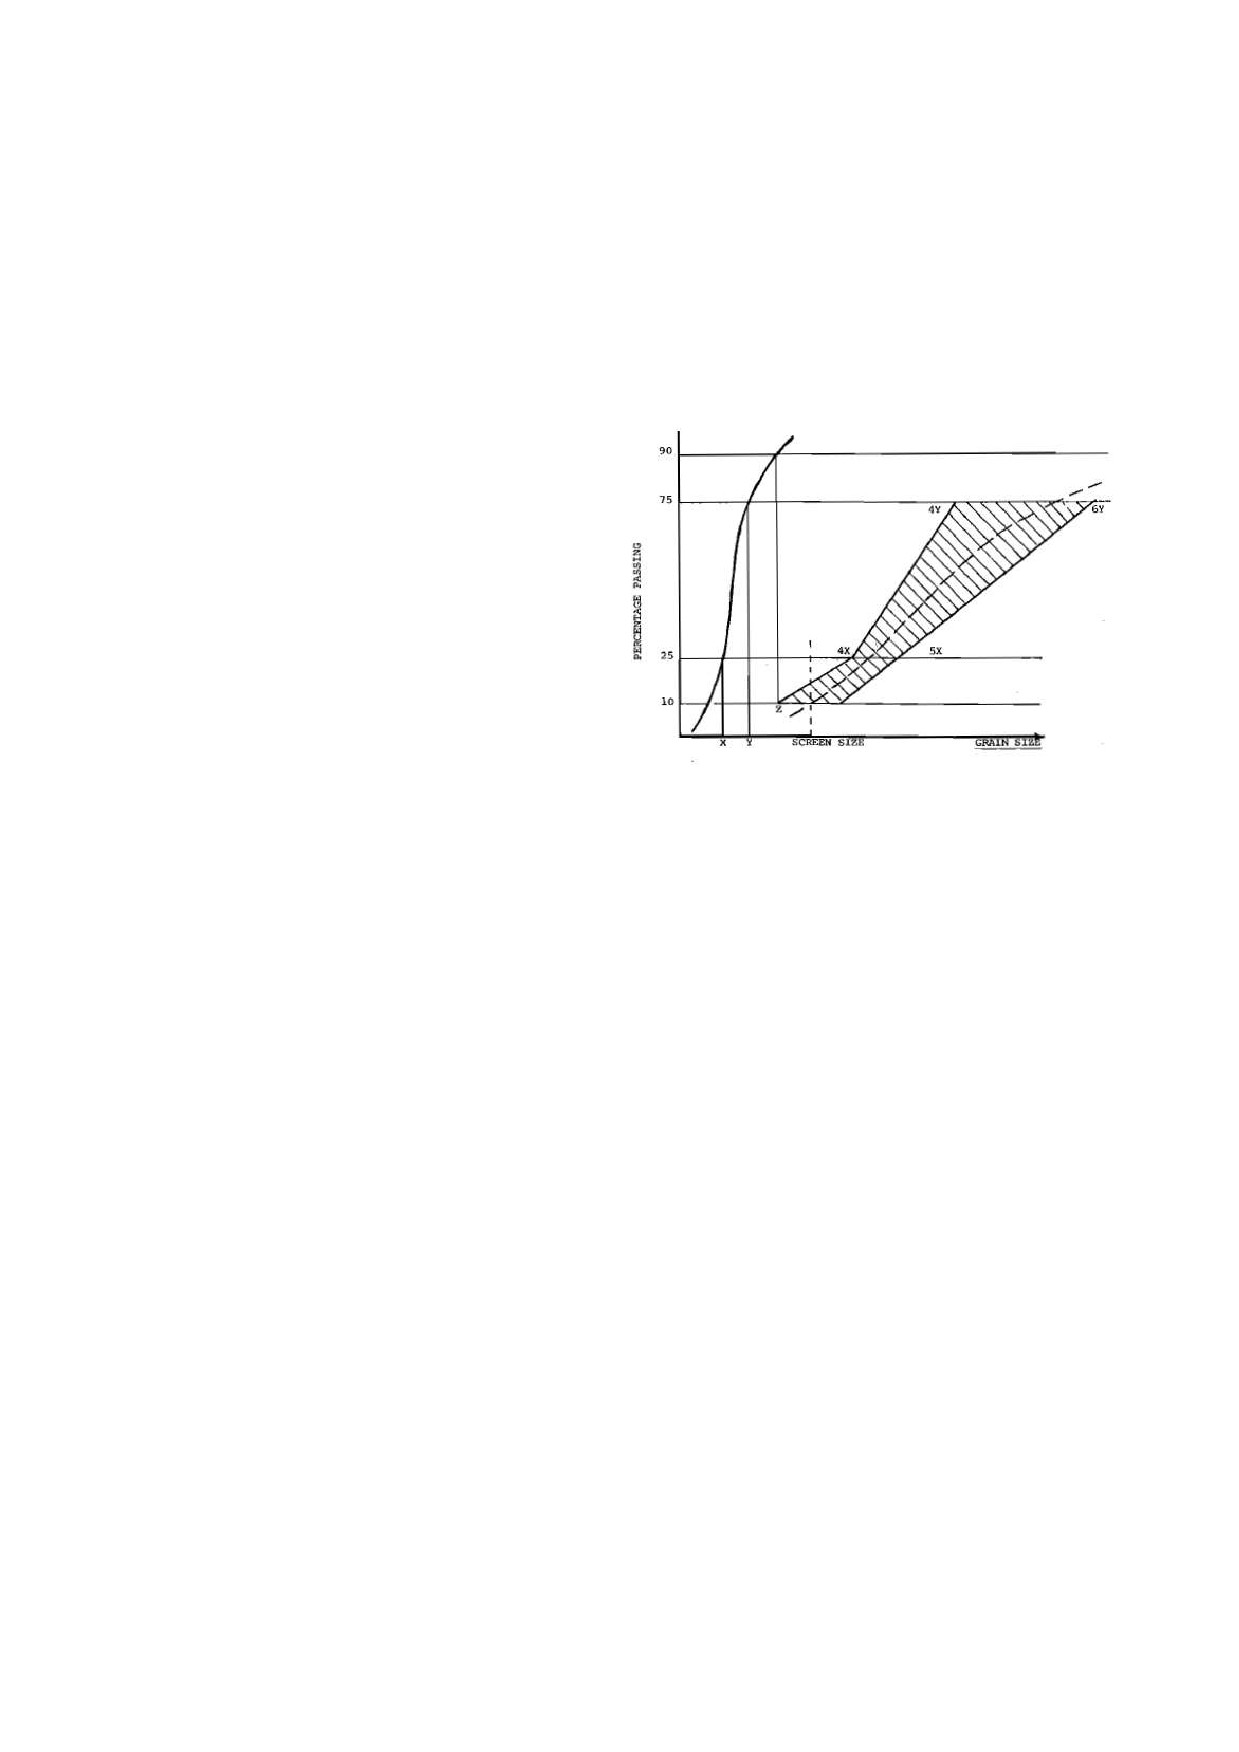
The steps necessary to design a gravel pack are as follows (Refer to Figure 28):
1. Read off the 25 % and 75 % grain
size values of the percentage of
material passing and multiply them
by 4 and 5, and 4 and 6 respectively.
Plot these results on the graph.
2. Draw connecting lines through 4X
and 4Y and 5X and 6Y.
3. Transfer the position of the
90 %
passing to the 10 % passing position
for the same graph size. This point
then becomes Z.
4. Complete the line 4Y - 4X -Z.
Source: National Waterwell & Drilling Association of Australia
An envelop has now been defined
Figure 28 Example of Gravel Pack Design
(shaded area). The gravel pack
analyses should fall within this
envelop (except at its extreme ends). Search around for suitable rounded gravel which
will fall within this envelop or can easily be adjusted (by addition or subtraction of sand
or gravel) into the envelop, e.g. broken curve - natural gravels of the ideal type are
difficult or time consuming to find, hence the envelop.
Select a screen size to pass 10 % of gravel pack and round up to nearest 0.1 mm (100
micron).
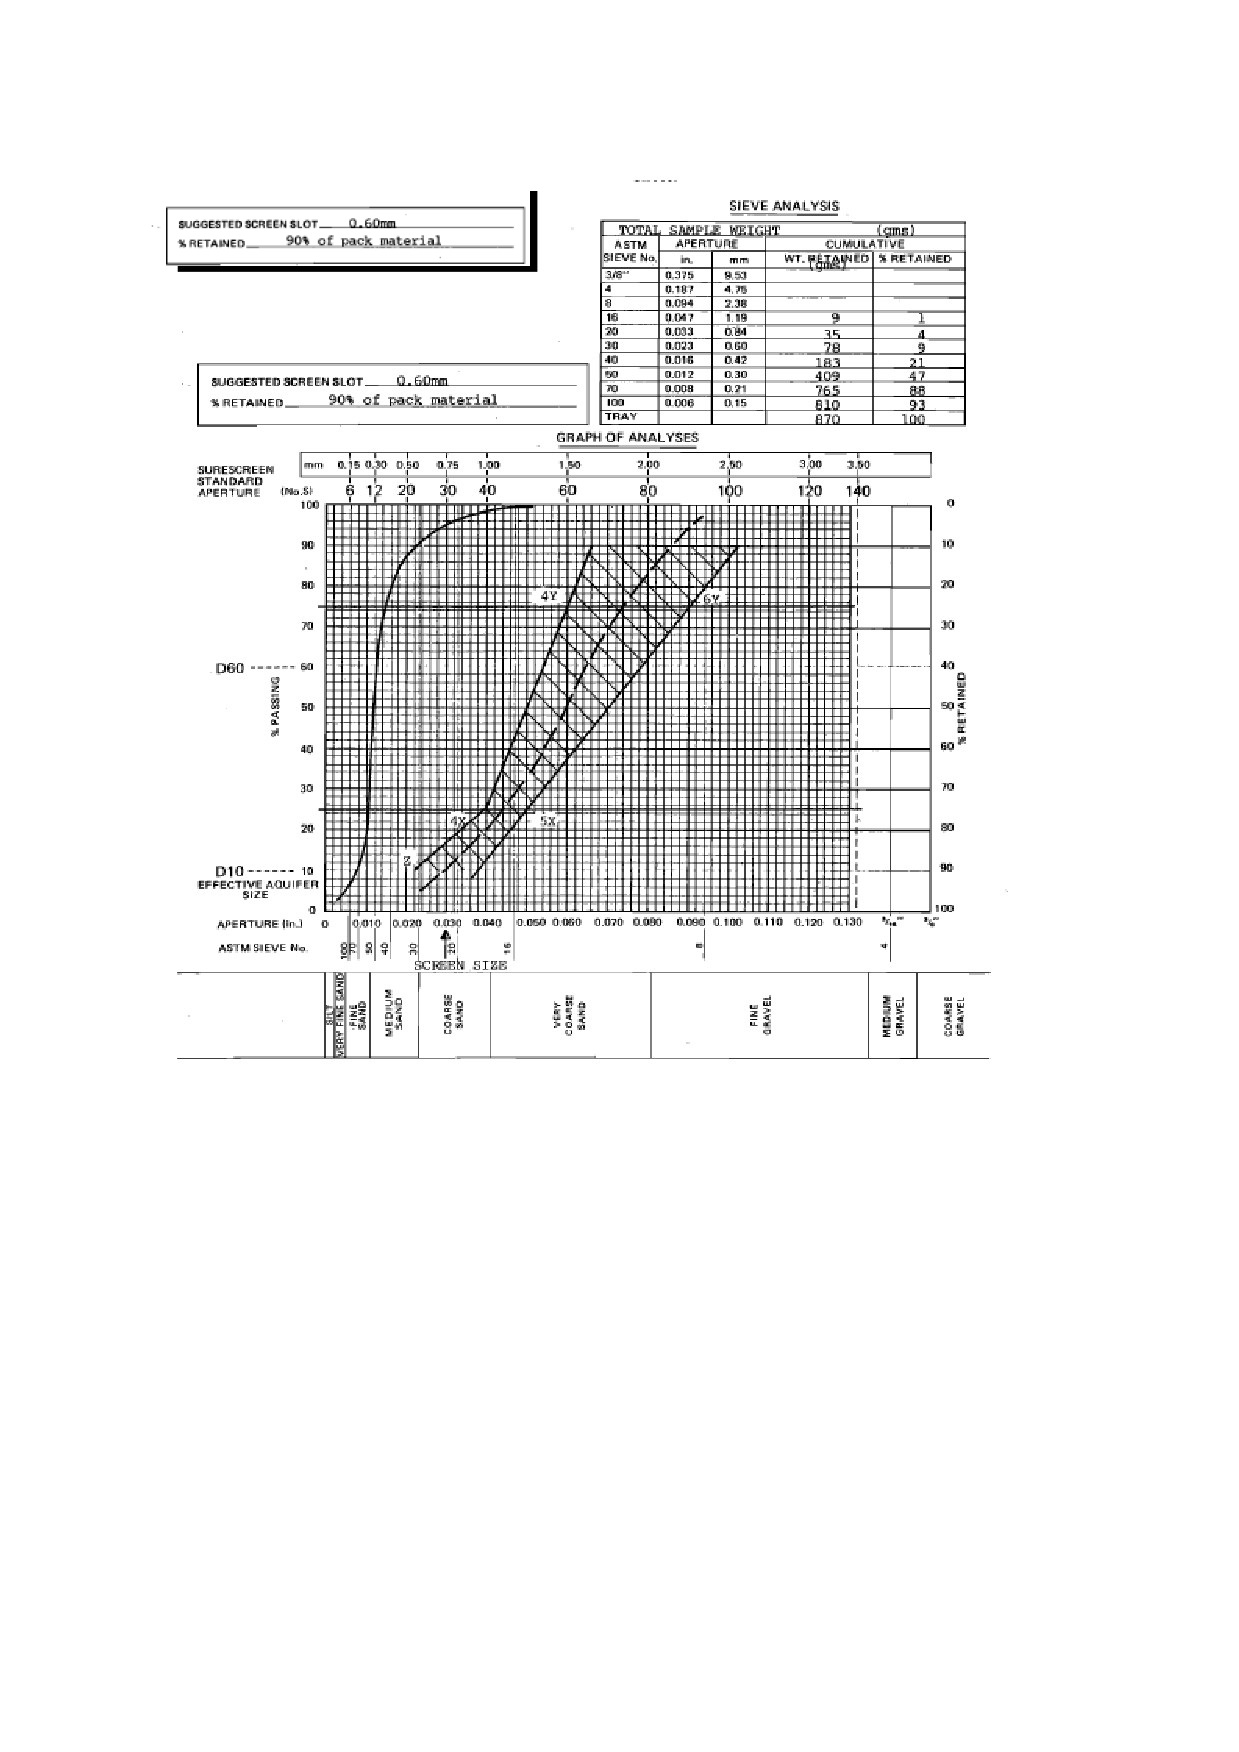
To sieve analyse a sand sample (Refer to Figure 29):
1. Select a sand sample and thoroughly dry it ( a clean BBQ plate is ideal for drying).
Extreme heat should be avoided since it may cause breakage of the grains. The sample
quantity can be any amount, but about 0.8 to 1.0 kg is convenient.
2. Weight the sample.
3. Arrange sand sieves according to aperture, largest opening at the top, smallest at the
bottom, and place pan on bottom. Pour in sand sample and shake sieves.
4. Weigh the quantity trapped on each size (largest to smallest) and the bottom pan.
5. Add the individual quantitie and compare the figure with the original smaple weight. If
less than 5 % difference) proceed with calculation. If greater than 5 %, look for and
correct the mistake, or start again.
6. Complete cumulative percentage retained as per Sieve Analysis sheet.
7. Plot sieve size versuscumulative percentage passing on Sieve Analysis sheet.
65
DDCAP Technical Manual for Drilling Works
For Technical Support Plan for the Drillers in DDCA
Source: National Waterwell & Drilling Association of Australia
Figure 29 Example of Sieve Analysis Sheet
66
DDCAP Technical Manual for Drilling Works
For Technical Support Plan for the Drillers in DDCA
5.2 CALCULATION OF GRAVEL VOLUME (TA CODE 7-2)
Drillers are required to acquire the calculation method of the volume of gravel including the safety
factor to be considered according to the conditions of
each borehole. The miscalculation of the gravel
volume will bring about the interruption of the
drilling work. Furthermore, insufficient volumeof
the gravel can be the cause of the turbidity of the
pumped water after the delivery to the client.
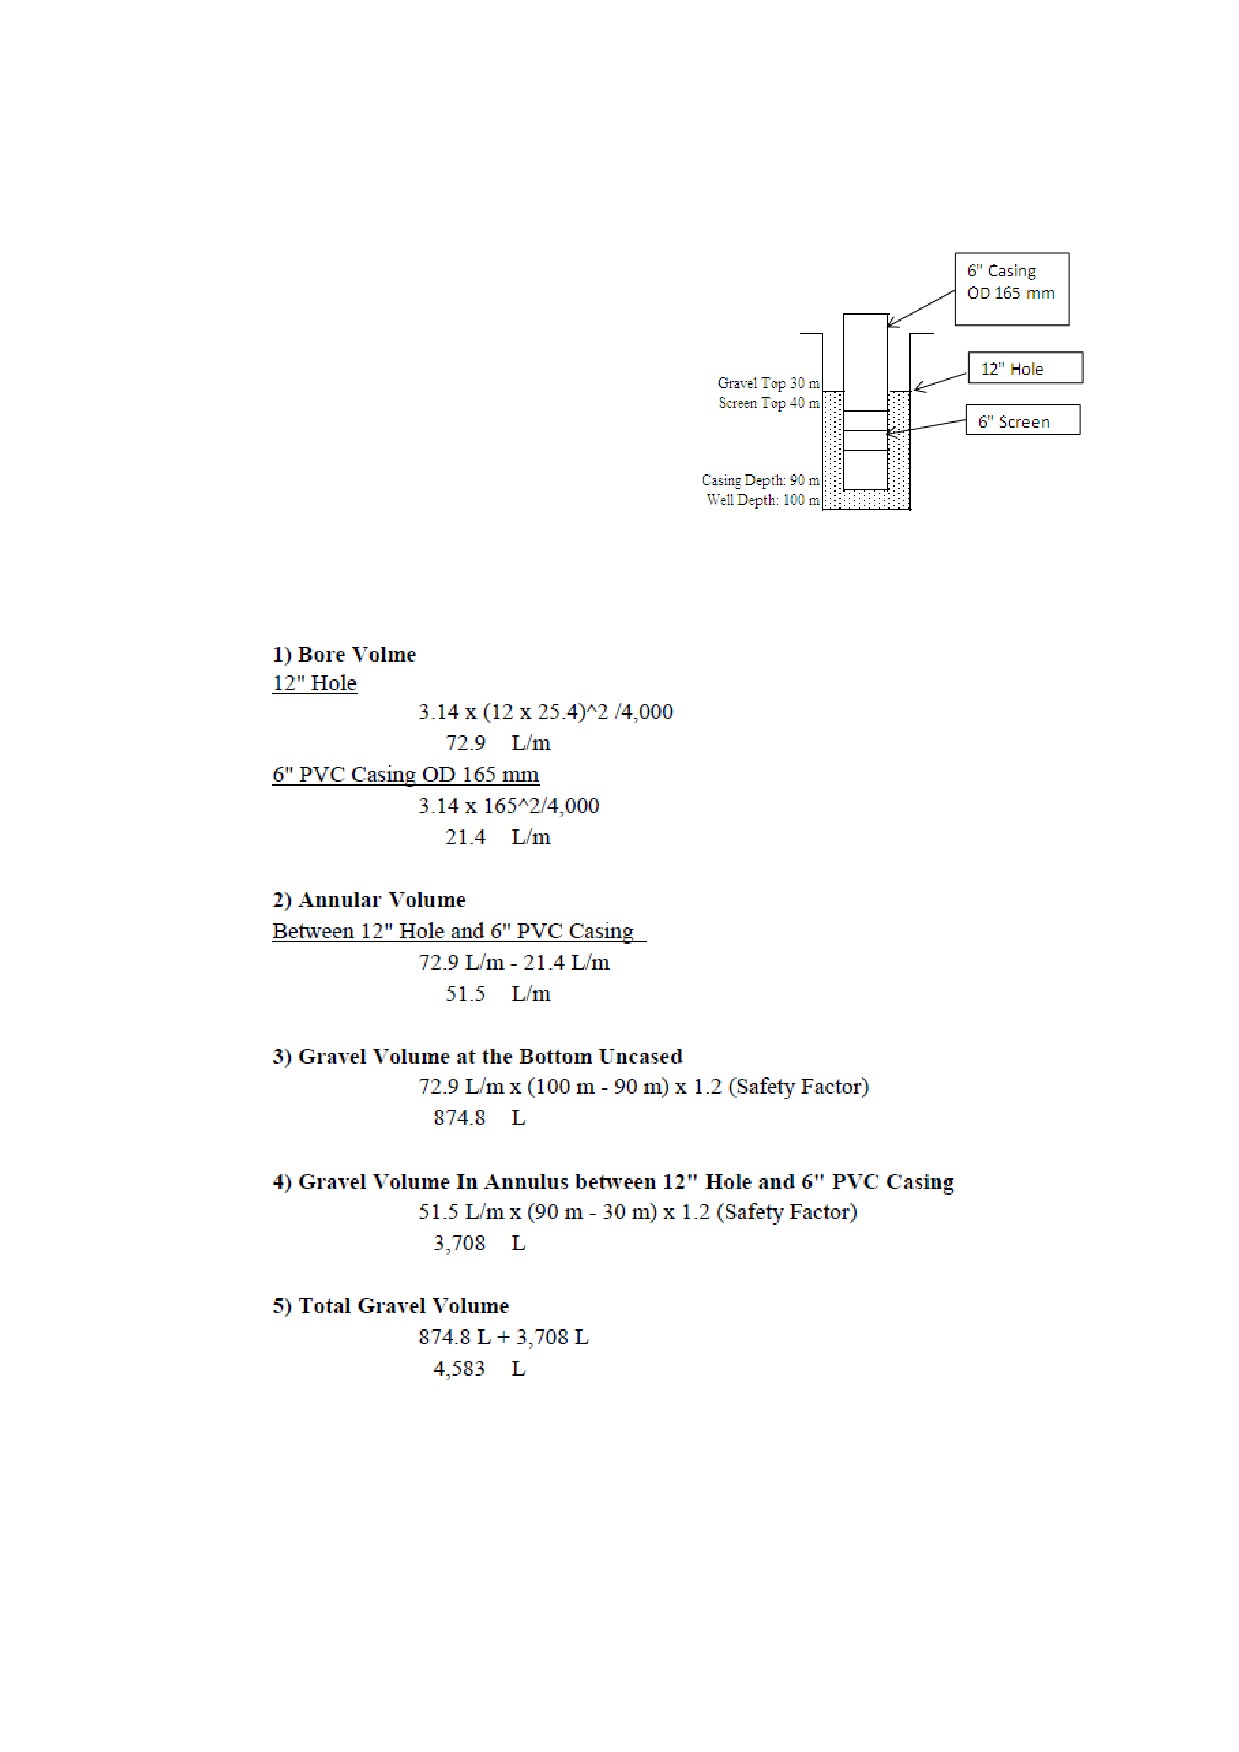
This section gives an example of the gravel
calculation for a borehole design shown in Figure 30.
The borehole was drilled down to 100 m and casing
was planned to be installed down to 90 m. The top
of screen is 40 m and the gravel is to be packed up to
Figure 30 Example of the Gravel
30 m from the ground level. The volume of the
Calculation
gravel is calculated as described below:
1) Bore Volme
The gravel is to be packed in two parts of the borehole, i.e. the uncased bottom from 90 m to 100 m
and the annular space between 12” hole and 6” PVC casing. With the consideration of the
enlargement of the drilled hole according to the geological conditions, safety factor of 1.2 is taken.
The total gravel volume is calculated as 4,583 L.
67
DDCAP Technical Manual for Drilling Works
For Technical Support Plan for the Drillers in DDCA
5.3 GRAVEL PACKING (TA CODE 7-3)
5.3.1 GRAVEL PACKING PROCEDURES
When the well assembly is successfully installed into
the borehole and the assembly is still hanging in the
hole, the annular space between casing and screens and
the borehole wall has to be filled with filter gravel.
The filter gravel is also called gravel pack or formation
stabilizer. The gravel is normally well graded in
relation to the grain size of the aquifer material and is
to filter the entering groundwater and holding back
fine material from the formation to enter the well.
For borehole drilled into rock formation, a gravel pack
with a grain-size of 3-5 or 3-6 should be installed.
The volume of the gravel to be poured into the well has
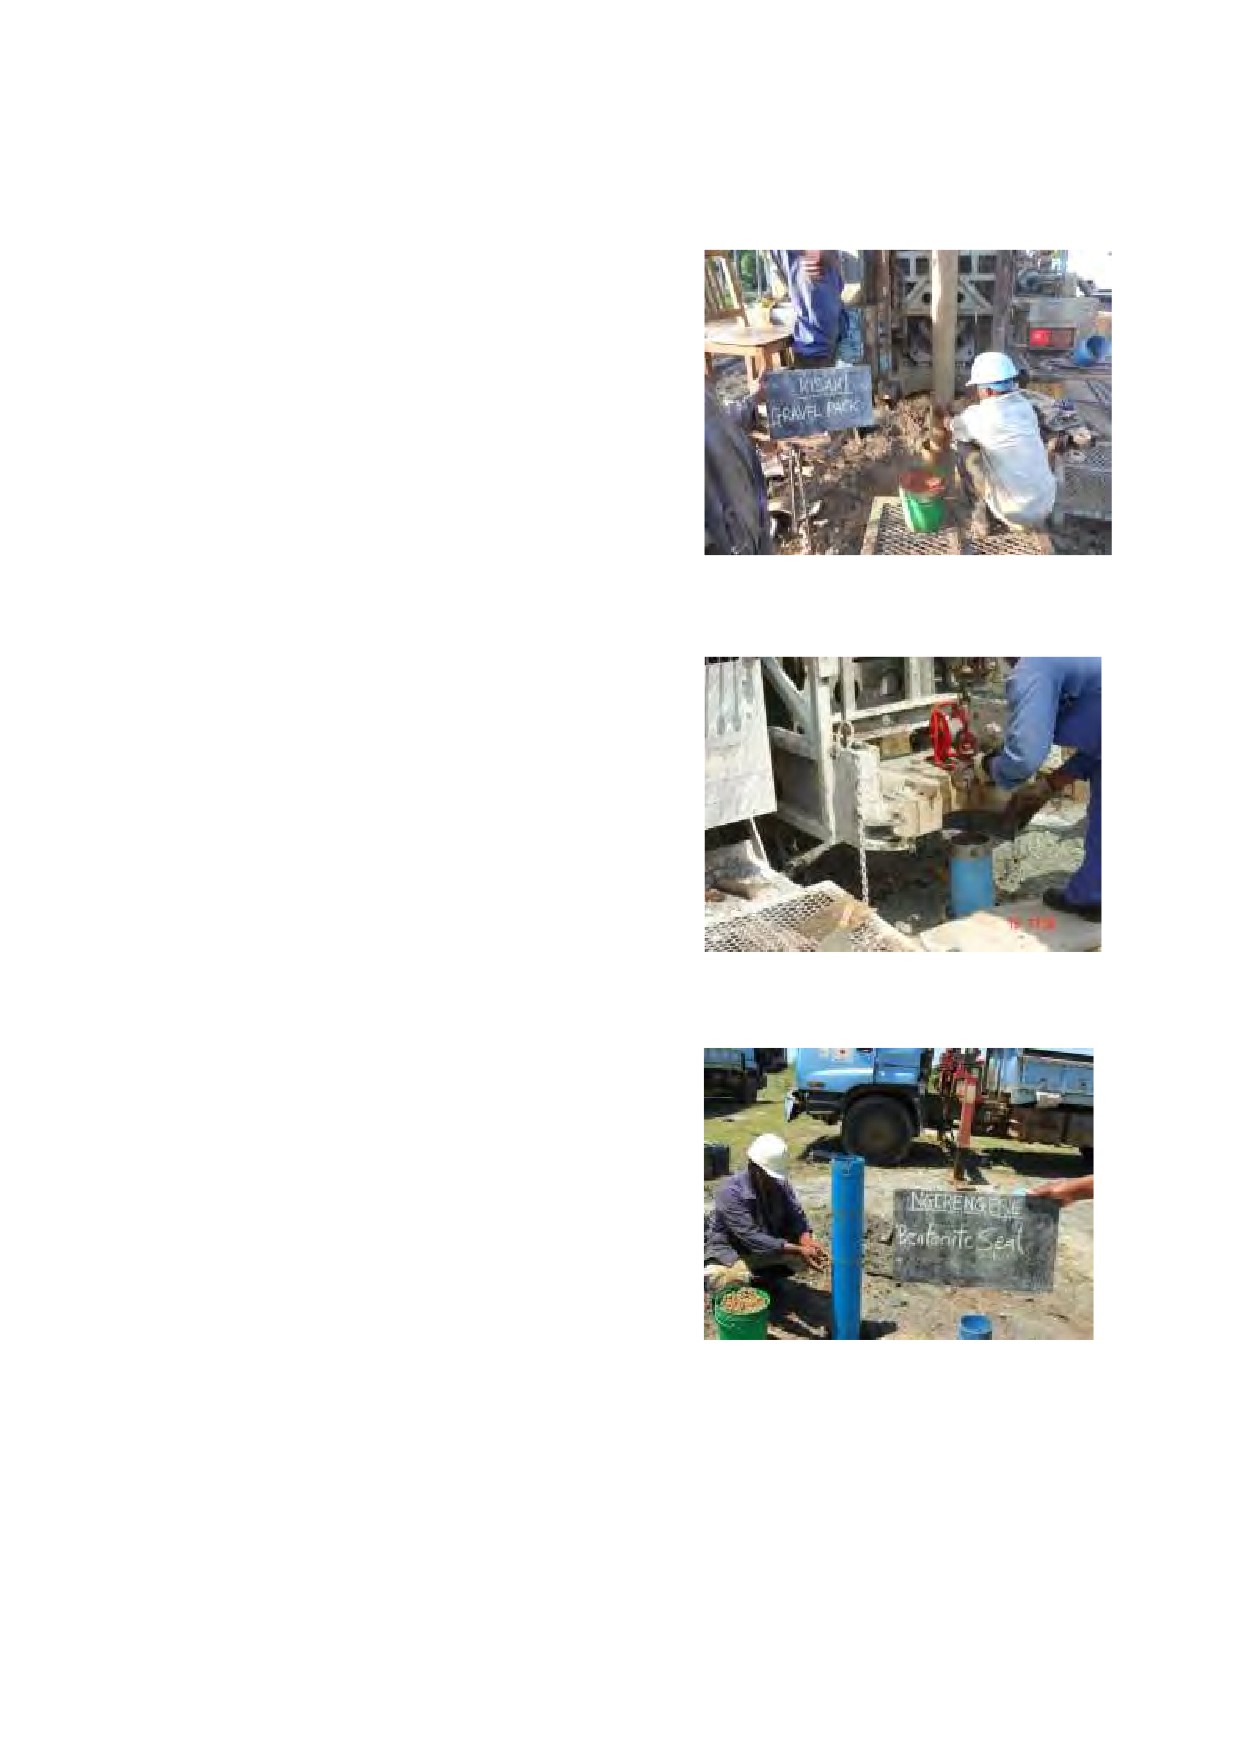
Figure 31 Installation of Gravel
to calculate accurately. The gravel pack shall be
Pack
installed at least 10 m above the depth of the highest
screen. The drilling diameter of
8
½” equals a
volume of 36.59 l/m. The volume of the PVC pipe
with a diameter of 165 mm equals 21.37 l/m has to be
deducted from the volume of the drilling diameter.
The volume of the annular space comes then to 15.22
l/m. One sack of filter gravel has a volume of about 30
l. With one bag of filter gravel almost 2 m of annular
space between pipes and borehole wall can be filled.
It is always good practice to have some 20 % more
gravel on site than calculated, because some parts of
the formation could have washed out fractures or has
been caved out by the drilling process.
Figure 32 Measurement of Gravel
The installation of the gravel has to be done slowly and
Top
in careful manner to allow the gravel to pour into the
borehole with a most even flow rate (See Figure 31).
This is to avoid bridge building of the gravel pack,
which can have serious results, when not noticed and
corrected. Should a gravel bridge being developed,
then pump with some pressure clear water into the well
pipes, which will enter through the screen openings
into the annular space and will lift up the gravel bridge
and allow it to settle down.
During the pouring of gravel mea sure the gravel level
from time to time to avoid overfilling and bridging.
After the installed level of the gravel pack has been
Figure 33 Installation of clay
confirmed by measuring (See Figure 32) and after
pellets
allowing for certain additional time to have been
settled fully, a clay sealing is installed on top of the gravel pack (See Figure 33).
There are commercial clay (bentonite) pellets available, which are poured into the annular space
the same way as the gravel has been installed. When the clay pellets are coming into contact with
water, they are expanding their volume (of up to 45%) and therefore sealing off the annular space
completely. The sink velocity of clay pellets is about 25-30 m/min.
68
DDCAP Technical Manual for Drilling Works
For Technical Support Plan for the Drillers in DDCA
A clay layer in the annular space of about 3 m should be sealing off the aquifer formation against
any kind of surface water, which could contaminate the fresh water of the aquifer.
As described earlier, also the installation of the clay sealing has to be done slowly and carefully to
avoid bridging of the material.
69
DDCAP Technical Manual for Drilling Works
For Technical Support Plan for the Drillers in DDCA
6 WELL DEVELOPMENT (TA CODE 8)
6.1 WELL CLEANING AFTER DRILLING (TA CODE 8-1)
After the well-construction has been completed and the surface cementation could be hardened for
more than 24 hours, the water well should be developed.
The well was dug into the ground and while the water well was completed, the surroundings of the
well became certainly disturbed by the drilling process. Well development is the operation to
re-generate the previous free-flow situation of the groundwater, in spite the fact that well pipes and
artificial filter gravel has been installed into the ground. The development and pumping test team
shall be equipped with the following equipment:
An air-compressor with 8 bar pressure and 125 l/s air-volume
Air injection pipe, which for 4” to 6” wells is usually a PE hose with a diameter of 40 mm to
50 mm and a length of 100 m with connection subs to the air-lift tool and to the compressor
Airlift-tool, which is generally a metal pipe with diameter of 40 mm as well, and is Closed at
the bottom end and having about 40 holes of diameter 4 mm around the length of the
circumference of this pipe
water level indicators with a length of 150 m
1 metal bucket with a content of 20 l for measurements of water discharge rates
1 outflow pipe of 1 m length with yield adjustment valve
1 Pick Up truck for transportation of personnel and material
There are various well development procedures
carried out due to special requirements, special
hydro-geological situation, well diameter and
depth of the wells. For the rather shallow and
slim wells drilled with depths of 100 m and 6”
PVC well assembly installation with
8
½”
drilling diameter in hard rock formation only, a
direct airlift procedure without the use of special
conductor pipes, will be sufficient(Figure 34).
The fine material can be removed from the
fractures or contact zones (aquifers) and from the
gravel pack. The development normally takes
duration of 4-8 hours, which can be prolonged
until the well will be free of sand. Compressed
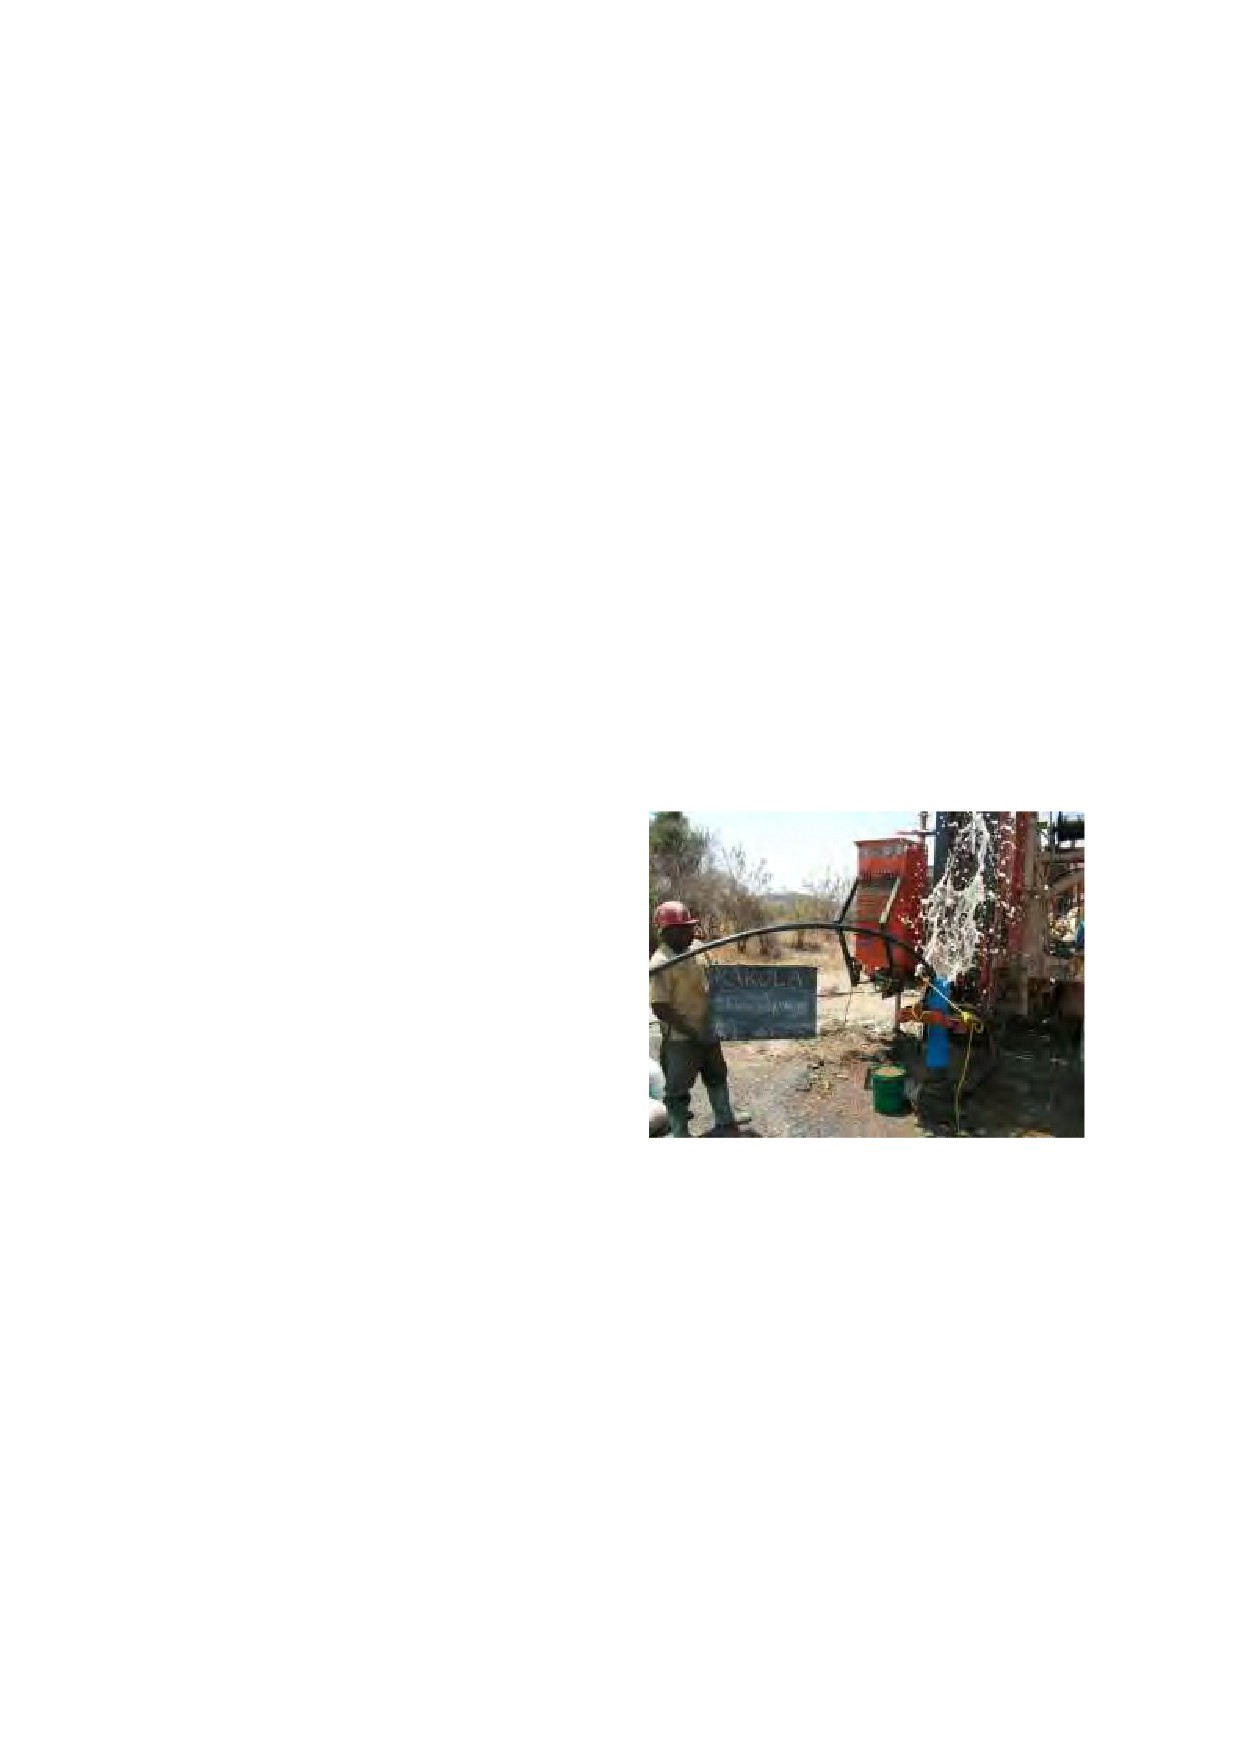
Figure 34 Development by
air to develop wells is widely used in
Single-Tube Air-Lifting
unconsolidated, loose, sedimentary formation, as
well as in hard rock formation.
In air surging (or flushing) the air is injected into the well directly through a single air injection
pipe (the well pipes are then quasi conductor pipes) to lift the water to the surface. When the
water reaches the top of the casing on the ground, the air supply is shut off, allowing the aerated
water column to fall. Air lift pumping
(continuous airlifting) is used to pump the well
periodically to remove fine material from the screen, gravel pack and from the borehole.
Air development should begin by determining that the groundwater can flow freely into the screen.
Application of too much air volume into the borehole, when the screen and formation are still
clogged by fine material can result in a collapsed screen. So in the beginning of air development
the initial pumping rate has to be minimized and the air-injection pipe should be placed at a rather
shallow submergence. Once the uninhibited flow of groundwater into the screen has been
established, the injection pipe can be lowered close to the bottom of the well. Before blowing any
70
DDCAP Technical Manual for Drilling Works
For Technical Support Plan for the Drillers in DDCA
water out of the well with a sudden large injection of air, the airlift should be operated at a reduced
rate.
Airlifting from the well has to continue until the water is virtually free of sand. Normally the
entire length of the screens has to be developed. The air-injection pipe is raised through the
screen length by certain intervals. From time to time and at least at the end of the development
the injection pipe has to be lowered again to the bottom of the well to blow out the last fine
material which has been accumulated in the sump (sedimentation) pipe on top of the bottom cap.
Patience, intelligent observation, and the right tools are requested to develop a well correctly. Well
development is not expensive, considering the often remarkable results that can be obtained in
improving yields and eliminating sand- and fine material pumping.
Similarly, aquifer
development is often overlooked an effective way to increase yields substantially.
For the other various methods of the development, please refer to Section 13-2.
71
DDCAP Technical Manual for Drilling Works
For Technical Support Plan for the Drillers in DDCA
6.2 SINGLE TUBE METHOD AIR LIFTING (TA CODE 8-2)
There are two major measures for air-lifting, i.e. single tube method and double tube method. As
shown in Figure 35, single-tube method is very simple and does not require very complicated
equipment. However this methods transmits its hydraulic force directly to the casing, screen pipes.
And sometimes, it damages the pipes, especially when the well depth is deep and water level is
shallow. When it is applied. Installation depth of the air nozzle shall be gradually increased to
decrease the shock upon the commencement of the air-lift pumping.
Figure 35 Single Tube Air-Lifting Method
72
DDCAP Technical Manual for Drilling Works
For Technical Support Plan for the Drillers in DDCA
6.3
DOUBLE-TUBE METHOD AIR LIFTING (TA CODE 8-3)
The double-tube method requires more complexed equipment compairing to the single-tube
method (See Figure 36). However, there are several advantage for this mehod as follows:
The shock upon the commencement is less than the one of the single tube method. As the
air going up between the outer educator pipe and the inner air pipe.
It is possible to measure the discharge rate and the dynamic water level if the proper air-lift
manihold is used.
The disadvantage is that the crane truck is necessary to handle the pipes, as steel pipes are needed.
The selection between the single-tube method and the double-tube method is examined according
to the well design and geological conditions.
Figure 36 Double-Tube Air-Lifting Method
73
DDCAP Technical Manual for Drilling Works
For Technical Support Plan for the Drillers in DDCA
7 BACK-FILLING&SURFACE CEMENTING (TA CODE 9)
7.1 BACK-FILLING (TA CODE 9-1)
After having confirmed the top of the clay sealing by measurement, the annular space on top of the
clay sealing has to be backfilled with drill cuttings up to a depth of 5 to 10 m below ground surface
as required by the specification. It is not allowed to backfill using organic material. Also this
backfilling has to be carried out slowly and carefully.
Water Resources Division (WRD) of Ministy of Water prepared the government specifications and
regulations applicable to water well drilling and installation. The work specification of back
filling is shown in this document. The document is distributed to all government agancies and
private drilling companies which have registered to the drilling permit. The application of this
document is necessary for DDCA to duly follow it. The full document is shown in Figure 37.
TO: ALL GOVERNMENT AGENCIES, PRIVATE WATER WELL DRILLING
COMPANIES, CONTRACTORS AND NON-GOVERNMENTAL ORGANIZATIONS
GOVERNMENT SPECIFICATIONS AND REGULATIONS APPLICABLE TO
WATER WELL DRILLING AND INSTALLATION IN TANZANIA
MAINLAND
1.
All water well drilling operations in the country are to be undertaken by registered
companies, contractors and NGOs with a water well drilling permit and certified drillers.
2.
A Water Well Drilling Permit will be issued to a registered company, contractor, executive
agency or NGO upon satisfying the following requirements:
(i)
Making application letter listing equipments, drill rigs and accessories as well as
CVS of personnel should be attached.
(ii)
Physical inspection of the listed items and scrutinizing of personnel by Officers
from the Ministry of water, Water Resources Division.
(iii)
Certification of drillers.
Upon satisfying the Ministry requirements, a water well drilling permit will be
issued.
The Drilling Water Well Permit is of six months or one (1) year duration and is renewable
upon continuing to meet the above requirements and showing satisfactory performance in
the past year.
3.
Any registered company, public executive agency or NGO with Ministry Water Well
Drilling permit before embarking on water well drilling will make an application and be
issued with Borehole Identification Number (s) for new water wells to be drilled.
4.
No drilling activity in the country is to be undertaken without a Hydrogeological and
Geophysical survey, the Technical Report of which must be submitted to the Basin Water
Officer of the respective Basin and a copy to the Ministry of Water, Water Resources
Division.
5.
Upon submission of the said Hydrogeological and Geophysical Technical report, a Water
Well Drilling Clearance Permit will be issued by the Basin Water Officer to the prospective
client. No client will be allowed to have a water well drilled in his/her property without
such a permit.. A clearance permit will be given within seven days after submission of
the Technical report.
6.
Each new water well must be assigned an identification number and its geographical
position given in UTM co-ordinates where possible, previously given to the recommended
borehole site, and should not under any circumstances be changed by the driller.
7.
On completion of the water well, the drilling technology to drill the well, changes in
diameter, depths to each water strike, as well as the static water level from the ground
surface must all be indicated in the completion forms.
Figure 37 Government Specifications and Regulations
(1/3)
Applicable to Water Well Drilling and Installation Method
74
DDCAP Technical Manual for Drilling Works
For Technical Support Plan for the Drillers in DDCA
8.
If the upper section of a well is in unstable rock formation, temporary or permanent
cementing/casing must be installed for all exploration or production wells respectively. A
proper sanitary seal (or intermediate seals) must be placed to preserve, conserve and
protect groundwater resources (its quality) and reservoir pressure potential. This should
as well effectively prevent contaminated water to enter and mix with aquifer waters.
9.
All boreholes should be well cased and screened to bottom of the borehole and plugged
properly. No open boreholes will be allowed/ permitted.
10.
In order to ensure that no interference occurs between a new well and existing wells or
water body in the vicinity, the distance apart should be at least 300m for unconfined
aquifers and 100m for confined aquifers.
11.
While drilling, a site Hydrogeologist should properly collect drilling cuttings which will be
a representative of depth intervals of 2.0m. Where there is change in rock composition
(in between the said interval), this be noted in driller's report. Drill cuttings are kept in
sample boxes at the drilling site for lithological logging. However, a small portion (250
gm) of each sample be placed in sample bag, properly labeled and sent to the respective
Basin Office for storage and future use. However a water well completion Report
detailing the well lithology should be prepared and a copy sent to Hydrogeology Section.
12.
If any borehole geophysics is undertaken, all relevant details of the exercise be recorded
and a report sent to the Basin Water Officer for further action and again a copy sent to the
Water Resources Division.
13.
All casings and screens to be installed in a production water well have to be properly
chosen to prevent chemical and/or galvanic corrosion and thus guarantee structural
integrity of the well, long life and good quality of water.
14.
The selection of gravel pack material, with pear size grains and rounded shape has to be
installed into the angular space of the drilled well after having been washed and sieved.
The material used has to ensure that well efficiency is not lower than internationally
accepted Standards. The thickness of gravel pack installed shall likewise satisfy the same
conditions.
15.
Internationally accepted methods of well cleaning, development to clear and silt free state
of water and step- draw down pumping test followed by a constant rate pumping test of at
least 24 hours depending on the yield of the borehole shall be followed. Evaluation of
pumping test results shall determine safe production limits and aquifer parameters, though
actual abstraction of water shall not exceed levels set by the granted water right for the
well. All records should be filled in a Completion form and sent to:-
(a)
Water Resources Division
(b)
Basin Water officer
(c)
Well owner
Note:
(i)
This information would later be required when well rehabilitation, maintenance or
Servicing works are due in years of its utility.
16.
Any newly drilled borehole that is not to be put immediately into operation should be
securely capped to protect it from vandalism or damage.
17.
A water well shall be commissioned and put to its intended use after a step- draw down
pumping test followed by a constant rate pumping test of at least 24 hours duration
depending on the yield of the water well and immediately followed by a recovery test until
initial SWL has been attained and thorough physical, chemical and bacteriological analysis
of the water by the Central Water Laboratory or a recognized and qualified laboratory.
18.
No groundwater abstraction shall commence until the well owner has been issued with a
Water Permit by respective Basin Water Office
19.
Water well disinfection must be undertaken after well installations and pumping test has
been completed to ensure that the water will be safe for human consumption where
internationally accepted standards shall apply as well.
20.
Any abandoned drilled water well must be properly and perfectly back filled to protect and
conserve ground water resources as well as to eliminate any hazards to human beings and
Figure
37 Government Specifications and Regulations
(2/3)
Applicable to Water Well Drilling and Installation Method
75
DDCAP Technical Manual for Drilling Works
For Technical Support Plan for the Drillers in DDCA
animals.
21.
Once a water well has been completed, a Completion Form (copy of which could be
obtained from Water Resource Division or Basin Water Officer) must be filled in. To
certify correctness of information, adherence to professional’s ethics and good
workmanship; it should be signed by the responsible Driller and countersigned by the
Basin Water Officer or his representative. The Driller or Company shall then produce
sufficient number of copies and distribute to the Well Owner, Water Resources Division
and respective Basin Water Officer.
Remarks:
Finally, let it be known that groundwater resources are the Nation’s Property.
They must be conserved and well protected if safe and sustainable water supply in
sufficient quantities and acceptable quality is to be guaranteed for present and
future generations. To safeguard its waters therefore, the Government will not
hesitate to take stern actions against person, institution or company which pollutes,
over pumps a water well or leaves an abandoned water hole not properly
back-filled. It is the responsibility of any water well drilling company or driller
to fully understand National and International Standards applicable in water well
drilling and installation practice which are safe to human, livestock, ecology and
the environment.
The Ministry of Water has in this respect, through the enacted relevant laws and
regulations, the capacity and duty to monitor, supervise, inspect, regulate and
control the water well drilling activities by both Government and non-government
water well drilling companies in TANZANIA MAINLAND.
Figure
37 Government Specifications and Regulations
(3/3)
Applicable to Water Well Drilling and Installation Method
76
DDCAP Technical Manual for Drilling Works
For Technical Support Plan for the Drillers in DDCA
7.2 SURFACE CEMENTING (TA CODE 9-2)
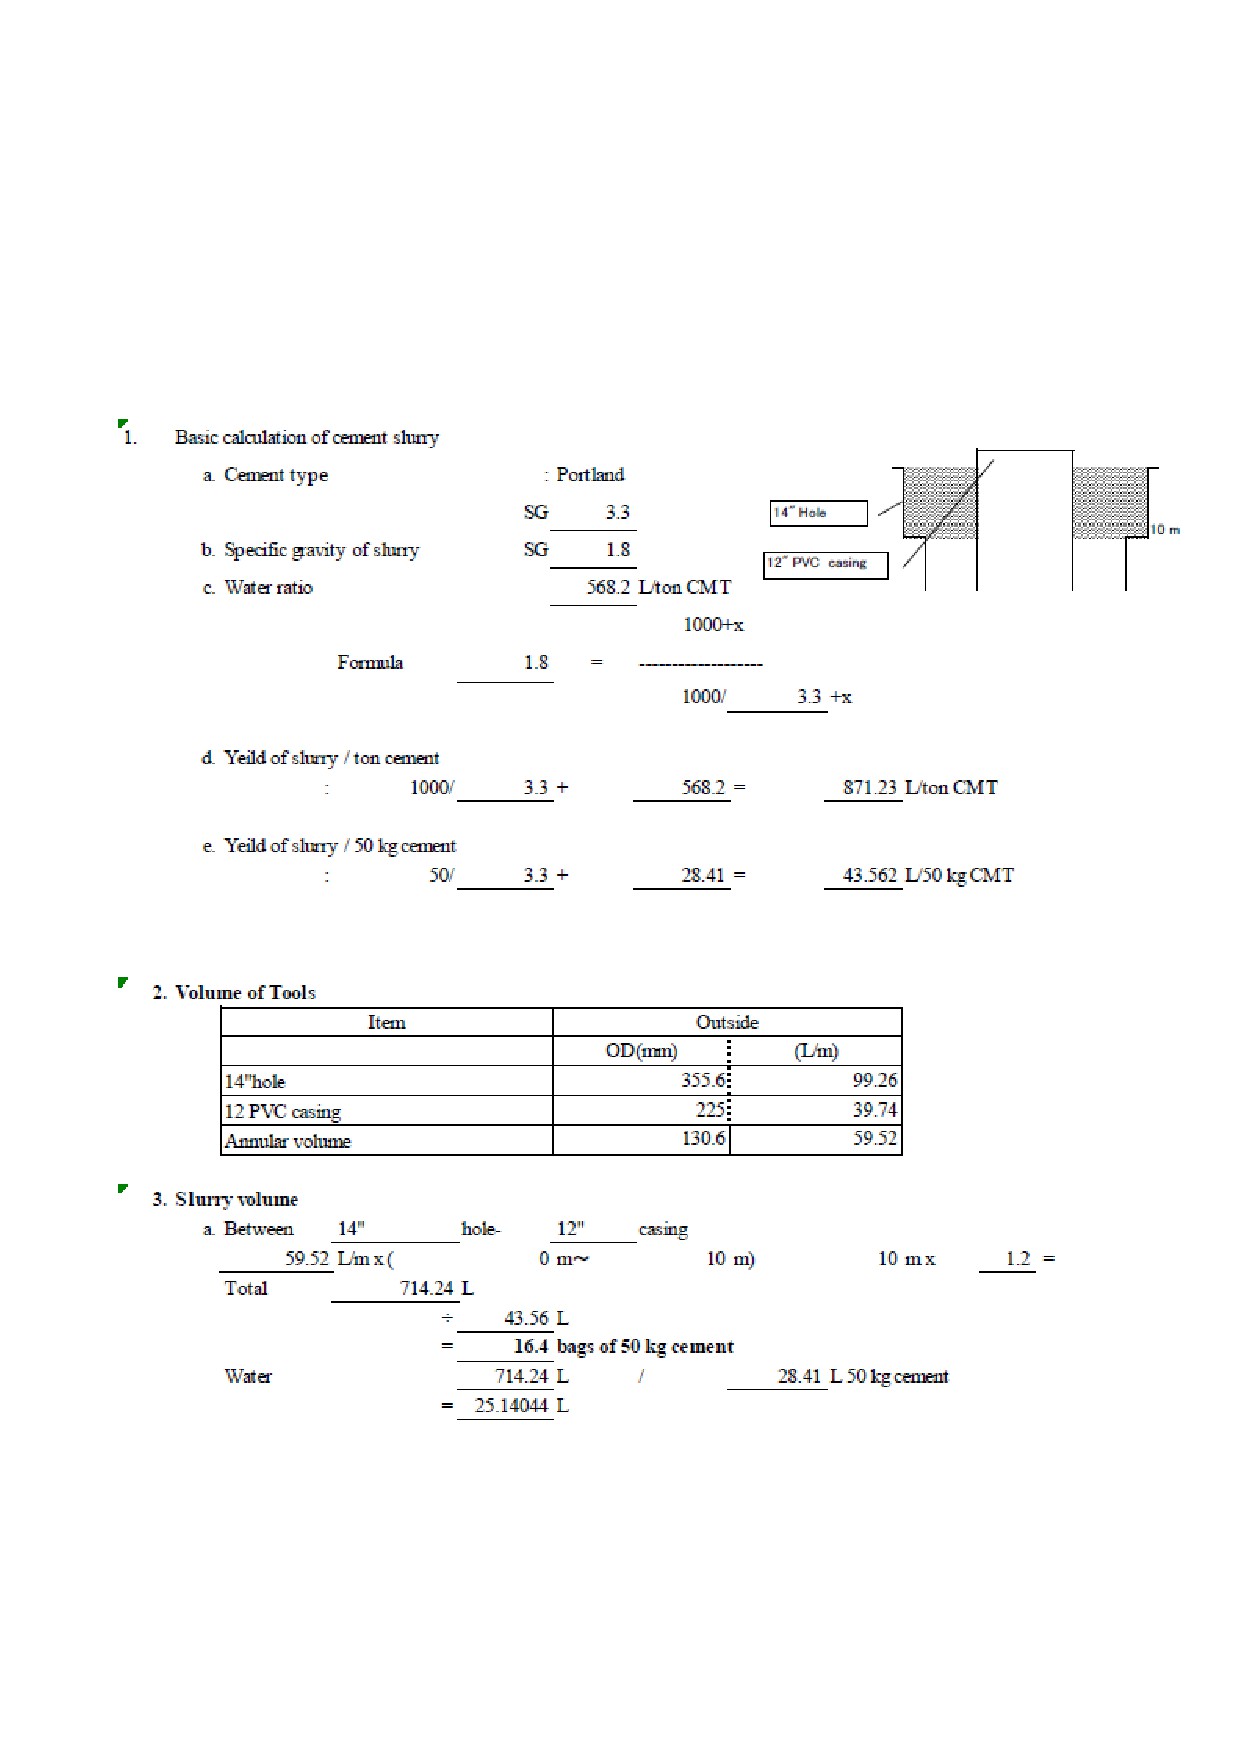
On the backfilling material, cement slurry has to be installed. The slurry consists only of Portland
cement and water. With a consistency of 25 l of water per one bag of 50 kg of cement the specific
gravity of the slurry will be 1.8. Allow the cement slurry to harden for at least 24 hours before
development works can be carried out in the borehole. Table 33 shows example of cement mixing
calculation, while Table 33 shows work procedure of surface cementing.
Table 33 Example of Cement Mixing Calculation
77
DDCAP Technical Manual for Drilling Works
For Technical Support Plan for the Drillers in DDCA
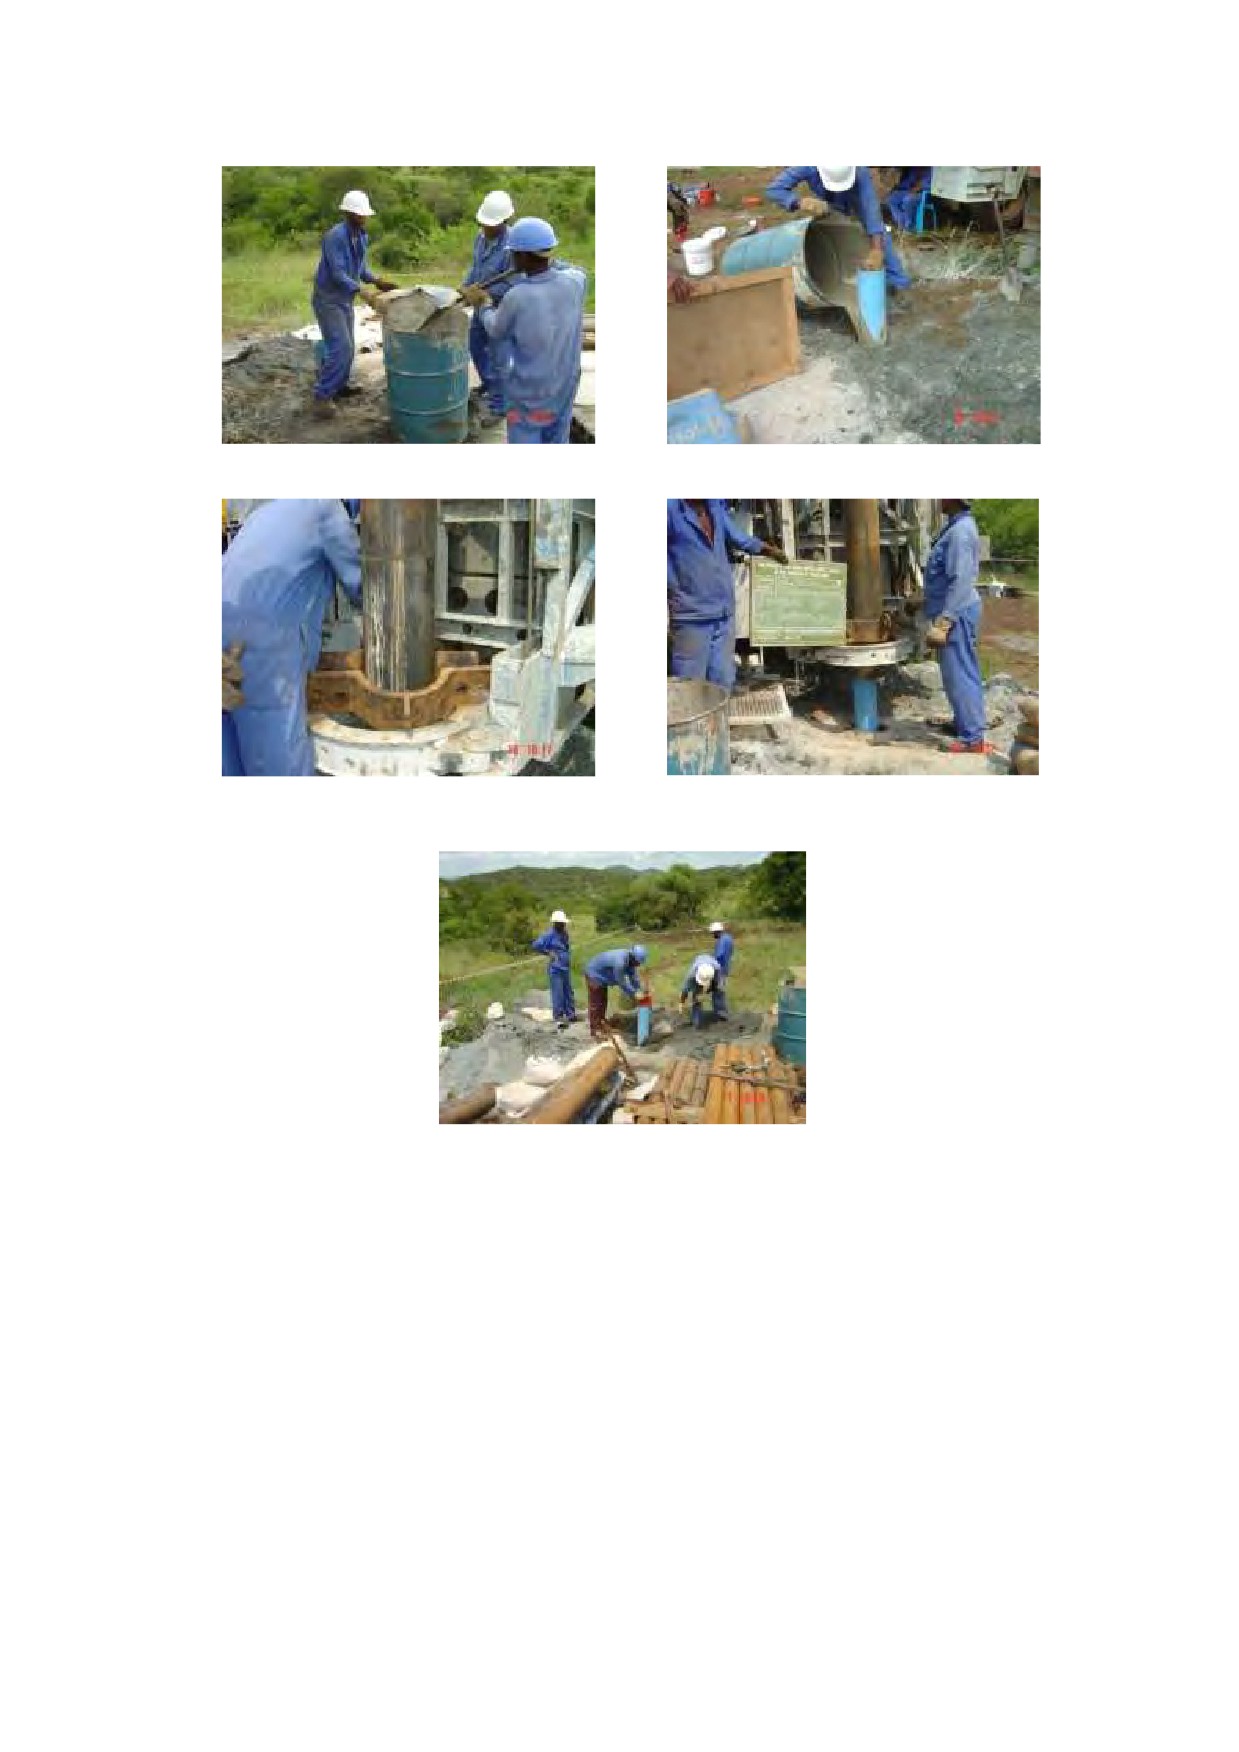
1. Mixing of cement slurry
2. Slurry poured into the borehole
3. Fixing clamp on pulled out temporary
4. Removal of temporary casing from he
casings
well
5. Well casing equipped with temporary well cap
Source: JICA’s Water Supply Project in Swaziland
Figure 38 Work Procedure of Surface Cementing
78
DDCAP Technical Manual for Drilling Works
For Technical Support Plan for the Drillers in DDCA
8 PUMPING TEST (TA CODE 14)
8.1 PURPOSE AND METHODS OF PUMPING TEST (TA CODE 14-1)
8.1.1 PURPOSE OF PUMPING TEST
The capacity of well shall be measured by the pumping test. The pumping test is carried out by
installing electric submersible pump in a well.
The pumping test shall include the following components:
-
Preliminary pumping test
-
Step drawdown test
-
Constant discharge rate test
-
Recovery test
The purposes and methodology of each test are described below:
8.1.2 PRELIMINARY PUMPING TEST
Preliminary Pumping Test is carried out to grasp the
rough estimation of well yield. It is conducted
generally for the period of 2 to 4 hours by varying
the discharge rate.
From the results of the
preliminary pumping test, the schedule of the step
draw down test is planned.
8.1.3 STEP DRAWDOWN PUMPING TEST
In Tanzania, the step drawdown test with three (3) to
five (5) steps of two (2) hours is conducted. Figure
39 shows an examples of t-dwl (time-dynamic water
level) curve of the step drawdown test.
From the results of step drawdown test, the well loss
Figure 39 Example of Results of Step
can be calculated approximately by the following
Drawdown Tests (t-dwl curve)
quotation:
Swl=CQ2
Swl: well loss (m)
C: well loss constant, (h2/m5)
Q: discharge rate (m3/h)
Well loss constant C indicates the resistance of well
structure against water flow from the aquifer. If the
screen or neighbouring aquifer is clogged, C will show
the elevation.
Drillers can detect the clogging of screen by comparing
current C and the past one, if they can obtained the past
step drawdown test data.
Figure 40 shows the plotting of discharge rate and
drawdown on Log-Log paper (Q-s curve). From this
chart, the maximu discharge rate can be estimated.
Figure 40 Example of Results of Step
Because of transition from laminar flow to turbulent
Drawdown Tests (Q-s curve)
79
DDCAP Technical Manual for Drilling Works
For Technical Support Plan for the Drillers in DDCA
flow depending on the flow velocity, drawdown suddenly increases from certain value. This
discharge rate of the transition is often used as maximum discharge rate. The excessive pumping
over this maximum discharge rate may be the cause of the lowering of water level of a well.
The results of the step drawdown test is used for the decision of the discharge rate of the constant
discharge rate test.
8.1.4 CONSTANT RATE PUMPING TEST
Figure 41 shows the example result of constant
discharge rate test and the following recovery test.
The constant discharge rate test is often omitted for
the purpose of well investigation. The major
purpose of this test is, to verify if a well shows the
same capacity as the analysed discharge rate from
step drawdown test for longer pumping period.
In general, 24 to 48 hours pumping for piped water schemes and 8 to 12 hours for handpump well
is applied for constant discharge rate. However,
more pumping time may be applied for wells of
Figure 41 Example of Results of Step
large-scale water supply schemes.
Drawdown Tests and Recovery Test (t-s
The hydraulic coefficients such as transmissivity,
curve)
storage coefficients etc., can be analyzed from the
results from the constant discharge rate test and recovery test.
It is preferable to conduct constant discharge rate test even if it is for the well investigation.
8.1.5 RECOVERY TEST
The recovery test is continuously conducted immediately after the termination of the constant
discharge rate test. Figure 41 shows the examples of the plotting of time and dynamic water level
(t-dwl curve) of a recovery test together with a constant discharge rate test. This test is to know
how fast the dynamic water level is recovered to static water level. The recovered water level is
an important factor to formulate the daily pump operation plan and also important to detect the
deterioration of well.
80
DDCAP Technical Manual for Drilling Works
For Technical Support Plan for the Drillers in DDCA
8.2 PUMPING TEST EQUIPMENT (TA CODE 14-2)
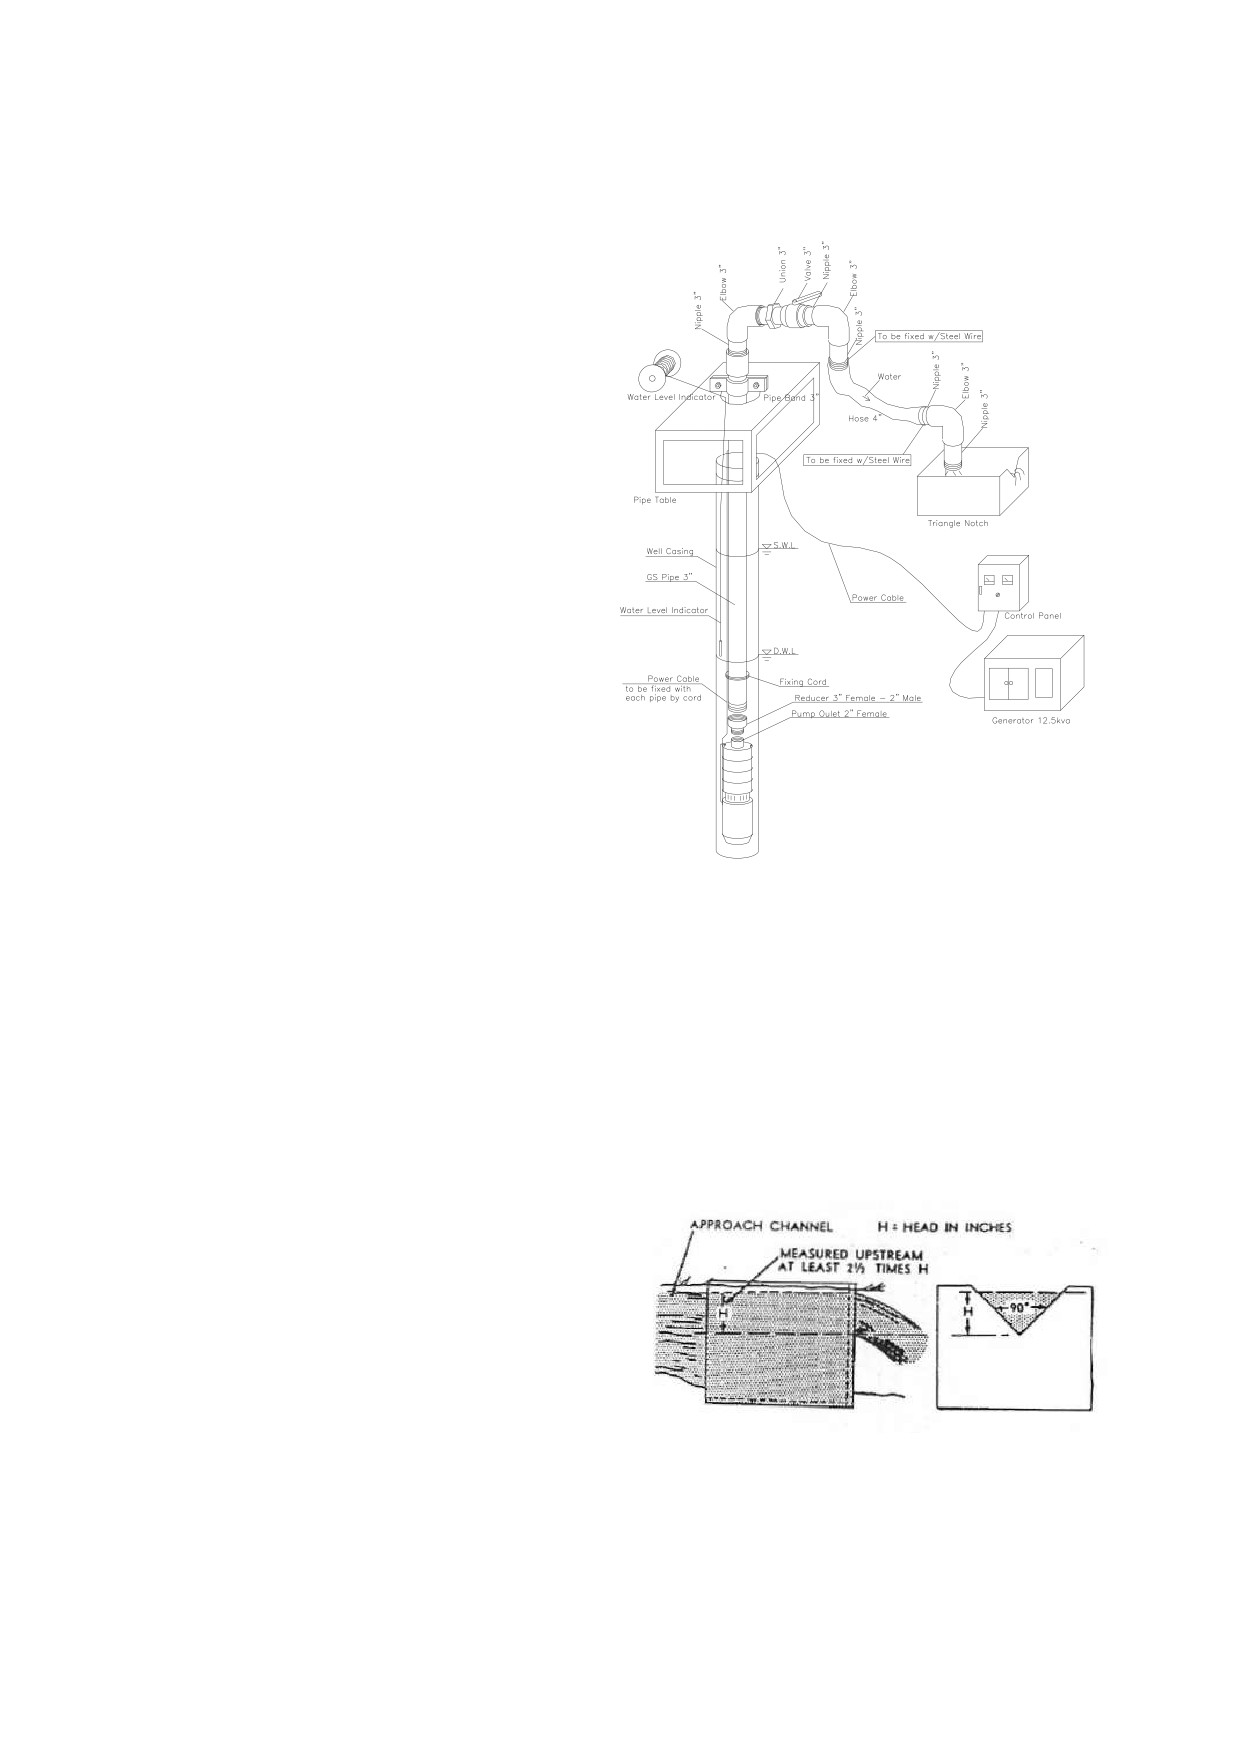
Figure
42 shows the standard setting of
pumping test equipment. Major equipment
necessary to conduct the pumping test is
described below:
8.2.1 SUBMERSIBLE PUMP
Sumbmersible pump is the most important
components of pumping test equipment.
Various types and capacities of pumps are
manufactured by many manufacturers. A
pump consists of pump parts of multi-stage
impellers and casings and submersible
motors. The sumbmersible motor is of
three phases power of 200 or 400 V or single
phase of
200 V. They are classified by
diameters of casings which they are to be
applied. Each pump has a range of the total
head and discharge rate. The pump is
connected to the generator on the ground by
submersible cables. Two-cores single cable
is used for single phase pump. Three-cores
single cable and three-cores double cables
are respectively used for the starting methods
of direct start and star-delta start for three
phases pumps.
Figure 42 Standard Setting of Pumping
8.2.2 CONTROL PANEL
Test Instruments
The control panel is an important instrument
to control the pump. It is connected between the pump and the generator. It consists of the
electrical circuit for on/off operation, safety cut/off for the over/under voltage and current,
operation control by water level, pressure etc. The knowledge and skills of the operation and
maintenance of the control panel is important for the drillers in charge of pumping test.
8.2.3 RISER PIPE
Riser pipes are threaded or franged pipes which conducts water from the pump to the ground or to
the water tank. In general galvanized steel 1-1/2” to 6” pipes are used. For the permanent
setting purpose, stainless riser pipes are used, too, as they are anticorrosive.
8.2.4 PUMP HEAD MANIHOLD
The pump head manihold consists of small pipes,
elbows, reducers, valves, pressure gauges,
air-release valve etc.
This is important
component to conduct proper control of the
discharge rate for the test measurement.
8.2.5 NOTCH TANK
Source: Australian Drilling Industry Training Committee Ltd
The discharge rate shall be correctly measured.
For large discharge rate, the notch tank is used.
Figure 43 Structure of Notch Tank
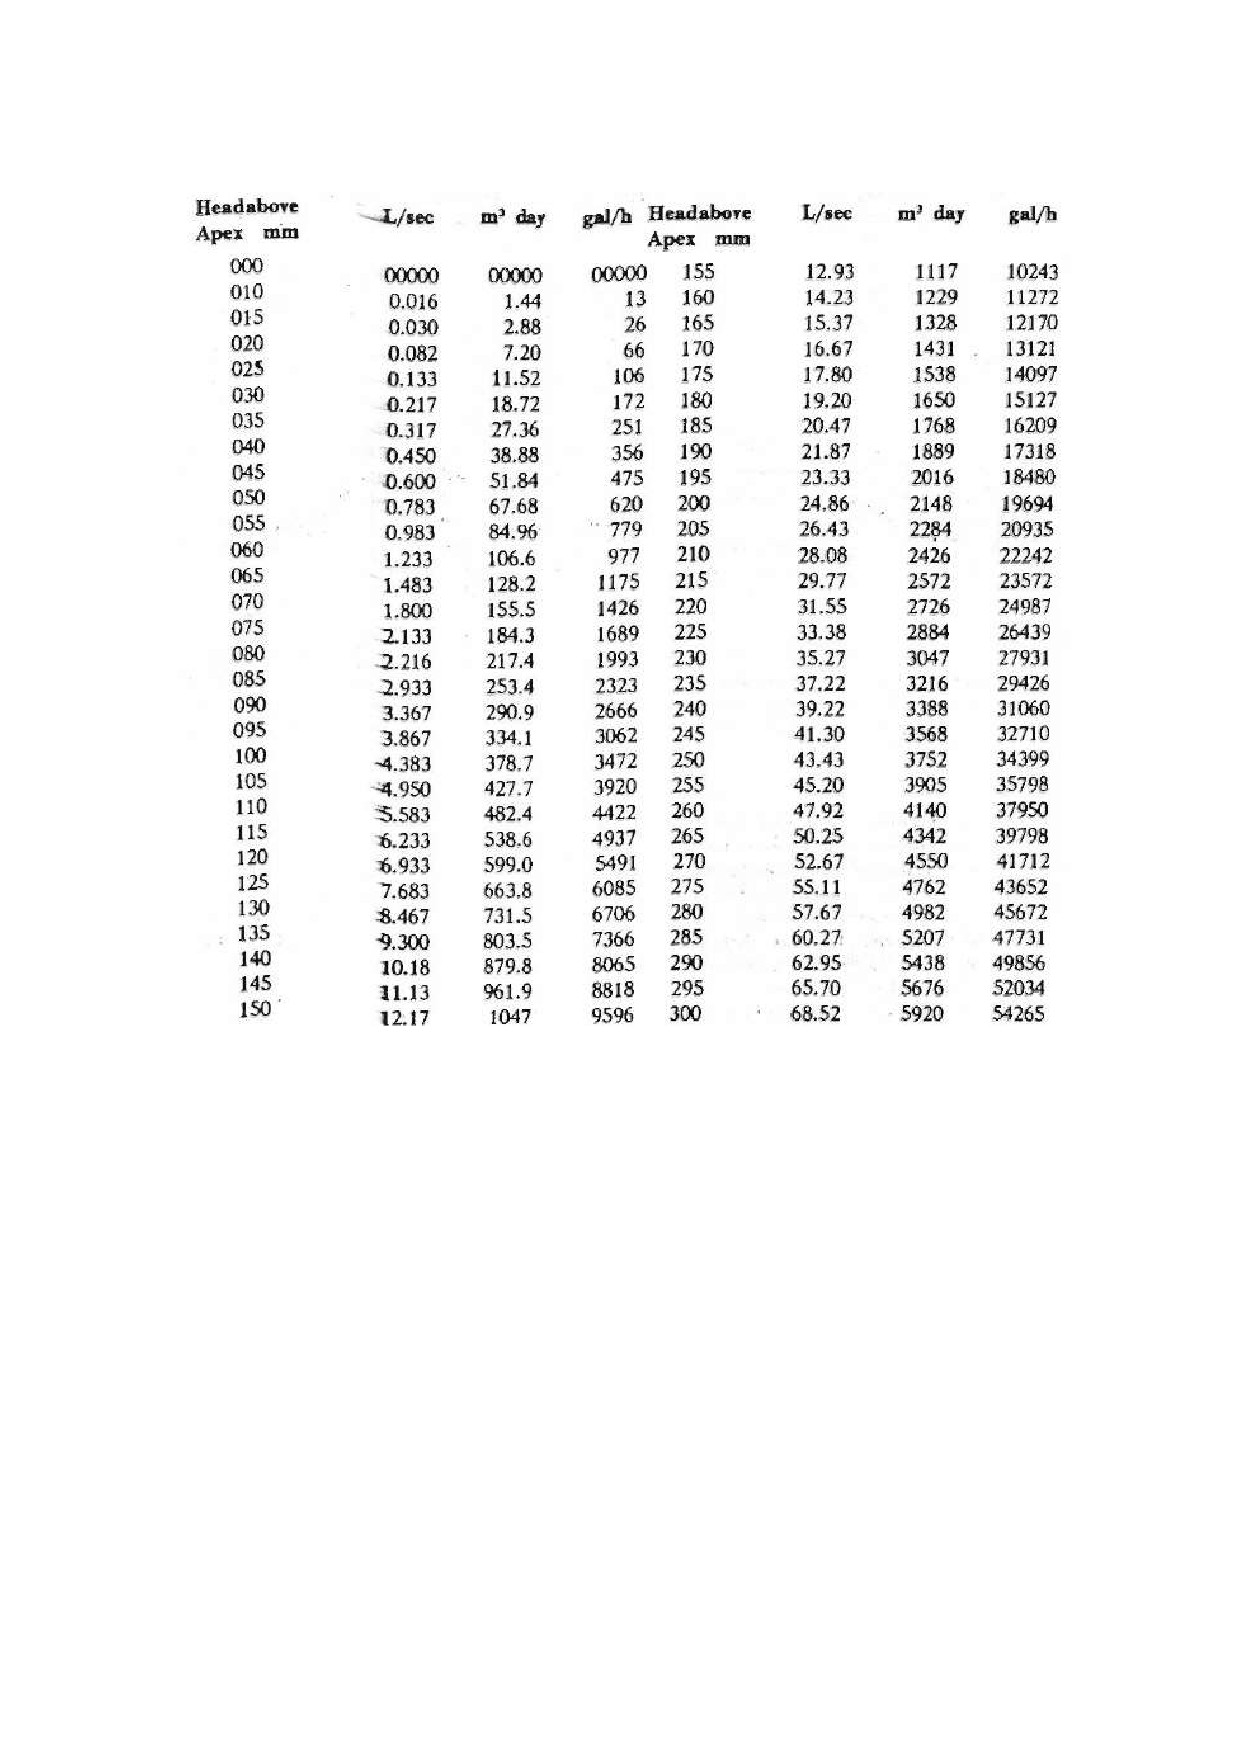
The discharge rate is calculated from the
measured height of overflow from the weir(Figure 43). Table 34 shows the conversion table
from the measured height to the discharge rate.
81
DDCAP Technical Manual for Drilling Works
For Technical Support Plan for the Drillers in DDCA
Table 34 Conversion Table of Discharge Rate for 90 Deg. Notch Tank
A bucket is used for the measurement of small discharge rate. In this case, the usual confirmation
of the volume of the bucket with the standard is important, so as not to prevent from the wrong
measurement.
8.2.6 WATER LEVEL INDICATOR
The water level indicator consists of electric sensor which detect the water level by transmission of
current through the water. The sensor is connected to the alarming device with buzzar or light by
the two-cores cable with the depth measure. In order to conduct a smooth measurement, 1” PVC
pipes are installed with the riser pipes to ensure the path of the sensor down to the water level.
82
DDCAP Technical Manual for Drilling Works
For Technical Support Plan for the Drillers in DDCA
8.3 SELECTION OF SUBMERSIBLE PUMP (TA CODE 14-3)
8.3.1 PUMP SPECIFICATIONS
Drillers in charge of the pumping test shall be acquired the proper knowledge of the submersible
pump for the selection of the suitable for each test. Principally, pump shall be selected according
to the discharge rate and the total head. Table 35 shows the specifications of the series of
submersible pump of SP17 manufacture by GRUNDFOS.
“17” of “SP17-10” means it is
designed for pumping of 17 m3/h of discharge rate.
“10” is the number of stages of impeller.
More number of stages produces hiegher pressure and needs more power. An option of ppower
supply can be selected from voltages of 230 V or 400 V and from single phase or three phases.
Diameter of the pump is important as well. The selected pump shall be of the diameter which can
be smoothly installed into the casing pipes of the well, with the consideration of power cables.
8.3.2 PUMP CAPACITY CURVE AND SELECTION OF SUBMESIBLE PUMP
Figure 44 shows an example of the calculation of total head. In this example, the pump transmits
the water of 10 m3/h up to the water tank of which the difference of the elevation down to the
dynamic water level of the well is 82.5 m. In order to decide the total head of the submersible
pump, head loss through the riser pipe and transmission pipe shall be calculated. The head loss of
each diameter of the pipe can be calculated by using the pressure loss nomogram (See Figure 45)
According to the nomogram, unit head loss for each diameter of the pipes for 10 m3/h are obtained
as follows:
2” GS:
0.0350 m/m
2-1/2” GS:
0.0182 m/m
3” GS
0.0048 m/m
If 50 m of 2”GS is used, the head loss is calculated as 0.0350 m/m x 50 m = 1.75 m. For the type
B in the example, 2” riser pipes and 3” transmission pipes are used. In this case the total head loss
is calculated to be 6.89 m. The difference of the elevation between the dynamic water level and
the tank is 82.5 m. Therefore the necessary pump head is calculated as 6.89 m + 82. 50 m = 89.39
m. Consequently the submersible pump with the discharge rate not less than 10 m3/h and the total
head not less than 89.39 m shall be selected.
Figure 46 shows the pump capacity curve of SP17 series submersible pumps. The suitable pump
can be selected by using the pump capacity curve according to the discharge rate and the total head.
From these examinations, the submersible pump SP17-9 was selected.
83
DDCAP Technical Manual for Drilling Works
For Technical Support Plan for the Drillers in DDCA
8.4 INTERPRETATION OF TEST RESULTS (TA CODE 14-4)
8.4.1 RECORD OF PUMPING TEST
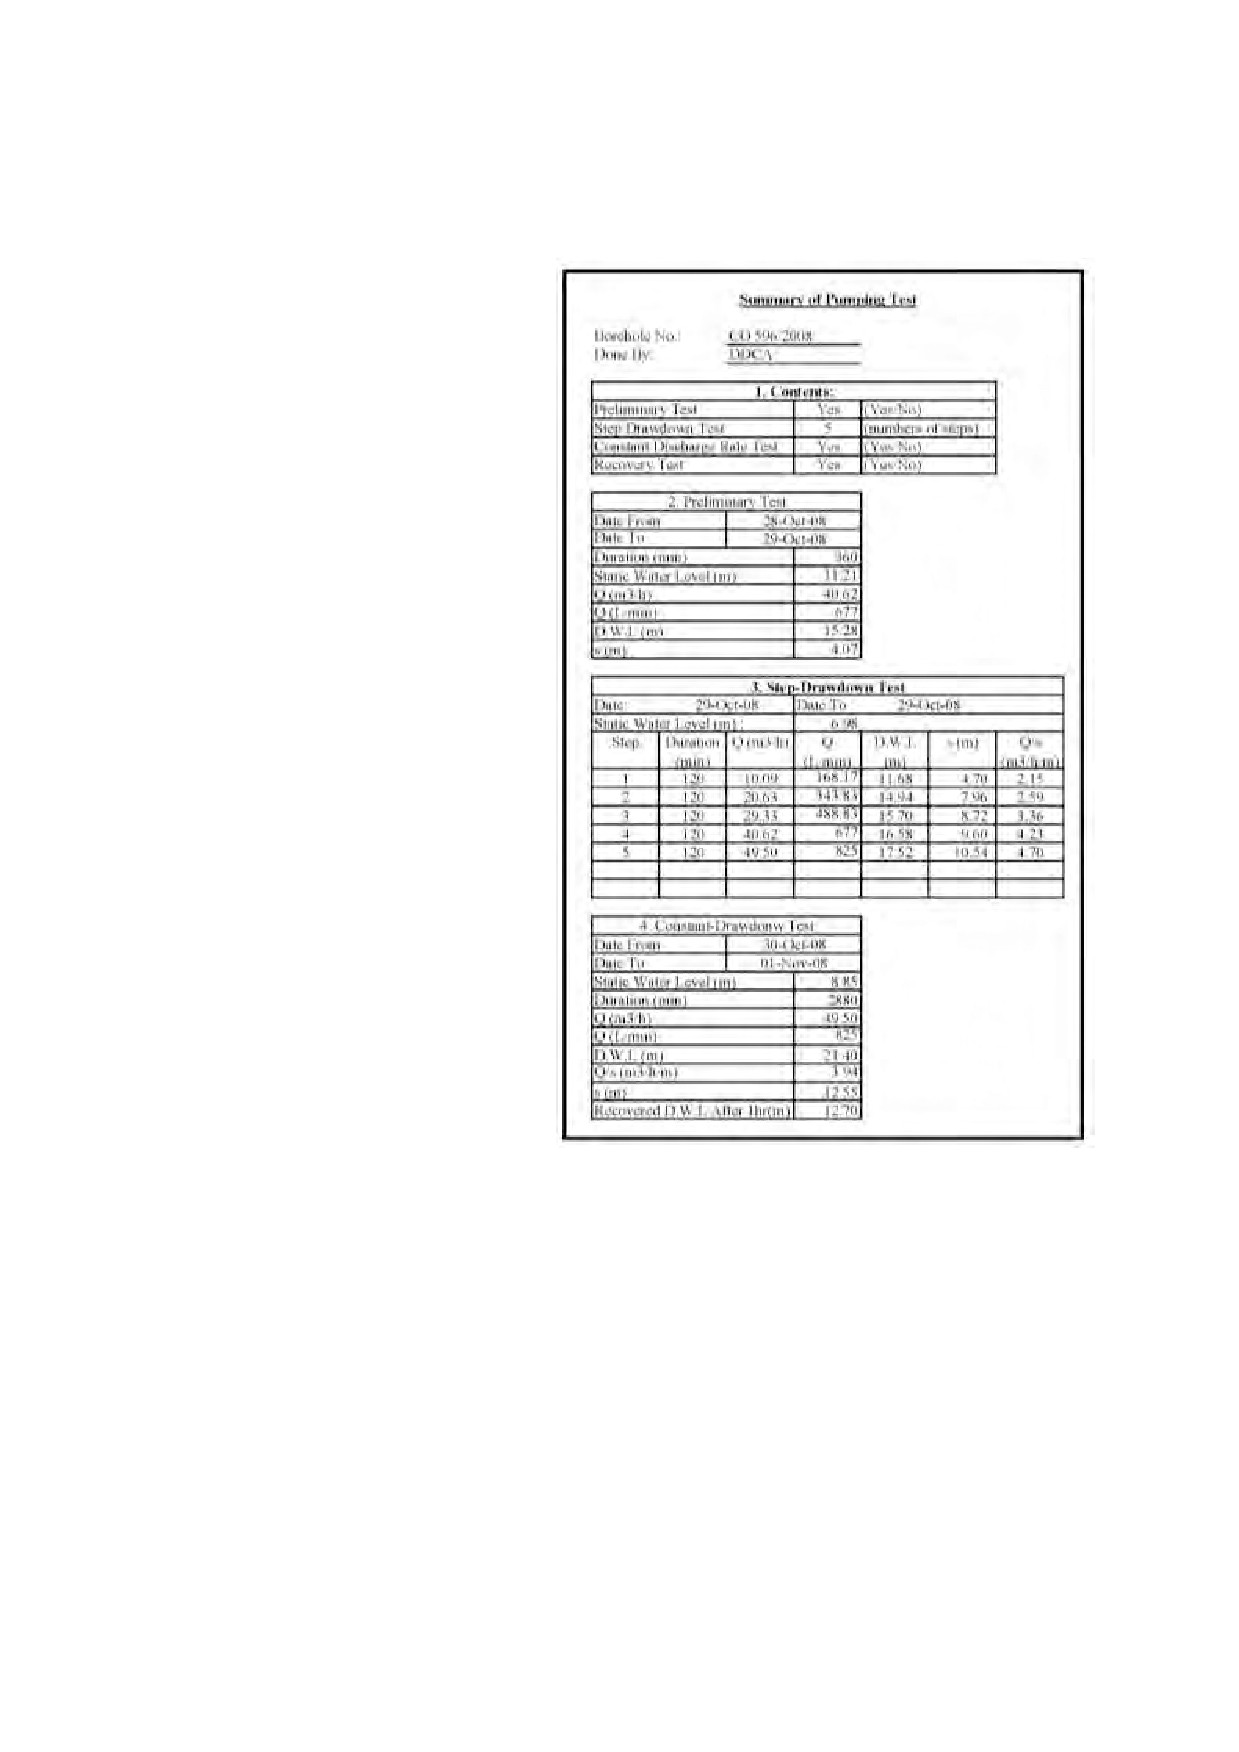
DDCA normally conducts the constant
discharge rate pumping test and the
recovery test after the completion of
the drilling works.
The step
drawdown tests are conducted when
the client specially requests. Figure
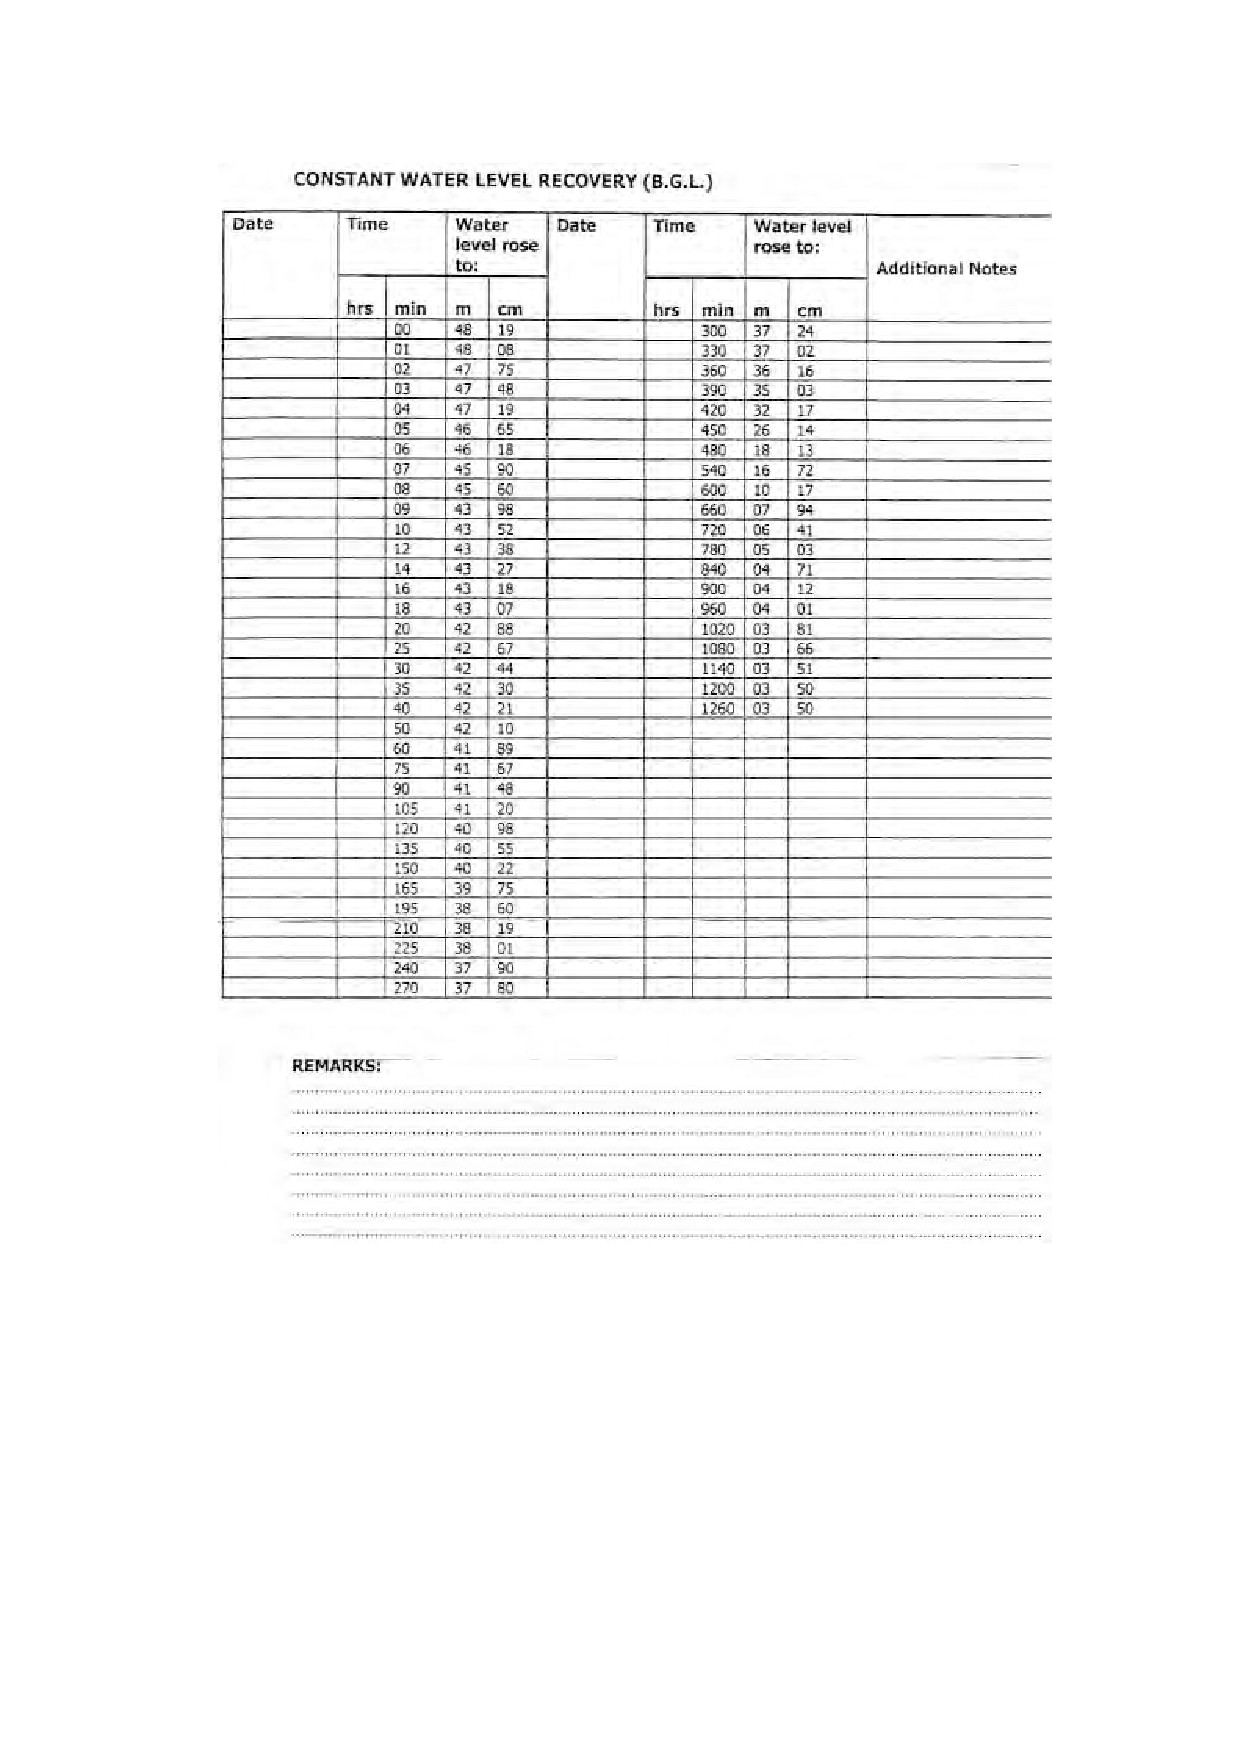
48 is the DDCA’s record form for the
constant discharge rate test and Figure
49 is the one for the recovery test. A
challenge related to the pumping test
records of DDCA is that the summary
of the pumping test including the
preliminary pumping test, step
drawdown pumping test, constant
discharge rate pumping test and
recovery test is not included in the
record forms. This series of test shall
be summarized as the example shown
in Figure 47.
Figure 47 Example of Form of Summary of
Pumping Test
88
DDCAP Technical Manual for Drilling Works
For Technical Support Plan for the Drillers in DDCA
Figure 49 DDCA’s Record Form of Recovery Test
8.4.2 INTERPRETATION OF PUMPING TEST RESULTS
There are various interpretation methos of pumping test. They are categorized in two major
methods of non-equilibrium method and equilibrium method. The equilibrium methods are used
to calculate the hydraulic coefficients of aquifer such as transmissivity, storage coefficient etc.
These methods are based on Theis’ formula. The non-equilibrium methods are used to calculate
the well capacities and efficiency by calculating the parameters such as well loss and aquifer loss
coefficient, specific capacity.
This section describes the simplified non-equilibrium method to determine the recommended
discharge rate of the well to decide the pump capacity and position. This is one of practical
90
DDCAP Technical Manual for Drilling Works
For Technical Support Plan for the Drillers in DDCA
interpretation methods for drillers. An example of the pumping test data and intrpreptation are
given in Figure 50 to Figure 53. The data of well is as follows:
Completion Date
14-Oct-08
Well No.
CO 596/2008
Borehole No.
MKR-2-BH2
Pumping Test No.
PT-025
Village
Mwandege
Region
COAST
Contractor
DDCA
Static Water Level (m)
1.3
Blown Yield (m3/h)
4.2
Screen Position (m-m)
55.35-61.10, 69.68-72.54
Casing Depth (m)
76
Date of Step Drawdown Test
From
17-Oct-08
To
18-Oct-08
Date of Constant Discharge Rate Test
From
19-Oct-08
To
20-Oct-08
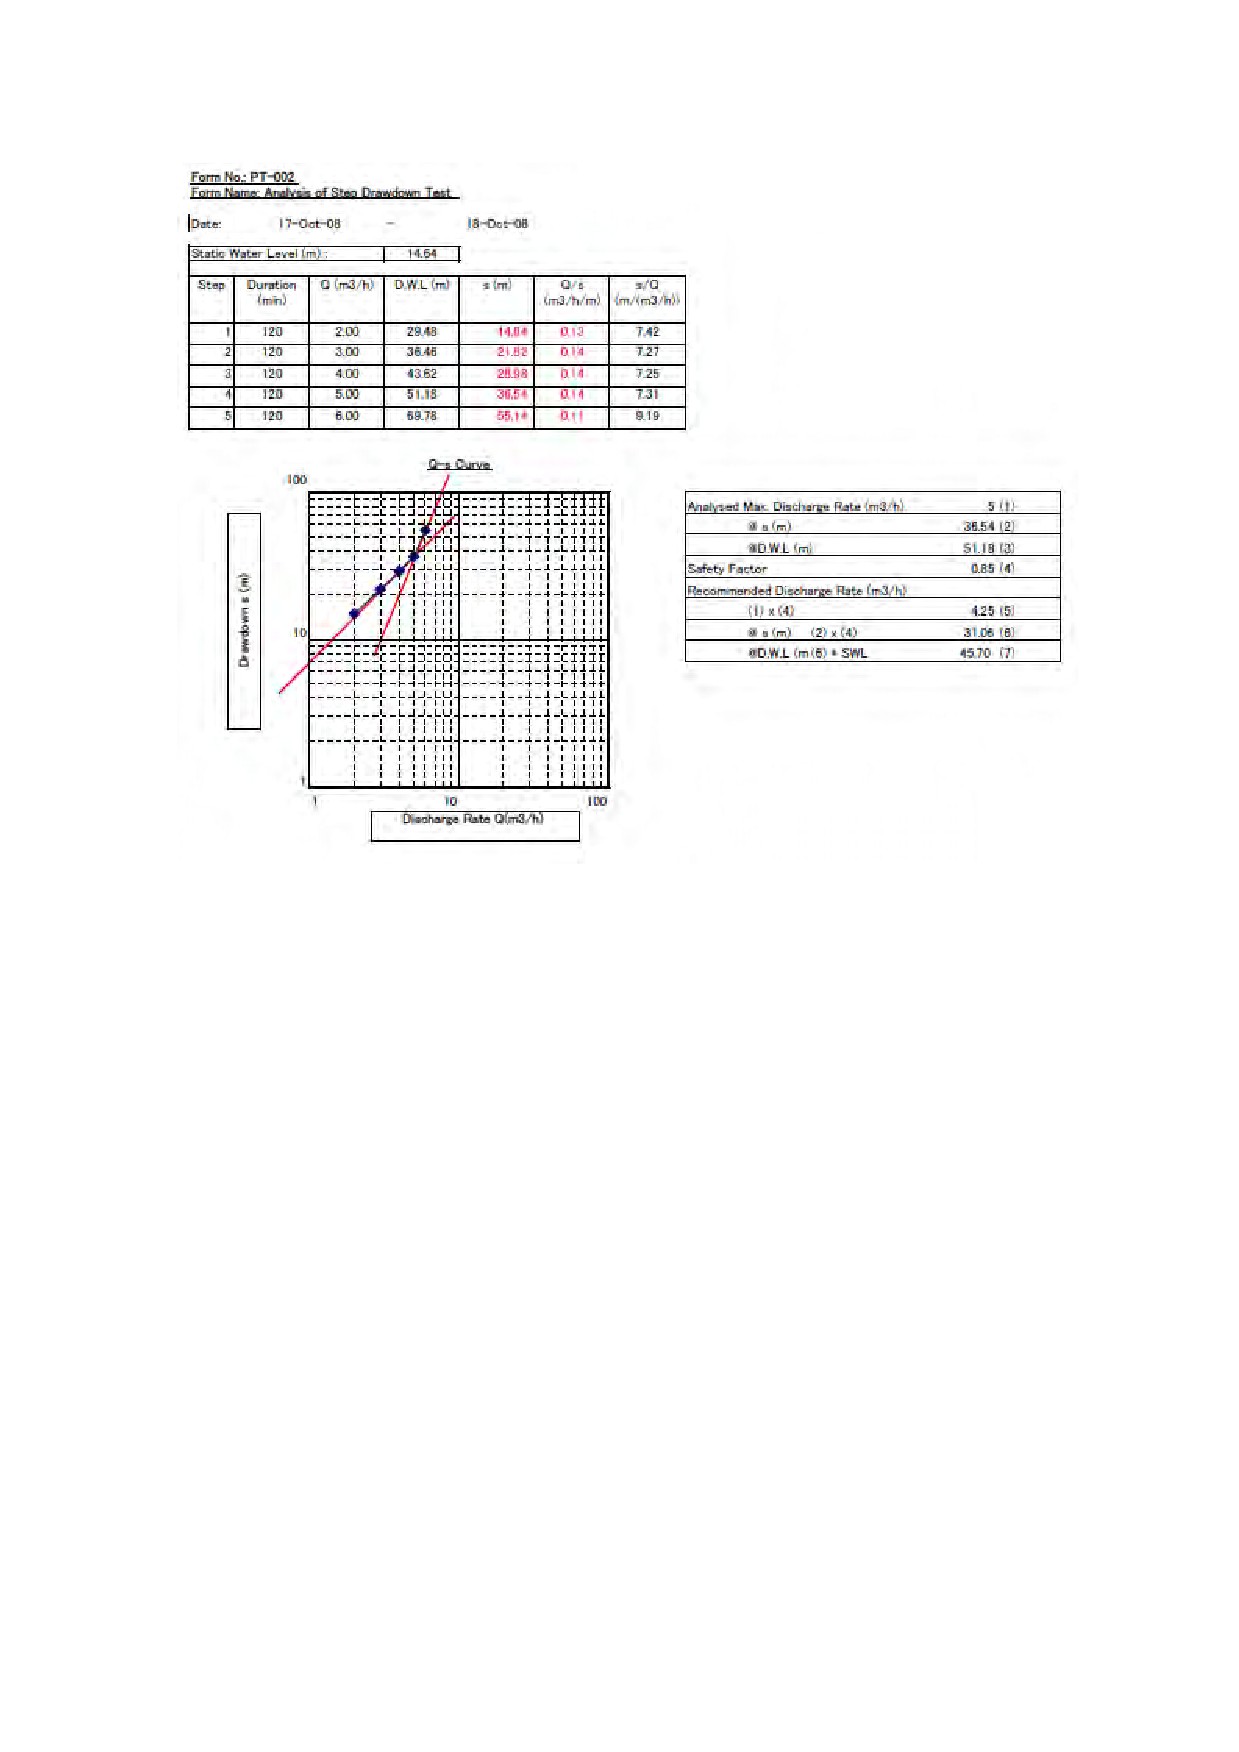
From the results of the step drawdown test, discharge rate, dynamic water level, drawdown and s/Q
are summarized and Q-s curve is plotted as shown in Figure 52. Then the recommended
discharge rate is determined from the Q-s curve as to be 4.25 m3/h with the consideration of safety
factor of 0.85. Accordingly, dynamic water level is estimated to be 45.70 m. The pump setting
depth can be determined from this dynamic water level and several meters for seasonal fluctuation.
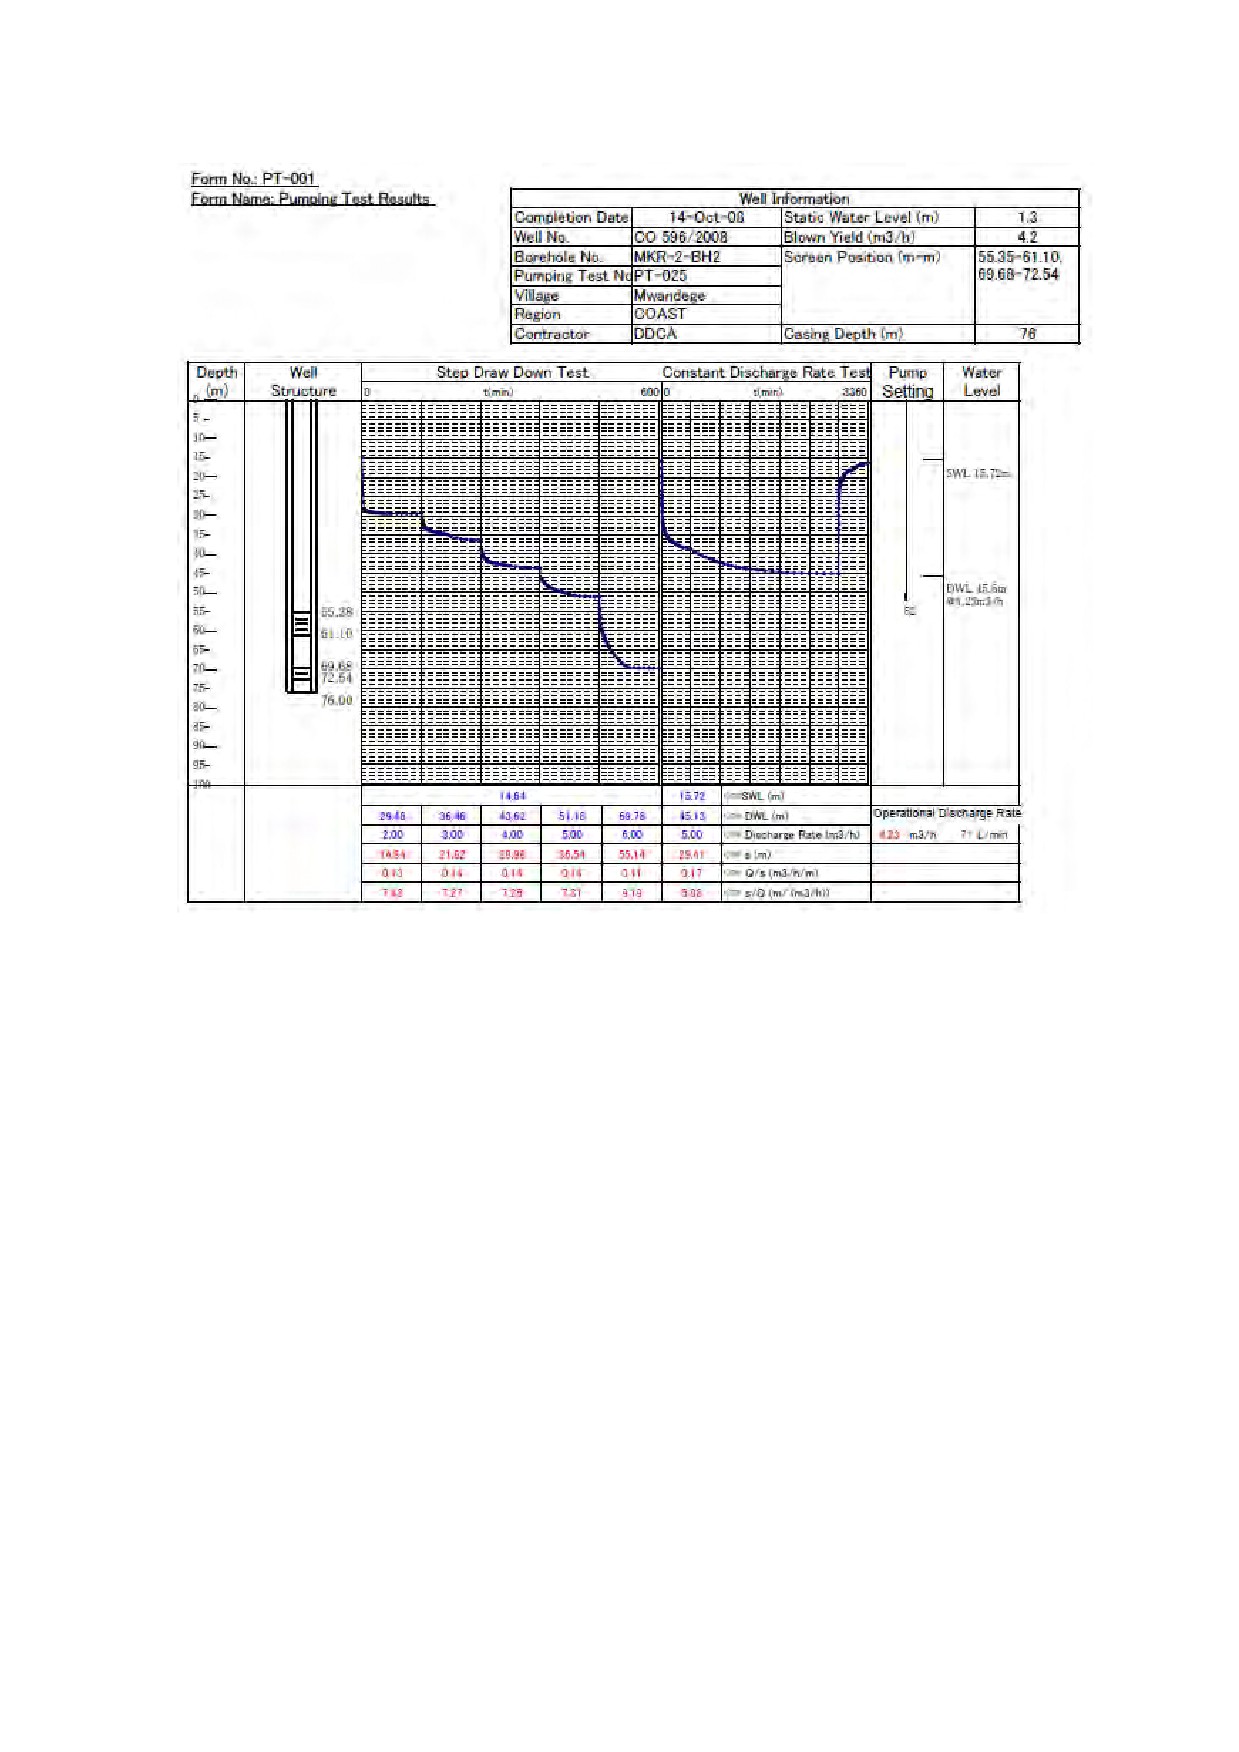
All the pumping test results, interpretation and pump setting plan are summarized as shown in
Figure 53.
91
DDCAP Technical Manual for Drilling Works
For Technical Support Plan for the Drillers in DDCA
Figure 52 Example of Interpretation of Step Drawdown Test
93
DDCAP Technical Manual for Drilling Works
For Technical Support Plan for the Drillers in DDCA
Figure 53 Summary Report of Pumping Test Result and Pump Installation Plan
94

DDCAP Technical Manual for Drilling Works
For Technical Support Plan for the Drillers in DDCA
9 WATER QUALITY (TA CODE 15)
9.1 PURPOSE OF WATER QUALITY ANALYSIS (TA CODE 15-1)
9.1.1 IMPORTANCE OFSAFE WATER QUALITY
Access to safe drinking-water is important for health, basic human right and development at
national, regional and local levels.
In some areas, it has been found that investments in water
supply can support a net economic benefit such as reductions in adverse health effects and
health-care costs outweigh the costs of undertaking the interventions.
It has also shown that the
improvement of access to safe water confers benefits to the poor in particular, whether in rural or
urban areas, and can be an effective part of poverty alleviation strategies.
According to above aspects, water quality analysis is required to be confirmed not only at drilling
but also at rehabilitation.
9.1.2 WATER QUALITY PARAMETERS
Table 36 and lists suggesting water parameter to be analised in Tanzania, pollution sources and
effects respectively.
Categories of the tableare based on Tanzania Temporary Standards (TBS,
1974).
Table 36 Water Quality Parameters and each Pollition Sources and Effects
Name of
Pollution Source
No.
Symbol
Effects
Constituent
(Indicators)
Toxic
1
Lead
Pb
Rust of lead pipes
Health effects
2
Arsenic
As
Geological condition
Health effects
3
Selenium
Se
Geological condition
Health effects
Geological condition or effluents
4
Chromium
Cr
Health effects
from industries
5
Cyanide
Cn
Effluents from industries
Health effects
6
Cadmium
Cd
Effluents from industries
Health effects
7
Barium
Ba
Geological condition
Health effects
8
Mercury
Hg
Effluents from industries
Health effects
9
Silver
Ag
Geological condition
Not specified
Affecting Human Health
1
Fluoride
F
Geological condition
Tooth decay and fluorosis
Fertilizers, sewage, faeces or
Cause of hemoglobinemia (blue
2
Nitrate
NO3
decaying organic matters
babies) and support algae growth
(Fertilizers, sewage, faeces or
Cause of hemoglobinemia (blue
3
Nitrite
NO2
decaying organic matters)
babies) and support algae growth
Organoleptic
1
Color
Metals or organic matters
Appearance
2
Turbidity
Soil particles
Appearance
Geological condition, seawater,
3
Taste
effluents from industries or algae
Taste
growth
Sewage, effluents from
4
Odor
Odour
industries or algae growth
Salinity and Hardness
Sewage, effluents from
5
pH
Attack metals (e. g. pipe rust)
industries or algae growth
Total
Filterable
Minerals from geological
6
Taste and appearance
Residue
condition and dissolved matters
7
Total Hardness
CaCO3
Geological condition
Taste and soap consuming
8
Calcium
Ca
Geological condition
Not specified
9
Magnesium
Mg
Geological condition
Not specified
Magnesium
+
Sewage, effluents from
10
Mg-Na2
Na: taste
Sodium sulphate
industries or seawater
95

DDCAP Technical Manual for Drilling Works
For Technical Support Plan for the Drillers in DDCA
Name of
Pollution Source
No.
Symbol
Effects
Constituent
(Indicators)
Geological condition or effluents
11
Sulphate
SO4
Taste and smell
from industries
Sewage, effluents from
12
Chloride
Cl
industries, seawater or
Not specified
geological condition
Less-toxic Metals
13
Effluents from industries and
Iron
Fe
Taste and appearance
mining / Pipe or pump rusting
14
Manganese
Mn
Geological condition
Taste and appearance
15
Copper
Cu
Rust of copper pipes
Taste
16
Zinc
Zn
Geological condition or pipes
Taste and appearance
Organic Pollution of Natural Origin
17
Cause of water born diseases and
BODs( 5 days)
O2
Organic matters
decaying water
18
PV (Oxygen abs.
Cause of water born diseases and
O2
Organic matters
KMnO4)
decaying water
19
Cause of water born diseases and
Ammonium
NH3
Faeces
disinfectant consuming
20
Total
Nitrogen
Sewage or effluents from
Algae growth
Exclusive Nitrate
industries
Organic Pollution Introduced Artificially
21
Surfactants ABS
(Alkyl
Benxyl
Organic matters
Odour
Sulphonates)
22
Organic matter as
carbon
in
Organic matters
Cause of water borne diseases
chloroform
extract)
23
Phenolic
substances
as
Effluents from industries
Health effects
phenol
Bacteriological
1
Coliform
count
Sewage
Cause of water borne diseases
per 100ml at 37℃
2
E. coli count per
Faeces
Cause of water borne diseases
100ml at 44℃
Source: Guideline for Drinking-water quality (WHO, 2004) and Tanzania temporary standards (TBS, 1974)
96
DDCAP Technical Manual for Drilling Works
For Technical Support Plan for the Drillers in DDCA
9.2 ITEM OF WATER QUALITY ANALYIS (TA CODE 15-2)
9.2.1 GUIDELINE/STANDARD OF WATER QUALITY
There are two types of guideline for drinking-watre in Tanzania; Guideline for Drinking-water
Quality (WHO, 2004) and Tanzania temporary standards (TTS) (TBS, 1974). WHO guideline is
for urban water suppies and large water supplies, and TTS is for domestic water supplies and small
rural water supplries.
Therefore, is is necessary to instruct which guideline/standard is adopt for
water at drilled boreholes to customers and laboratories.
9.2.2 PARAMETERS OF WATER QUALITY ANALYSIS
Table 37 lists WHO guideline and TTS values, and drinking water quality should be less than the
valuses in both Tables.
Table 37 Values of WHO Guideline and TTS
No.
Name of Constituent
Symbol
Units
WHO guideline
TTS
Toxic
1
Lead
Pb
mg/l
0. 01
0. 01
2
Arsenic
As
mg/l
0. 01
0. 05
3
Selenium
Se
mg/l
0. 01
0. 05
4
Chromium
Cr
mg/l
0. 05
0. 05
5
Cyanide
Cn
mg/l
0. 07
0. 20
6
Cadmium
Cd
mg/l
0. 003
0. 05
7
Barium
Ba
mg/l
0. 7
1. 00
8
Mercury
Hg
mg/l
0. 001
0. 001
9
Silver
Ag
mg/l
Not mentioned
Not mentioned
Affecting Human Health
1
Fluoride
F
mg/l
1. 5
1. 5 - 4. 0
2
Nitrate
NO3
mg/l
50
10 - 75
3
Nitrite
NO2
mg/l
3
Not mentioned
Organoleptic
1
Color
mg/l
15 TCU
15 - 50
2
Turbidity
mg/l
5 NTU
5 - 25
3
Taste
-
Not objectionable
Not objectionable
4
Odor
-
Not objectionable
Not objectionable
Salinity and Hardness
5
pH
6. 5-8. 5/9. 5
6. 5 - 9. 2
6
Total Filterable Residue
mg/l
1500
2000
7
Total Hardness
CaCO3
mg/l
Not mentioned
600
8
Calcium
Ca
mg/l
200
Not mentioned
9
Magnesium
Mg
mg/l
150
Not mentioned
10
Magnesium + Sodium sulphate
Mg-Na2
mg/l
-
Not mentioned
11
Sulphate
SO4
mg/l
400
600
12
Chloride
Cl
mg/l
600
800
Less-toxic Metals
13
Iron
Fe
mg/l
1
1
14
Manganese
Mn
mg/l
0. 4
1. 5
15
Copper
Cu
mg/l
2
3. 0
16
Zinc
Zn
mg/l
15
15
Organic Pollution of Natural Origin
17
BODs( 5 days)
O2
mg/l
6. 0
6. 0
18
PV (Oxygen abs. KMnO4)
O2
mg/l
10
20
19
Ammonium
NH3
mg/l
0. 5
Not mentioned
20
Total Nitrogen Exclusive Nitrate
mg/l
0. 1
1
Organic Pollution Introduced Artificially
21
Surfactants ABS
mg/l
1
2
(Alkyl Benxyl Sulphonates)
22
Organic matter as carbon in
mg/l
0. 2
0. 5
97

DDCAP Technical Manual for Drilling Works
For Technical Support Plan for the Drillers in DDCA
No.
Name of Constituent
Symbol
Units
WHO guideline
TTS
chloroform extract)
23
Phenolic substances as phenol
mg/l
0. 001
0. 002
Bactriological
1
Coliform count per
100ml at
Acceptable
Allowable
-
-
1-3
37℃
-
1-3
2
E. coli count per 100ml at 44℃
-
-
Nil
Nil
Source: Guideline for Drinking-water quality (WHO, 2004) and Tanzania temporary standards (TBS, 1974)
9.2.3 TIMING OF WATER ANALYSIS
Water is analysed after pumping tests
(after water become likely clean) and rehabilitations.
Moreover, regular water analysis is needed for both rural water supply and urban water supply in
order to ensure safe drinking-water in boreholes.
Therefore, DDCA should advise to customers
to analyse water regularly.
Table 38 and Table 39 respectively show frequency of sampling for
rural water supply and urban water supply.
Table 38 Frequency of Sampling for Rural Water Supply
Type of Source/Population served
Up to 1,000
Up to 2,000
Up to 5,000
Borehole deeper than 8m
6 months
4 months
3 months
Source: National Environmental Standards Compendium (TBS, 2003)
Table 39 Frequency of Sampling for Urban Water Supply
Max interval between successive
Minimum number of samples to be
Population served
samples
taken from whole distribution
Less than 20,000
1 month
20,000 - 50,000
2 weeks
1 sample / 5,000 people / month
50,000 - 100,000
4 days
More than 100,000
1 day
1 sample / 10,000 people / month
Source: Design Manual for Water Supply and Wastewater Disposal (MoWI, 2009)
9.2.4 SAMPLING AND TRANSPORTATION METHODS
Sampling is a very important process in order to get the true value of water quality.
Therefore,
following processes are required for sampling.
To clean the working
To wash hands
To avoid dust and draughts in the working area
To use clean and dry containers washed by proper methods
- those rinced by distilled water for general parameters
- those sterilized by ethanol etc. for bacteriological parameters
- those washed by solution of hydrochloric acid and rinced by distilled water for heavy
metals
To rinse containers three times by water sample if they are wet by a different water sample
To sterilize an intake of a tap or a pump by ethanol or fire in order to sterilize and to prevent
biological contamination
To avoid touching any part of the container dishes and sampler
To keep samples cold
98
DDCAP Technical Manual for Drilling Works
For Technical Support Plan for the Drillers in DDCA
To transfer samples within 24 hours to a laboratory
9.2.5 OTHER NOTIFICATION
The followings are also important for water analysis implemented at sites.
To adequately calibulate equipment before analysis such as pH meter and conductivity
mether
To turn off equipment if they are not utilized for a while.
99
Drilling and Dam Construction Agency (DDCA)
Japan International Cooperation Agency (JICA)
DDCAP
Technical Manual for Tool Fishing
and Well Rehabilitation
for Technical Support Plan for the
Drillers in DDCA
Version 1
January 2013
Groundwater Development and Management Capacity Development (DDCAP)
Project
Contents
1 INTRODUCTION
1
12 TOOL FISHING (TA CODE 12)
3
12.1
Tool Fishing Plan (TA CODE 12-1)
3
12.2
Fishing Tools (TA CODE 12-2)
5
13 WELL REHABILITATION (TA Code 13)
7
13.1
Phenomenan and Causes of Well Deterioration (TA CODE 13-1)
7
13.2
Methods of Well Rehabilitation (TA CODE 13-2)
12
13.3
Usage of Well Camera (TA CODE 13-3)
16
Tables
Table 1 Identified Technical Areas Covering Drilling Works of DDCA
1
Table 2 Technical Area / Item Covered by Teaching Guidance and Manuals
1
Figures
Figure 1 Analysed Image of Fallen Material
3
Figure 2 Decision Tree of Fishing Tool Selection
4
Figure 3 Fishing Tools (1/2)
5
Figure 4 Fishing Tools (2/2)
6
Figure 5 Mechanical Cleaning (1/2)
13
Figure 6 Mechanical Cleaning (2/2)
13
Figure 7 Installation of Chemical Cleaning
14
Figure 8 Sedimentation Removal Method
15
Figure 9 Double-Casing Method
15
DDCAP Technical Manual for Tool Fishing and Well Rehabilitation
For Technical Support Plan for the Drillers in DDCA
1 INTRODUCTION
The baseline survey on DDCA’s drilling organization was conducted in the course of the Project,
for the purpose to reveal the current status of drilling works and the technical level of drillers in
DDCA. The results of the baseline survey were compiled in the Technical Support Plan for the
Drillers in DDCA (hereinafter referred to as “TSP”) which was formulated in January 2013. This
plan identified
15 technical areas which cover the drilling works of DDCA including eight
technical areas necessary to be enhanced and two new technical areas to be needed, as shown in
Table 1.
Table 1 Identified Technical Areas Covering Drilling Works of DDCA
New Areas
Areas to be
No.
Technical Area
All Areas
to be
Enhanced
Needed
1
Site Mobilization
✔
2
Drilling Tools and Equipment
✔
✔
3
Drilling Drawbacks
✔
4
Drilling Control
✔
✔
5
Borehole Logging
✔
✔
6
Casing Program / Installation
✔
7
Gravel Packing
✔
✔
8
Well Development
✔
✔
9
Back-Filling & Surface Cementing
✔
✔
10
Site Demobilization
✔
11
Well Investigation
✔
12
✔
13
✔
14
✔
15 Water Quality Analysis
✔
This Technical Manual for Tool Fishing and Well Rehabilitation was prepared according the TSP
and covers two new technical areas to be needed. This manual is expected to be utilized by the
senior drillrs in DDCA in order to acquire the necessary technical knowledge and the proper work
procedures. Furthermore, it forms a part of materials for the teaching guidance which is used for
the technical instruction to both private drillers and DDCA’s drillers. In the TSP, the technical
areas were further divided into details namely technical items. Technical areas and items are the
important basic units for the activities of technical training and guidance in the Project, in the
respects of the manual formulation, training plan, technical evaluation and so on. They are
commonly used between three major training related documents i.e. the Teaching Guidance, the
Manual for Drilling Works and the Manual for Well Rehabilitation and Tool Fishing, as shown in
Table 2.
Table 2 Technical Area / Item Covered by Teaching Guidance and Manuals
Manual for Well
Teaching
Manual for
TA Code
Technical Area / Item
Rehabilitation and
Guidance
Drilling Works
Tool Fishing
1
Site Mobilization
✔
1-1
Site Preparation and Drilling Machine Setting-Out
✔
2
Drilling Tools and Equipment
✔
✔
2-1
Selection of drilling bit and drilling method
✔
✔
2-2
Rotary Bits
✔
✔
2-3
DTH and DTH Bit
✔
✔
2-4
Rig Accessory
✔
✔
2-5
Casing Tools
✔
✔
2-6
Drilling Equipment
✔
✔
2-7
Drilling Calculation
✔
✔
2-8
Weight of drilling tools
✔
✔
2-9
Rotary bit rotation speed and weight on bit
✔
✔
2-10
DTH Bit rotation speed and weight on bit
✔
✔
1

DDCAP Technical Manual for Tool Fishing and Well Rehabilitation
For Technical Support Plan for the Drillers in DDCA
Manual for Well
Teaching
Manual for
TA Code
Technical Area / Item
Rehabilitation and
Guidance
Drilling Works
Tool Fishing
3
Drilling Drawbacks
✔
3-1
Countermeasures against lost circulation during mud
✔
drilling
3-2
Countermeasures against lost circulation during DTH
✔
drilling
3-3
Countermeasures against bore wall collapse during mud
✔
drilling
3-4
Countermeasures against bore wall collapse during DTH
✔
drilling
3-5
Countermeasures against jamming of drilling tools
✔
4
Drilling Control
✔
✔
4-1
Mud control
✔
✔
4-2
Mud Pump Operation
✔
✔
4-3
Casing for mud drilling
✔
✔
4-4
Drilling operation for mud drilling
✔
✔
4-5
Bit control and repairing for mud drilling
✔
✔
4-6
Air control for DTH drilling
✔
✔
4-7
Air compressor operation
✔
✔
4-8
Casing for DTH drilling
✔
✔
4-9
Drilling operation for DTH drilling
✔
✔
4-10
Bit control and repairing for DTH drilling
✔
✔
5
Borehole Logging
✔
✔
5-1
Borehole logging instruments
✔
✔
5-2
Interpretation of borehole logging results
✔
✔
6
Casing Program / Installation
✔
6-1
PVC casing, screen pipe
✔
6-2
Casing Program
✔
6-3
Role of centralizer
✔
6-4
Casing, screen pipe installation
✔
7
Gravel Packing
✔
✔
7-1
Determination of gravel size
✔
✔
7-2
Calculation of gravel volume
✔
✔
7-3
Gravel packing
✔
✔
8
Well Development
✔
✔
8-1
Well cleaning after drilling
✔
✔
8-2
Single-tube method air-lifting
✔
✔
8-3
Double-tube method air-lifting
✔
✔
9
Back-Filling & Surface Cementing
✔
✔
9-1
Back-filling
✔
✔
9-2
Surface cementing
✔
✔
10
Site Demobilization
✔
10-1
Precautions upon site demobilization
✔
11
Well Investigation
✔
11-1
Necessary information of well rehabilitation plan
✔
11-2
Well rehibilitation plan
✔
12
Tool Fishing
✔
✔
12-1
Tool fishing plan
✔
✔
12-2
Fishing tools
✔
✔
13
Well Rehabilitatation
✔
✔
13-1
Phenomenan and causes of well deterioration
✔
✔
13-2
Methods of well rehabilitation
✔
✔
13-3
Usage of well camera
✔
✔
14
Pumping Test
✔
✔
14-1
Purpose and methods of Pumping Test
✔
✔
14-2
Pumping test equipment
✔
✔
14-3
Selection of Submersible Pump
✔
✔
14-4
Interpretation of test results
✔
✔
15
Water Quality Analysis
✔
✔
15-1
Purpose of Water quality analysis
✔
✔
15-2
Item of water quality analysis
✔
✔
2

DDCAP Technical Manual for Tool Fishing and Well Rehabilitation
For Technical Support Plan for the Drillers in DDCA
12 TOOL FISHING (TA CODE 12)
12.1 TOOL FISHING PLAN (TA CODE 12-1)
For wells with fallen tools and/or materials which disturb the proper installation of alternative
pump, such obstacles in a well shall be at first removed from a well by “Tool Fishing”.
Prior to the formulation of tool fishing plan, the following preliminary investigation shall be
conducted:
12.1.1 DATA COLLECTION
Collection of well and water supply scheme.
Detailed specifications of fallen materials such as diameters, lengths, shape, materials.
If the fallen material is a pump, specifications of auxially tools such as riser pipes and cables
shall be obtained too.
The remaining parts of fallen materials are also the important information source. In case
the riser pipe of the pump is cut at certain point on the riser pipe, the length of the fallen
pump and riser pipes in the well can be calculated by measuring the remaining parts of the
riser main. Furthermore, the observation of the cut point is important to estimate the shape
of the top of the fallen riser pipe.
Well structure information such as depth, diameter, length, materials and whether or not
production hole is cased.
With the integral analysis of the above information, the proper tool fishing plan shall be prepared.
12.1.2 DOWN-HOLE INVESTIGATION
After the maximum efforts to collect the data, the
condition of the top of the fallen materials shall be
Borehole Dia. 12-1/4"
investigated by following measures:
Power Cable
3" Steel Riser Pipe w/ Socket
Confirm reachable depth by water level sensor
Water Level 28.5m
32.1m
Confirm reachable depth by pipes or rods
38.5m
Slot Screen
Run into the hole, investigating device such as
45.2m
Casing 49.3 m
plate with nails
8" Mild Steel
50m
Run into the hole, well camera
Fallen Pump
and Riser Pipes
From the collected data and the results of the above
down-hole investigation, the illustration of the
down-hole situation of the fallen material shall be drawn
Figure 1 Analysed Image of Fallen
up as shown in Figure 1 and suitable tool fishing plan
Material
shall be prepared.
12.1.3 WELL CLEANING
If a well is not cased, collapsed bore wall may be sedimented above and/or around fallen materials.
Prior to tool fishing works, such sedimentation shall be removed by the following measures:
(1) Removal of sedimentation above fallen material
Air-lifting, bailing, reaming with rotary bit etc are used.
(2) Removal of sedimentation around fallen material
Sedimentation shall be reamed by casing pipes. If the fallen material leans one side of the hole, it
must be straightened up using spud.
3
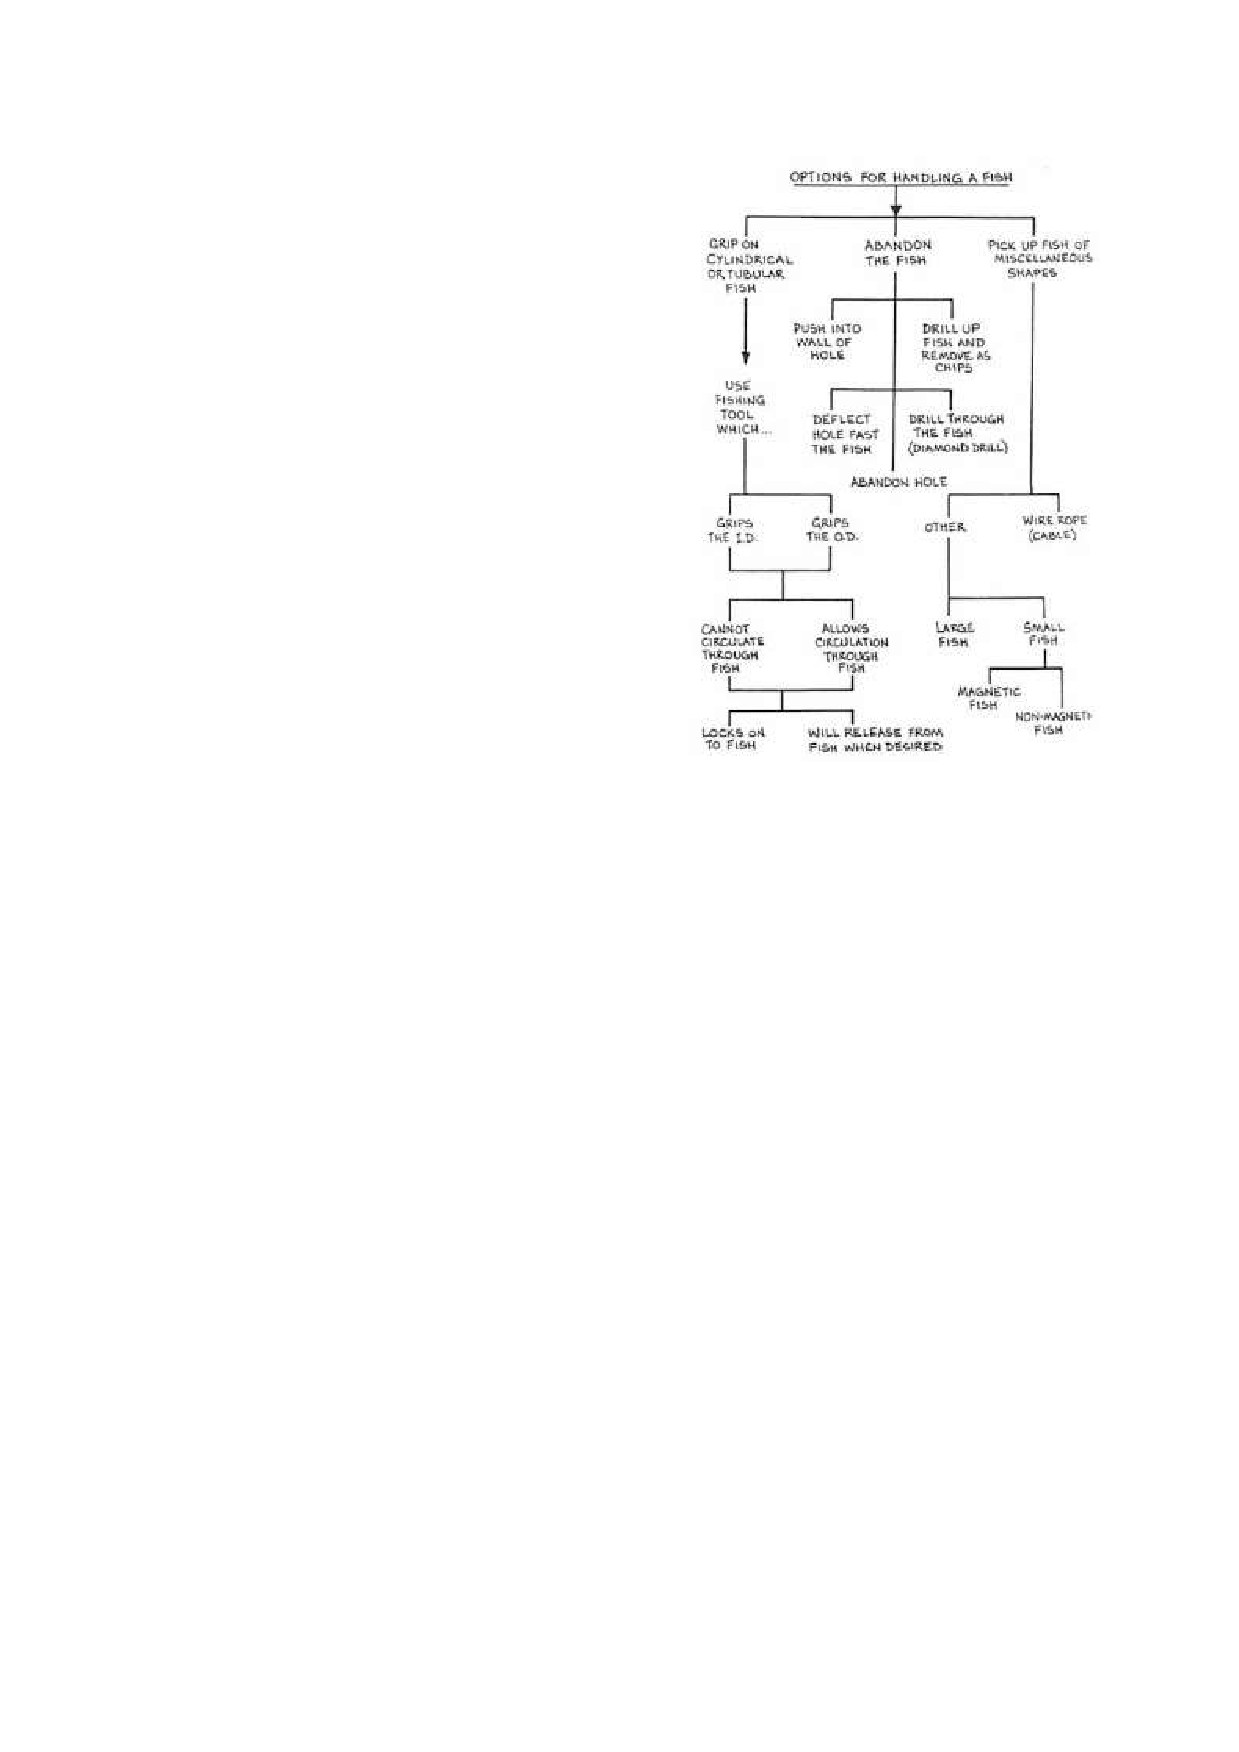
DDCAP Technical Manual for Tool Fishing and Well Rehabilitation
For Technical Support Plan for the Drillers in DDCA
12.1.3 FISHING PLAN
Based on the results of the data collection and the
down-hole investigation, the fishing plan shall be
planned. This plan shall include the necessary
equipment, tools, materials, consumables, work
procedures, staff organizations and so on. Proper
fishing art and tools shall be selected as well.
Figure 2 shows the decision tree of fishing tools.
Source: Australian Driling Industry Trining Committee
Figure 2 Decision Tree of Fishing
Tool Selection
4