HAMILTON-T1. Operator's Manual (2022) - page 4
7 Ventilation modes
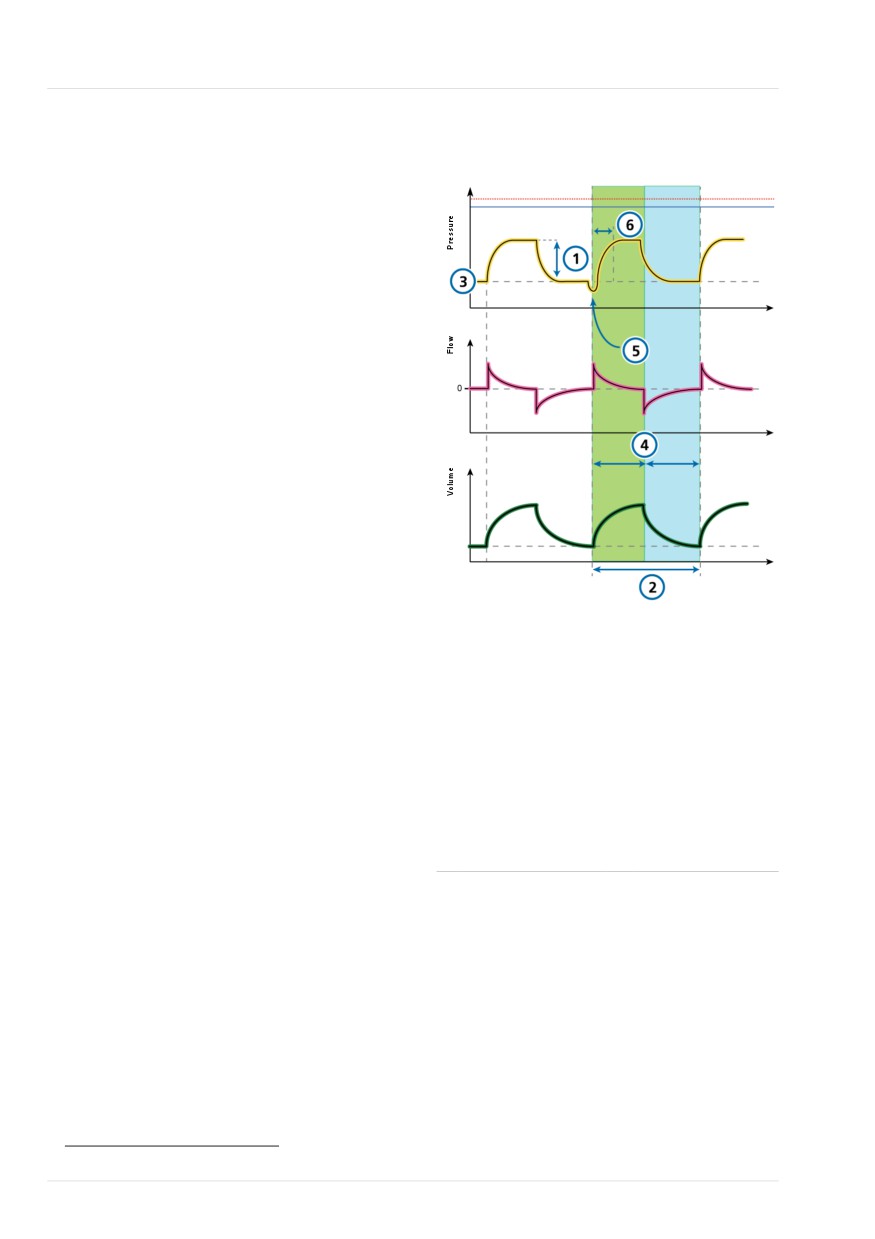
Figure 7-4. PCV+ mode: Breathing pattern and
7.3 Pressure-controlled modes
controls
The following modes are pressure-control-
Insp
Exp
led:
• PCV+
• PSIMV+
• PSIMV+ with PSync
Time
• DuoPAP
• APRV
• SPONT
Time
7.3.1 PCV+ mode
PCV+ stands for pressure-controlled venti-
lation.
Breaths in PCV+ mode are pressure
Time
controlled and mandatory.
The ventilator delivers a constant level of
Ventilator controls
pressure, so the volume depends on the
pressure settings, the inspiration time, and
CO2 elimination
the resistance and compliance of the
1
ΔPcontrol
2
Rate
patient’s lungs.
Sigh (not shown)
In PCV+ mode, parameters are set only for
Oxygenation
mandatory breaths.
3
PEEP
4
I:E46
• The pressure control (ΔPcontrol) setting
Oxygen (not shown)
defines the applied pressure above
Patient synchronization
PEEP.
5
Trigger
6
P-ramp
• Rate and I:E define the timing of the
breath cycle.
• The P-ramp setting controls the speed
with which the ventilator arrives at the
desired pressure.
This mode is available for use with a
speaking valve.
46 Depending on the selected breath timing philosophy.
132
English | 10103179/02 USA
PSIMV+ mode
7
7.3.2 PSIMV+ mode
• ETS affects the inspiratory timing of the
supported breaths.
PSIMV+ stands for pressure-controlled
The inspiratory time can also be limited
synchronized intermittent mandatory
by TI max.47
ventilation.
This mode is available for use with a
PSIMV+ mode has two options: with and
speaking valve.
without PSync. For a description of PSIMV+
with active PSync, see Section 7.3.3.
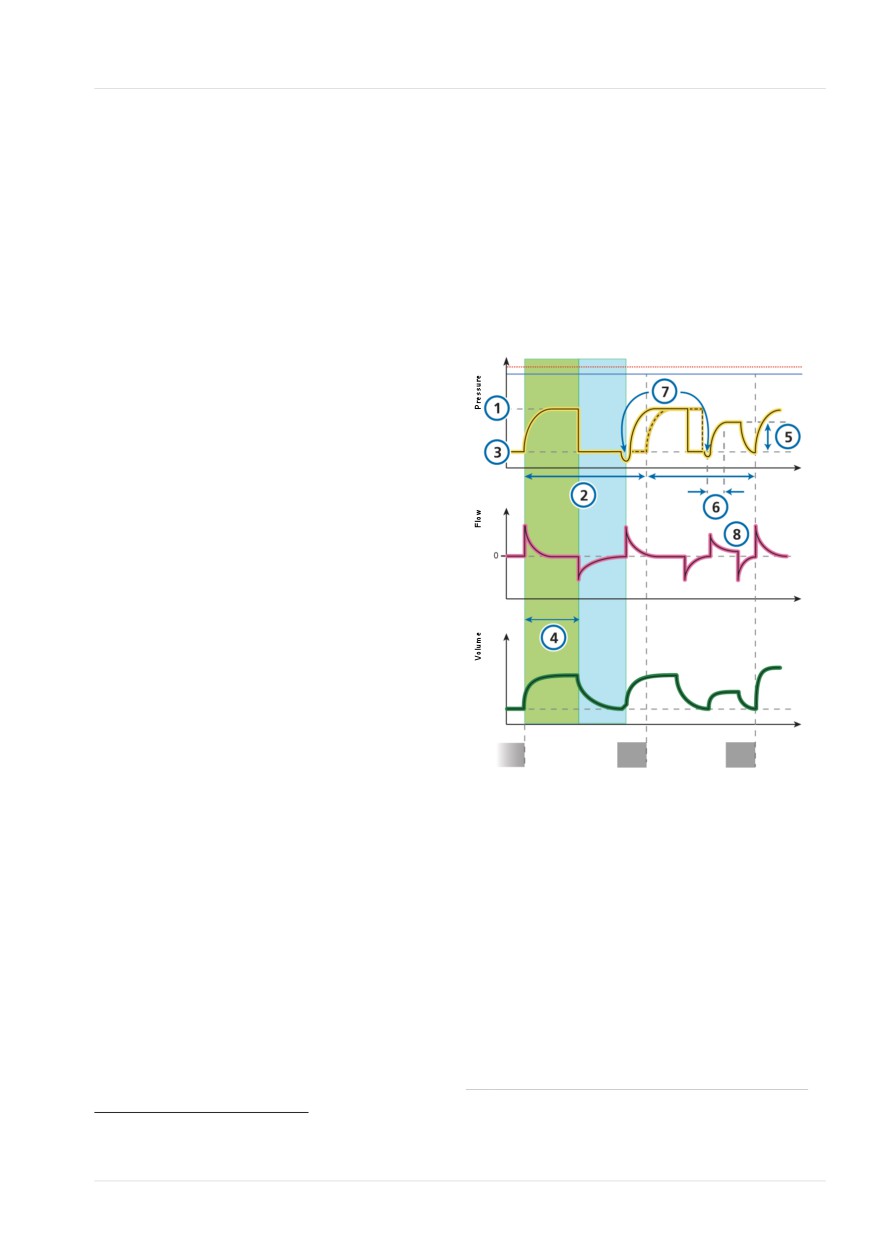
Figure 7-5. PSIMV+ mode: Breathing pattern
and controls
In PSIMV+ mode, the mandatory breaths
Insp
Exp
are PCV+ breaths. These can be alternated
with spontaneous breaths.
Each SIMV breath interval includes manda-
tory time (Tmand) and spontaneous time
(Tspont).
Time
• If the patient triggers a breath during
Tmand, the ventilator immediately
delivers a mandatory breath.
• If the patient triggers a breath during
Tspont, the ventilator delivers a sponta-
Time
neous, pressure-supported breath.
• If the patient does not trigger a breath
during Tspont, the ventilator automati-
cally delivers a mandatory breath at the
end of Tmand.
Time
Tmand
Tspont
Tmand
Tspont
Tmand
In PSIMV+ mode, parameters for both
mandatory and spontaneous breath types
Ventilator controls
are set.
CO2 elimination
• For mandatory breaths, the pressure
1
ΔPcontrol
2
Rate
control (ΔPcontrol) setting defines the
Sigh (not shown)
applied pressure above PEEP.
Oxygenation
Rate and I:E define the timing of the
3
PEEP
5
ΔPsupport
breath cycle.
4
I:E48
Oxygen (not
• For spontaneous breaths, ΔPsupport
shown)
defines the pressure support above
Patient synchronization
PEEP.
6
P-ramp
8
ETS
7
Trigger
47 TI max is only available for adult/pediatric patients if it is enabled in Configuration (Section 13.4.4). It is always available for
neonates.
48 Depending on the selected breath timing philosophy.
Hamilton Medical | HAMILTON-T1 Operator's Manual
133
7 Ventilation modes
7.3.3 PSIMV+ mode with PSync
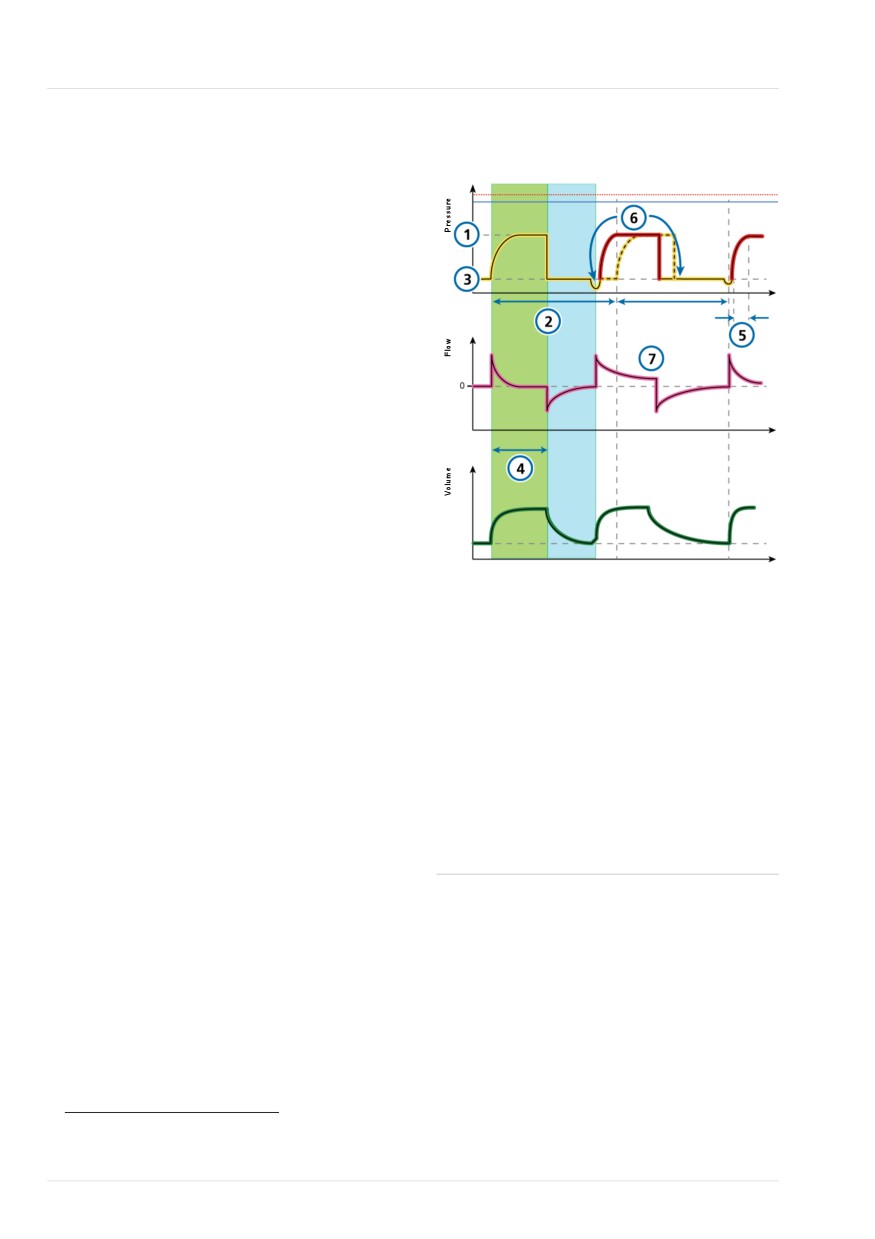
Figure 7-6. PSIMV+ with PSync mode: Breathing
pattern and controls
PSIMV+ stands for pressure-controlled
Insp
Exp
synchronized intermittent mandatory
ventilation.
PSIMV+ mode has two options: with and
without PSync. For a description of PSIMV+
without active PSync, see Section 7.3.2.
Time
If the patient triggers a breath, the ventila-
tor delivers a breath supported at the
ΔPinsp setting.
If the patient does not trigger a breath,
the ventilator automatically delivers a
Time
mandatory breath at the ΔPinsp setting.
In PSIMV+ mode, parameters for both
mandatory and spontaneous breath types
are set.
Time
• The ΔPinsp setting defines the applied
pressure above PEEP for mandatory and
Ventilator controls
spontaneous breaths.
CO2 elimination
• Rate and TI define the breath timing for
1
ΔPinsp
2
Rate
mandatory breaths.
Sigh (not shown)
• For spontaneous breaths, ETS affects
Oxygenation
the inspiratory timing of the supported
3
PEEP
4
I:E50
breaths.
Oxygen (not shown)
The inspiratory time can also be limited
Patient synchronization
by TI max.49
5
P-ramp
7
ETS
6
Trigger
49 TI max is only available for adult/pediatric patients if it is enabled in Configuration (Section 13.4.4). It is always available for
neonates.
50 Depending on the selected breath timing philosophy.
134
English | 10103179/02 USA
DuoPAP mode
7
7.3.4 DuoPAP mode
ΔPsupport is set relative to (above) PEEP/
CPAP, which means that spontaneous
DuoPAP stands for duo positive airway
breaths at the P high level are supported
pressure.
only when this target pressure is greater
than P high.
DuoPAP is a type of pressure ventilation
designed to support spontaneous breath-
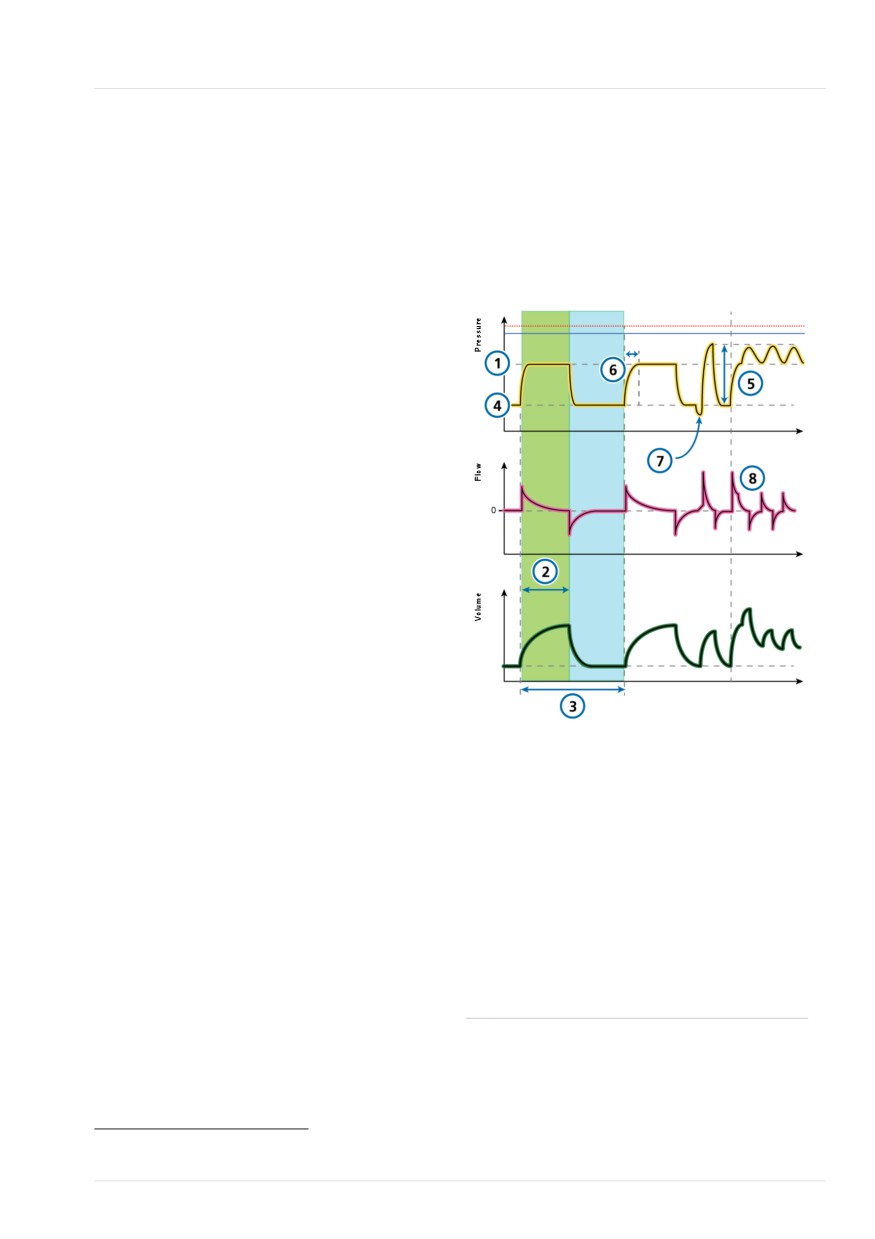
Figure 7-7. DuoPAP mode: Breathing pattern
ing on two alternating levels of CPAP.
and controls
Insp
Exp
In this mode, the ventilator switches auto-
matically and regularly between two oper-
ator-selected levels of positive airway pres-
sure or CPAP.
Cycling between the levels is triggered by
DuoPAP timing settings or by patient
Time
effort.
In DuoPAP, the switch-over51 between the
two levels is defined by the pressure
settings, P high and PEEP/CPAP, and the
Time
time settings, T high and Rate.
Note the following:
• At conventional settings and in the
absence of spontaneous breathing,
DuoPAP resembles PCV+.
Time
• As you decrease the rate, keeping
T high short relative to the time at the
Ventilator controls
lower pressure level, the mode looks
CO2 elimination
more like PSIMV+, with spontaneous
breaths following mandatory breaths.
1
P high
3
Rate
2
T high
• If T high is set to almost the breath
cycle time with just enough time at the
Oxygenation
low level to allow full or near-full exha-
4
PEEP/CPAP
5
ΔPsupport
lation, this mode looks like APRV
Oxygen (not shown)
(Section 7.3.5).
Patient synchronization
Pressure support can be set to assist spon-
6
P-ramp52
8
ETS
taneous breaths in DuoPAP, whether they
7
Trigger
occur at the PEEP/CPAP or P high level.
51 The switch-over from PEEP/CPAP to P high is synchronized to the patient's efforts in the Synchronization window.
52 Pressure rise time to P high and ΔPsupport.
Hamilton Medical | HAMILTON-T1 Operator's Manual
135
7 Ventilation modes
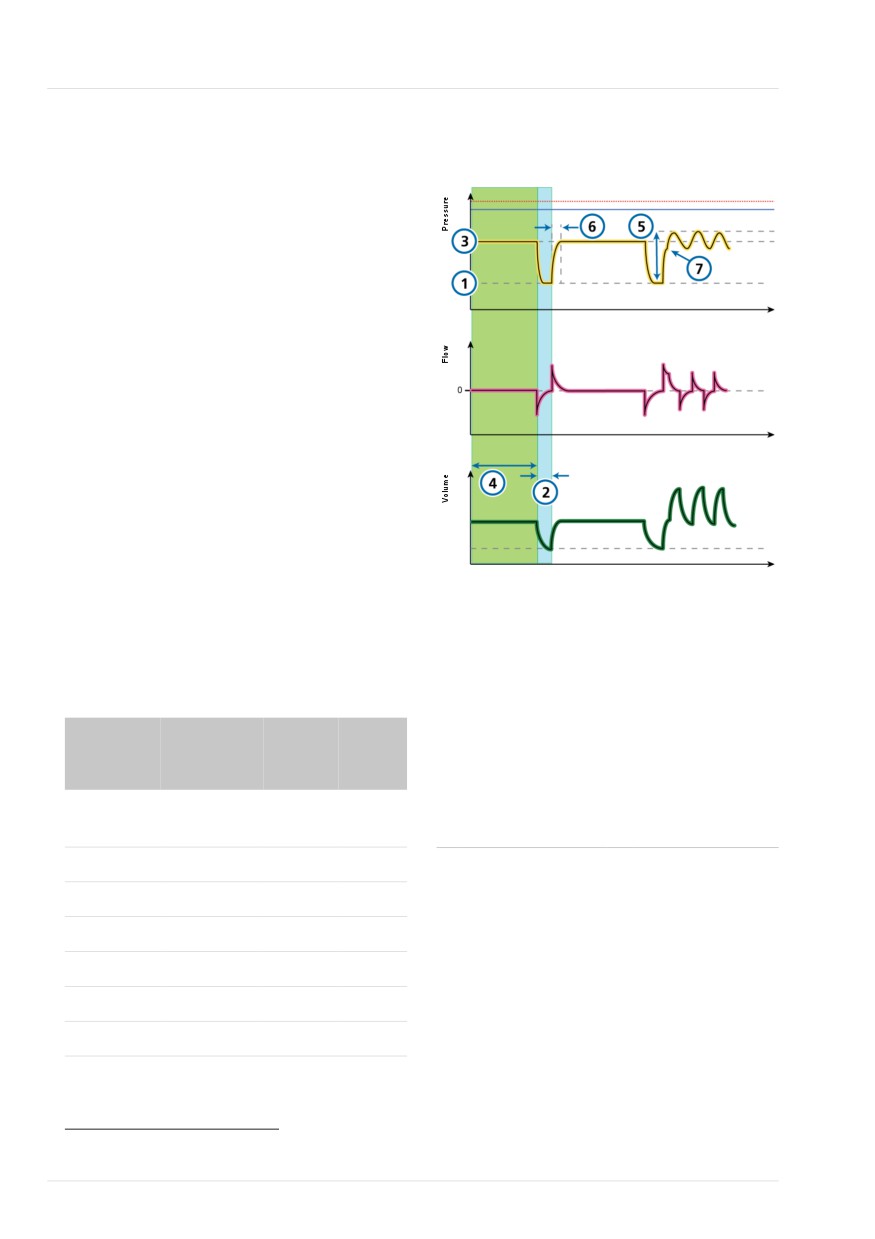
7.3.5 APRV mode
Figure 7-8. APRV mode: Breathing pattern and
controls
APRV stands for airway pressure release
Insp
Exp
ventilation.
Set airway pressure P high is transiently
released to a lower level P low, after which
it is quickly restored to reinflate the lungs.
For a patient who has no spontaneous
Time
breathing efforts, APRV is similar to pres-
sure-controlled inverse ratio ventilation.
APRV allows spontaneous breathing at any
time during the respiratory cycle.
Time
APRV is an independent mode. When
changing modes, the pressure and timing
settings from any other mode are not
transferred to APRV, and vice versa.
When switching to APRV for the first time,
Time
the initial timing and pressure settings
proposed are based on IBW (Weight for
Ventilator controls
neonatal patients) as shown in the follow-
CO2 elimination
ing table.
1
P low
2
T low
Table 7-2. Default settings for APRV
Oxygenation
3
P high53
4
T high
IBW /
P high / P
T high T low
5
ΔPsupport
Oxygen (not
Weight
low
(s)
(s)
(kg)
(cmH2O)
shown)
Patient synchronization
0.2 to
20 / 5
1.4
0.2
2.99
6
P-ramp (to P high)
7
Trigger54
3 to 5.9
20 / 5
1.7
0.3
6 to 8.9
20 / 5
2.1
0.3
9 to 20.9
20 / 5
2.6
0.4
21 to 39
20 / 5
3.5
0.5
40 to 59
20 / 5
4.4
0.6
> 60
20 / 5
5.4
0.6
53 With prolonged T high settings and short T low settings, the P high setting in effect becomes the PEEP level.
54 Only used to count spontaneous breaths or to monitor patient activity.
136
English | 10103179/02 USA
SPONT mode
7
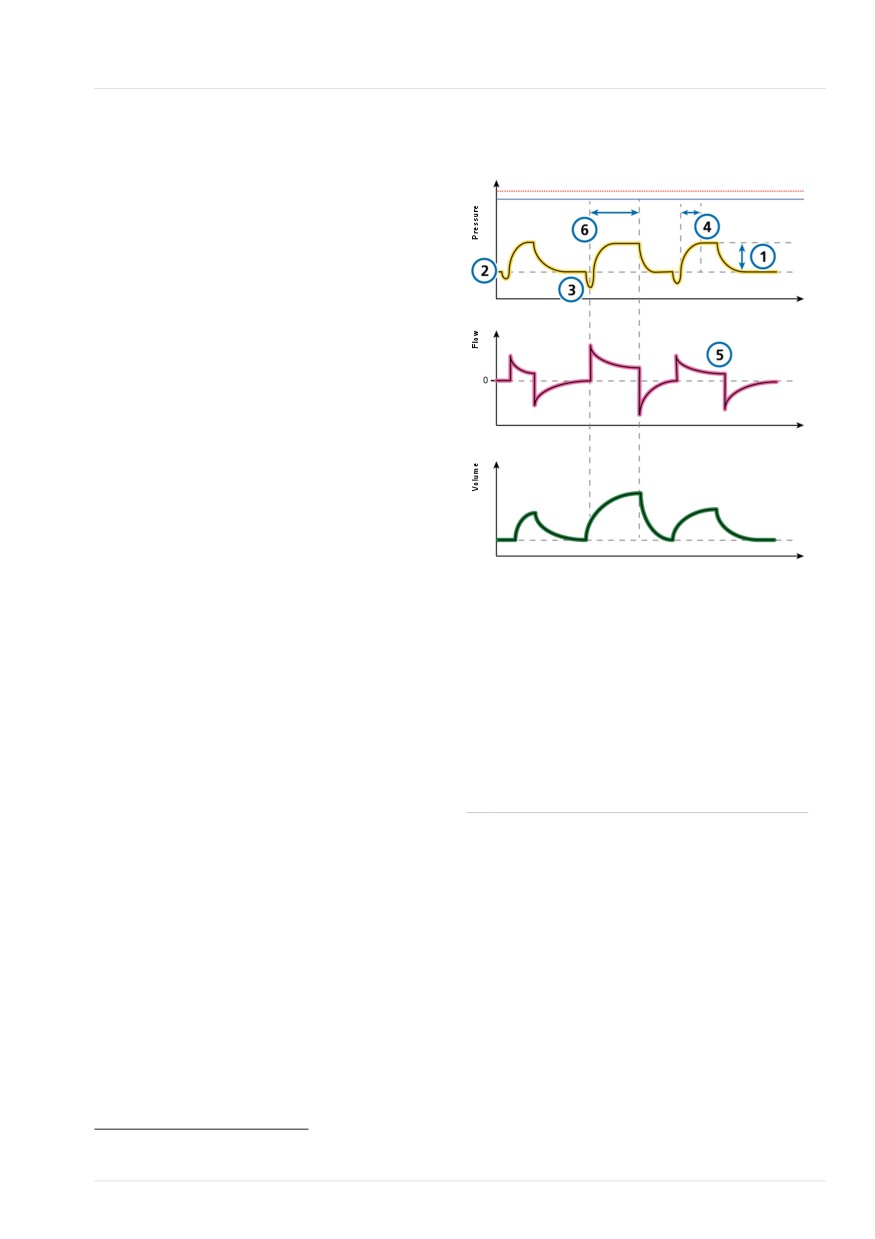
7.3.6 SPONT mode
Figure 7-9. SPONT mode: Breathing pattern and
controls
SPONT stands for spontaneous mode.
SPONT delivers spontaneous breaths and
operator-initiated manual, mandatory
breaths.
When pressure support is set to zero, the
ventilator functions like a conventional
Time
CPAP system.
• The pressure support (ΔPsupport)
setting defines the applied pressure
during inspiration.
Time
• The PEEP setting defines the PEEP
applied during expiration.
• ETS affects the inspiratory timing of the
supported breaths.
The inspiratory time can also be limited
Time
by TI max.55
Ventilator controls
This mode is available for use with a
CO2 elimination
speaking valve.
1
ΔPsupport
Sigh (not shown)
Oxygenation
2
PEEP
Oxygen (not shown)
Patient synchronization
3
Trigger
5
ETS
4
P-ramp
55 TI max is only available for adult/pediatric patients if it is enabled in Configuration (Section 13.4.4). It is always available for
neonates.
Hamilton Medical | HAMILTON-T1 Operator's Manual
137
7 Ventilation modes
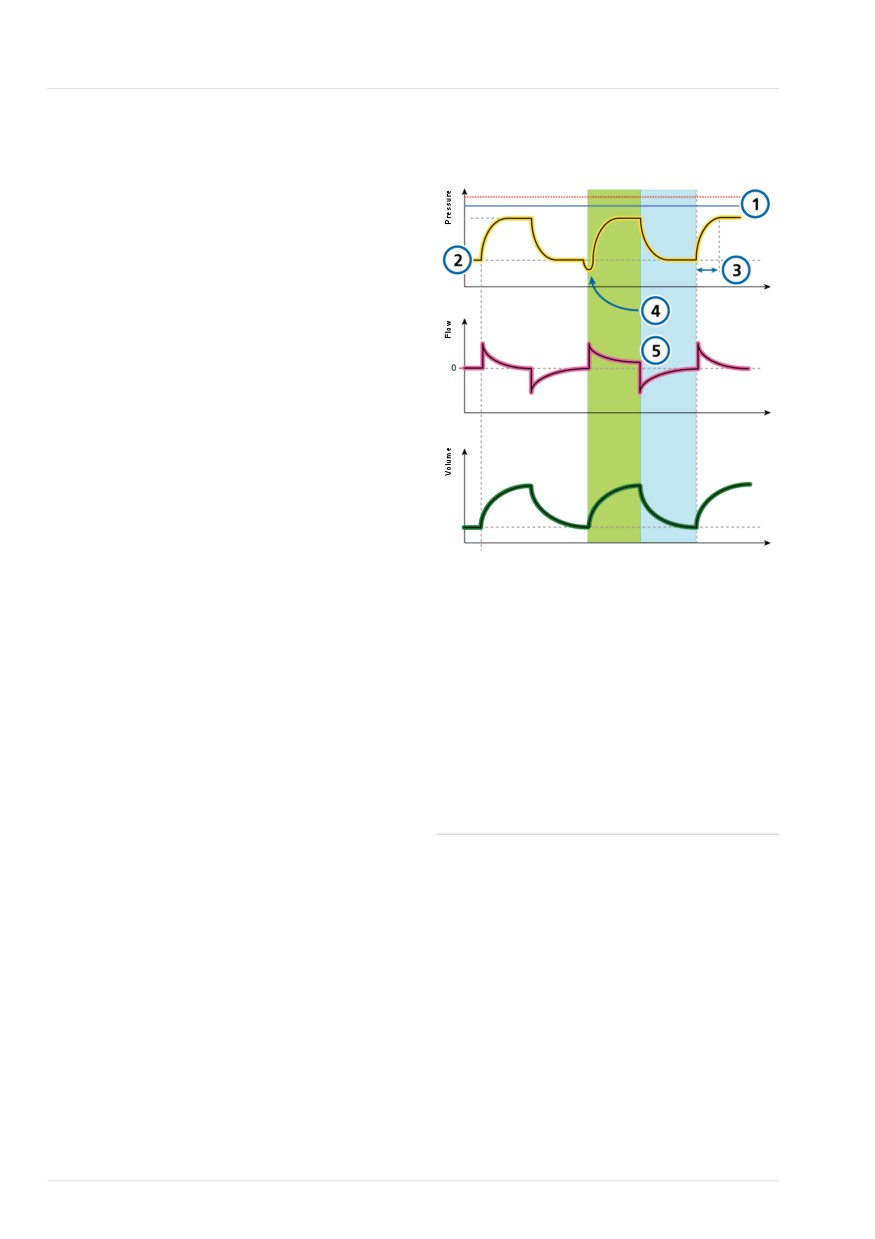
Figure 7-10. ASV mode: Breathing pattern and
7.4 Intelligent Ventilation
controls
ASV® is a volume-controlled Intelligent
Insp
Exp
Ventilation mode.
ASV is not available for neonatal patients.
7.4.1 ASV mode
Time
ASV stands for Adaptive Support Ventila-
tion®.
ASV maintains an operator-preset, mini-
mum minute ventilation independent of
Time
the patient‘s breathing activity.
The target breathing pattern (tidal volume
and respiratory rate) is calculated by the
ventilator, based on the assumption that
the optimal breathing pattern results in
Time
the least work of breathing, and the mini-
mal force of breathing (driving pressure).
Ventilator controls
For initial settings, see Table 7-3.
CO2 elimination
ASV adjusts inspiratory pressure and
1
Plimit
Sigh (not shown)
mandatory rate on a breath-by-breath
%MinVol (not shown)
basis taking into account the changing
Oxygenation
patient lung mechanics (resistance, com-
pliance, RCexp) and applying lung-protec-
2
PEEP/CPAP
Oxygen (not shown)
tive strategies to meet the targets.
Patient synchronization
3
P-ramp
5
ETS
A decrease in pressure limitation (Plimit)
will follow with a decrease in tidal volume
4
Trigger
(Vt) and an increase in Rate.
138
English | 10103179/02 USA

ASV mode
7
ASV maintains a preset minimum minute
• Prevents AutoPEEP
ventilation:
• Prevents dead space ventilation
• Automatically adjusts for changing
• Does not exceed a ΔPinsp pressure of
patient conditions between active and
10 cmH2O below the upper pressure
passive states
limit
• Mandatory breaths are pressure
controlled
The operator sets the %MinVol, PEEP, and
Oxygen.
• Spontaneous breaths are pressure sup-
ported
For details about working with ASV, see
Section 7.8.
• Prevents tachypnea
Table 7-3. ASV mode initial breath pattern settings
Patient group
IBW (kg)
ΔPinsp
TI (s)
Initial rate (b/
(cmH2O)
min)
Pediatric
3 to 5
15
0.4
30
6 to 8
15
0.6
25
9 to 11
15
0.6
25
12 to 14
15
0.7
20
15 to 20
15
0.8
20
21 to 23
15
0.9
20
24 to 29
15
1
20
> 30
15
1
20
Adult
10 to 29
15
1
20
30 to 39
15
1
18
40 to 59
15
1
15
60 to 89
15
1
15
90 to 99
18
1.5
15
> 100
20
1.5
15
Hamilton Medical | HAMILTON-T1 Operator's Manual
139
7 Ventilation modes
7.4.1.1 ASV and ASV 1.1
7.5 Noninvasive modes
ASV 1.1 is the default setting for the ASV
mode. The previous version of ASV is also
CAUTION
available on the device, and can be
• Hamilton Medical ventilators must not
selected in Configuration.
be used for helmet CPAP therapy.
ASV 1.1 follows the low tidal volume rec-
• All Hamilton Medical ventilators are
ommendation (Bellani G, et al. JAMA
able to provide noninvasive ventilation
2016) and brings additional features and
through a helmet. The turbine-driven
changes:
ventilators are able to provide higher
• Increased target rate and reduced tidal
continuous flow levels, and the air
volumes and driving pressure for the
supply provided by filtered room air
majority of patients compared to stan-
(HEPA) with ambient humidity.
dard ASV.
The following modes are noninvasive:
• In cases of high time constants and
• NIV
high minute volumes, Vt max is limited
to 15 ml/kg.
• NIV-ST
For details about working with ASV, see
• nCPAP
Section 7.8.
• nCPAP-PC
The NIV and NIV-ST modes are implemen-
tations of noninvasive positive pressure
ventilation (NPPV).
nCPAP and nCPAP-PC are neonatal modes
that offer nasal continuous positive airway
pressure - and intermittent positive pres-
sure support through a nasal interface
(mask or prongs) for infants and neonates.
For details about working with noninva-
sive modes, see Section 7.7.
140
English | 10103179/02 USA
NIV mode
7
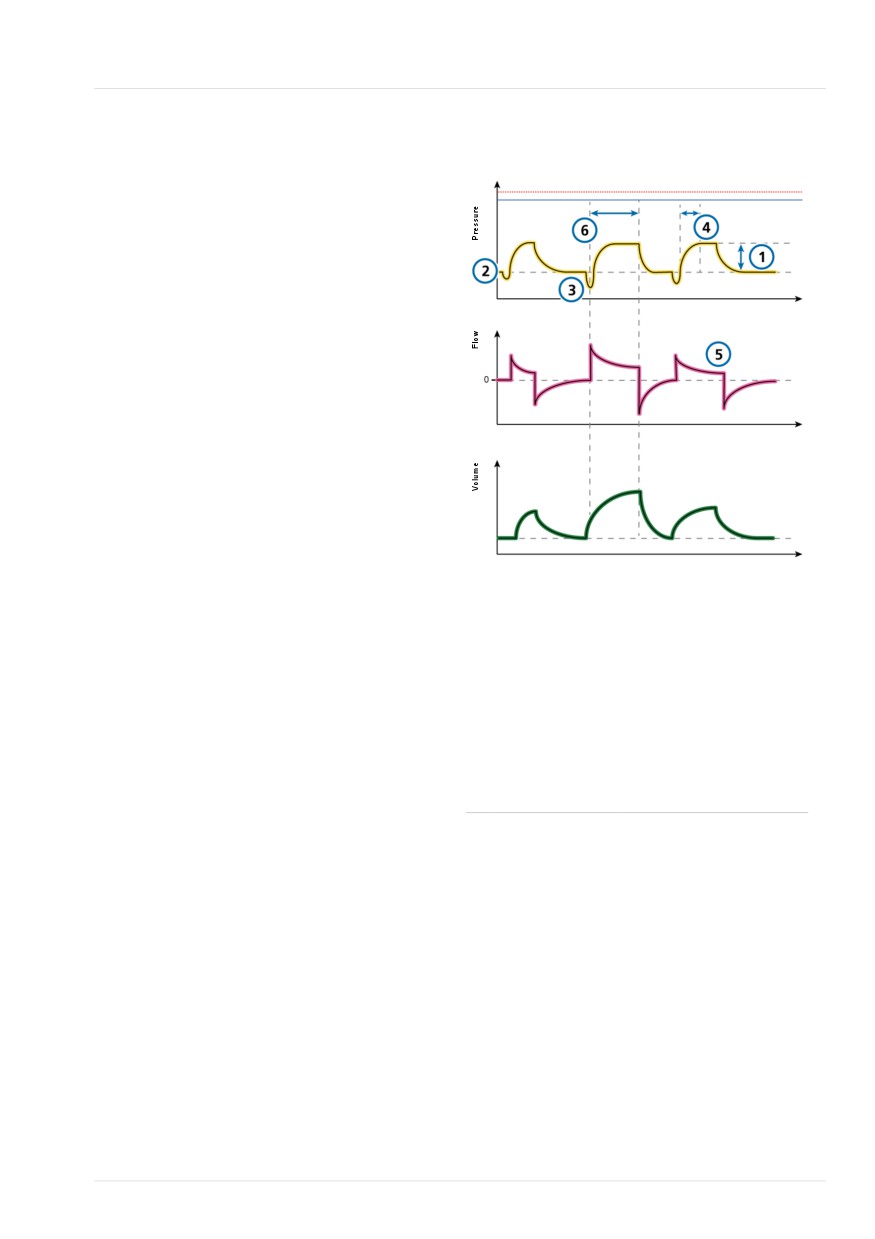
7.5.1 NIV mode
Figure 7-11. NIV mode: Breathing pattern and
controls
NIV stands for noninvasive ventilation.
NIV mode delivers spontaneous breaths.
NIV is designed for use with a mask or
other noninvasive patient interface.
When pressure support is set to zero, the
Time
ventilator functions like a conventional
CPAP system.
• The pressure support (ΔPsupport)
setting defines the applied pressure
during inspiration.
Time
• ETS affects the inspiratory timing of the
supported breaths.
The inspiratory time can also be limited
by TI max.
Time
• The PEEP setting defines the PEEP
applied during expiration.
Ventilator controls
CO2 elimination
For additional details about working with
1
ΔPsupport
Sigh (not shown)
noninvasive modes, see Section 7.7.
Oxygenation
2
PEEP
Oxygen (not shown)
Patient synchronization
3
Trigger
5
ETS
4
P-ramp
6
TI max
Hamilton Medical | HAMILTON-T1 Operator's Manual
141
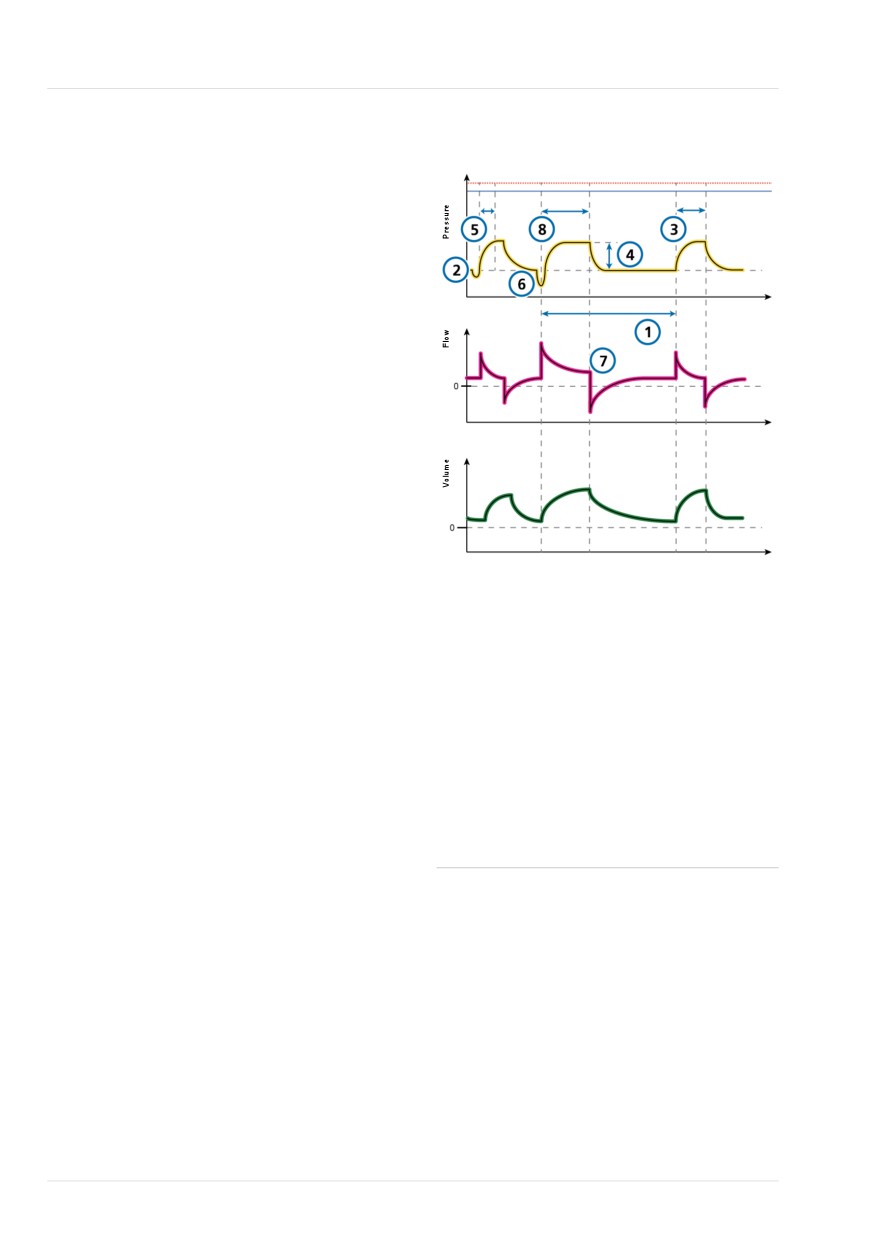
7 Ventilation modes
7.5.2 NIV-ST mode
Figure 7-12. NIV-ST mode: Breathing pattern
and controls
NIV-ST stands for spontaneous/timed
noninvasive ventilation.
NIV-ST mode delivers time-cycled or flow-
cycled breaths. Every patient trigger results
in a flow-cycled, pressure-supported
breath.
Time
If the rate of patient-triggered breaths falls
below the set mandatory Rate, time-cycled
breaths are delivered at the set Rate and
timing.
Time
If the patient triggers a breath during the
breath interval, the ventilator immediately
delivers a spontaneous breath. If the
patient does not trigger an inspiration
during this time, the ventilator initiates a
mandatory breath according to the set
Time
Rate.
Ventilator controls
This mode requires that you set the para-
CO2 elimination
meters needed for both mandatory and
1
Rate
Sigh (not shown)
spontaneous breath types.
Oxygenation
• The inspiratory pressure setting, ΔPinsp,
2
PEEP
3
TI
defines the applied pressure for both
mandatory and spontaneous breaths.
Oxygen (not shown)
Patient synchronization
• The Rate and TI (inspiratory time)
4
ΔPinsp
7
ETS
control settings define the breath tim-
ing.
5
P-ramp
8
TI max
• For spontaneous breaths, the ETS
6
Trigger
setting affects the inspiratory timing of
the supported breaths.
The inspiratory time can also be limited
by TI max.
142
English | 10103179/02 USA
The nCPAP modes
7
7.5.3 The nCPAP modes
About the High Flow alarm
In both modes, the High Flow alarm moni-
CAUTION
tors the inspiratory flow and can help to
detect disconnection of the patient inter-
Be sure to set the Flow alarm limit to an
face. When the flow exceeds the set limit,
appropriate level above the current mon-
the High Flow alarm is generated and the
itored peak flow to avoid potential gas-
system reduces the delivered flow. As a
tric overinflation, and to be able to
result, the delivered pressure may also be
detect leaks and disconnection of the
reduced.
patient interface.
To minimize the incidence of this alarm,
nCPAP stands for nasal continuous positive
observe the Insp Flow values and set the
airway pressure.
flow limit to a value above the average
Insp Flow reading plus a known minimum
The HAMILTON-T1 offers two nCPAP
leakage.
modes: nCPAP and nCPAP-PC, described in
detail in the following sections.
About the Flow and Insp Flow parameters
In these modes, the Flow and Insp Flow
parameters monitor average and peak
flow, respectively, as described in the
following table.
Table 7-4. Flow parameters in nCPAP modes
Parameter
nCPAP mode nCPAP-PC
(unit)
mode
Flow
Average
Average flow
(l/min)
flow,
during expi-
updated
ration,
every second.
updated
each breath.
Displayed in the Monitoring
window.
Insp Flow
Peak flow during inspiration,
(l/min)
measured every second.
Insp Flow is a main monitor-
ing parameter (MMP) and is
always displayed.
Hamilton Medical | HAMILTON-T1 Operator's Manual
143
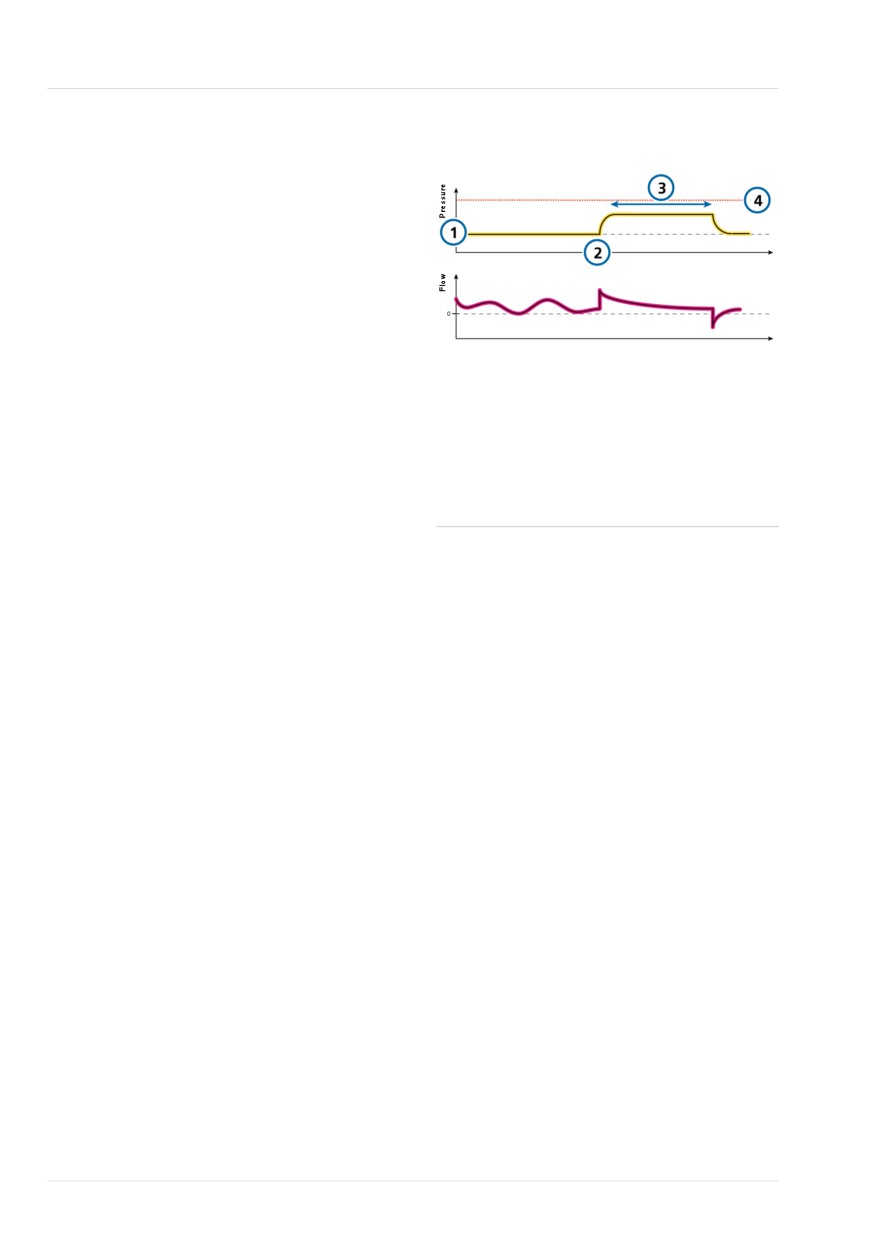
7 Ventilation modes
7.5.3.1 nCPAP mode
Figure 7-13. nCPAP mode: Breath pattern and
controls
nCPAP stands for nasal continuous positive
airway pressure.
This mode applies CPAP over a nasal inter-
face (mask or prongs). Leaks are compen-
Time
sated due to the set High Flow limit.
The nCPAP mode works with the following
parameters:
Time
• Control settings: PEEP/CPAP and
Oxygen
1
PEEP
3
Manual breath
key pressed
• Monitored parameters: Insp Flow and
2
Manual breath
4
Pressure limita-
Flow
tion
For details about the parameters and flow-
Oxygen (not
related alarms, see Sections 7.5.3, 5.10,
shown)
and 9.4.
When a manual breath is applied, the
pressure changes to PEEP + 5 cmH2O for a
period of 0.4 seconds, or so long as the
key is pressed, to a maximum of
15 seconds. When the manual breath is
completed, the pressure returns to the set
PEEP/CPAP level.
144
English | 10103179/02 USA
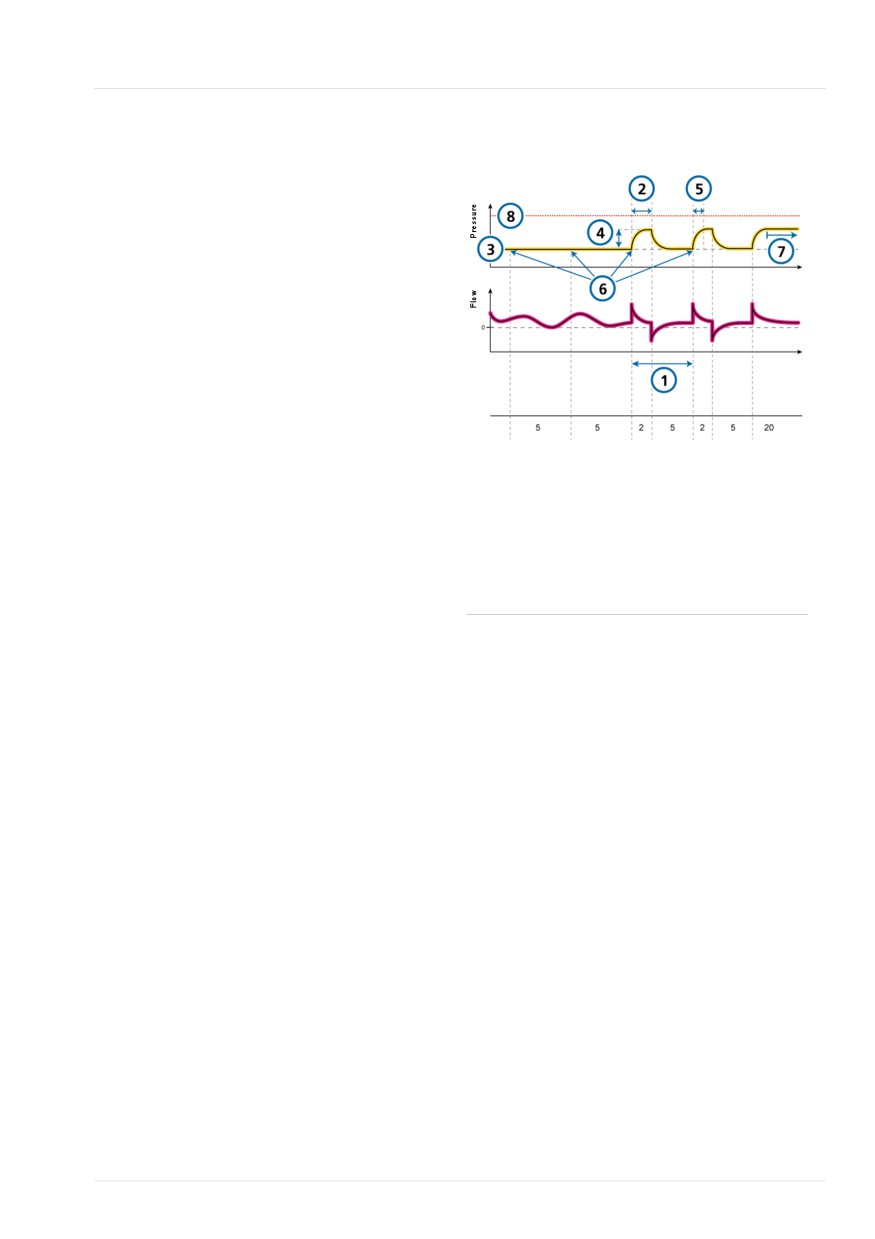
nCPAP-PC mode
7
7.5.3.2 nCPAP-PC mode
Figure 7-14. nCPAP-PC mode: Breathing pat-
tern and controls
nCPAP-PC stands for nasal continuous pos-
itive airway pressure - pressure control.
This mode delivers, in addition to the set
CPAP, intermittent, time-cycled, and pres-
sure-controlled breaths. This results in a
Time
biphasic breathing pattern.
The patient can also breathe freely at both
pressure levels. The inspiratory flow fol-
Time
lows the respiratory effort of the patient
on both pressure levels. Leaks are com-
pensated due to the set High Flow limit.
States
The following parameters are used in the
nCPAP-PC mode: Rate, ΔPcontrol, TI, P-
1
Rate
5
P-ramp
ramp, PEEP/CPAP, Oxygen
2
TI
6
Mandatory trigger
When a manual breath is applied, the
3
PEEP
7
Manual breath key
pressure changes to the ΔPcontrol setting
pressed
for the length of time set by the TI
4
ΔPcontrol
8
Pressure limitation
(inspiratory time) or so long as the key is
pressed, to a maximum of 15 seconds.
When the manual breath is completed,
the pressure returns to the set PEEP/CPAP
level.
For details about the parameters, see
Section 5.10.
Hamilton Medical | HAMILTON-T1 Operator's Manual
145
7 Ventilation modes
7.6 Special conditions
7.6.2 Safety ventilation/Safety mode
In the event of certain technical failures,
The following ventilator modes/states may
the ventilator switches to one of the
be observed under certain error condi-
following modes:
tions:
• Safety ventilation, when any mode
Table 7-5. Special conditions overview
other than HiFlowO2 is selected
For details about ...
See ...
• Safety mode, when HiFlowO2 therapy is
selected
Sensor Failure mode
Section 7.6.1
Safety ventilation/Safety
Section 7.6.2
This gives you time to arrange for correc-
mode
tive actions, including organizing a
replacement ventilator.
Ambient state
Section 7.6.3
The following conditions apply to ventila-
tion in Safety ventilation/Safety mode:
7.6.1 Sensor Failure mode
• The ventilator does not monitor patient
When there is a problem with the flow
inputs.
sensor that lasts for more than three
• The blower runs constantly to create
breath cycles, the External flow sensor
inspiratory pressure (ΔPinsp).
failed alarm is generated and the ventilator
In Safety ventilation, the ΔPinsp, Rate,
switches to Sensor Failure mode. Ventila-
and Oxygen settings are delivered as
tion continues in PCV+ mode.
state in Tables 7-6 and 7-7.
Once the alarm is resolved, the ventilator
In Safety mode, the ΔPinsp, Rate, and
exits Sensor Failure mode and returns to
Oxygen settings are delivered as state in
ventilation with the previous mode and
Tables 7-8 and 7-9.
settings.
• The expiratory valve switches system
For details about the External flow sensor
pressure levels between PEEP and
failed alarm, see Section 9.4.
inspiratory pressure.
The following conditions apply to ventila-
• You must turn off ventilator power to
tion in Sensor Failure mode:
exit Safety ventilation/Safety mode.
• The ventilator changes to PCV+ mode.
Settings in Safety ventilation
• Internal ventilator pressure (Pvent) is
Table 7-6. Safety ventilation settings, Adult/Ped
displayed instead of airway pressure
(Paw).
IBW
ΔPinsp
Rate
Oxygen
• Monitoring parameters related to the
(kg)
(cmH2O)
(b/min)
(%)
flow sensor measurement are shown in
3 to 5.9
15
35
> 21%
grey, indicating they are inaccurate.
6 to 8.9
15
30
> 21%
• The message Sensor Failure mode venti-
lation initiated is recorded in the Event
9 to 19.9
15
25
> 21%
log.
20 to 30
15
20
> 21%
146
English | 10103179/02 USA
Safety ventilation/Safety mode
7
IBW
ΔPinsp
Rate
Oxygen
IBW
ΔPinsp
Rate
Oxygen
(kg)
(cmH2O)
(b/min)
(%)
(kg)
(cmH2O)
(b/min)
(%)
31 to 39
15
17
> 21%
60 to 89
15
12
> 21%
40 to 59
15
15
> 21%
90 to 99
18
12
> 21%
≥ 100
20
12
> 21%
PEEP is set to the PEEP of the previous mode
and the I:E ratio is 1:4.
Safety ventilation settings apply when any
mode other than HiFlowO2 therapy is
selected.
<<ALE: When PBW comes into play,
update same as C6>>
Table 7-7. Safety ventilation settings, Neonatal
Weight
ΔPinsp
Rate
Oxygen
(kg)
(cmH2O)
(b/min)
(%)
< 1.26
15
60
> 21%
1.26 to
15
45
> 21%
2.99
3.0 to 5.9
15
35
> 21%
6.0 to 8.9
15
30
> 21%
9.0 to 19.9
15
25
> 21%
> 20
15
20
> 21%
PEEP is set to the PEEP of the previous mode
and the I:E ratio is 1:3.
Safety ventilation settings apply when any
mode other than HiFlowO2 therapy is
selected.
Settings in Safety mode
Table 7-8. Safety mode settings, Adult/Ped
IBW
ΔPinsp
Rate
Oxygen
(kg)
(cmH2O)
(b/min)
(%)
3 to 5.9
15
35
> 21%
Hamilton Medical | HAMILTON-T1 Operator's Manual
147
7 Ventilation modes
IBW
ΔPinsp
Rate
Oxygen
7.6.3 Ambient state
(kg)
(cmH2O)
(b/min)
(%)
If the technical fault alarm is serious
6 to 8.9
15
30
> 21%
enough to possibly compromise safe venti-
lation, the ventilator enters the Ambient
9 to 19.9
15
25
> 21%
state.
20 to 30
15
20
> 21%
The following conditions apply to ventila-
31 to 39
15
17
> 21%
tion in the Ambient state:
40 to 59
15
15
> 21%
• The inspiratory channel and expiratory
valves are opened, letting the patient
60 to 89
15
12
> 21%
breathe room air unassisted.
90 to 99
18
12
> 21%
• Provide alternative ventilation immedi-
≥ 100
20
12
> 21%
ately.
PEEP is set to the PEEP of the previous mode
• You must turn off ventilator power to
and the I:E ratio is 1:4.
exit the Ambient state.
Safety mode settings apply when HiFlowO2
7.7 Working with noninvasive
is selected.
modes
<<ALE: When PBW comes into play,
This section provides an overview of
update same as C6>>
noninvasive ventilation requirements,
contraindications for use, and important
Table 7-9. Safety mode settings, Neonatal
information about settings and alarms.
Weight
ΔPinsp
Rate
Oxygen
When using noninvasive positive pressure
(kg)
(cmH2O)
(b/min)
(%)
ventilation (NPPV), use a noninvasive
< 1.26
15
60
> 21%
patient interface, for example a mask,
rather than an invasive conduit.
1.26 to
15
45
> 21%
2.99
7.7.1 Required conditions for use
3.0 to 5.9
15
35
> 21%
Before proceeding, review the safety
6.0 to 8.9
15
30
> 21%
information in Chapter 1.
9.0 to 19.9
15
25
> 21%
The following requirements must be met
to use noninvasive ventilation:
> 20
15
20
> 21%
• The patient must be able to trigger the
PEEP is set to the PEEP of the previous mode
ventilator and must have regular spon-
and the I:E ratio is 1:3.
taneous breaths.
Safety mode settings apply when HiFlowO2
is selected.
148
English | 10103179/02 USA
Contraindications
7
Noninvasive ventilation is intended to
7.7.2 Contraindications
provide supplemental ventilatory
support to patients with regular spon-
CAUTION
taneous breaths.
•
If you place an additional component,
•
The patient must be conscious.
such as an HMEF, between the flow
•
The patient must be able to maintain
sensor and the patient, the additional
an adequate airway.
resistance limits the ventilator's ability
to identify disconnection at the
•
Intubation must be possible at any
patient.
time.
To correctly identify a patient discon-
•
The mask or interface is a good fit.
nection, be sure to appropriately set
the lower limit of the Pressure alarm,
as well as the Volume alarm limits,
and carefully monitor the patient's
SpO2 and, if available, PetCO2 values.
•
To prevent possible patient injury, do
NOT use noninvasive ventilation on
patients with no or irregular sponta-
neous breaths. Noninvasive ventilation
is intended to provide supplemental
ventilatory support to patients with
regular spontaneous breaths.
•
To prevent possible patient injury, do
NOT attempt to use noninvasive venti-
lation on intubated patients.
Using noninvasive ventilation is contraindi-
cated if any of the following conditions
are met:
• The patient does not have the drive to
breathe
• Partial or complete airway obstruction
• Gastrointestinal bleeding
• Anatomic or subjective intolerance of
NIV interface
• Patient is unable to cooperate or pro-
tect airway
Hamilton Medical | HAMILTON-T1 Operator's Manual
149
7 Ventilation modes
7.7.3 Potential adverse reactions
• Adjusting the TI max setting increases
or decreases the allowable inspiratory
The following reactions to noninvasive
time.
ventilation are possible:
• Increasing ETS above the default 25%
• Aspiration, gastric insufflation
allows the ventilator to cycle to termi-
• Increase of intracranial pressure (ICP)
nate inspiration at a higher flow, to
accommodate larger leaks.
• Decrease of arterial pressure
• CO2 rebreathing
Other controls require special attention:
• Carefully observe the patient/ventilator
• Claustrophobia
interaction.
• Discomfort
• Adjust ΔPsupport or ΔPinsp to obtain
• Dyssynchrony
appropriate tidal volumes.
• Skin or conjunctiva lesions
• The leakage in noninvasive modes can
reduce the actual applied PEEP and give
7.7.4 Control settings in noninvasive
rise to autotriggering.
ventilation
• Adjust PEEP further, considering
oxygenation and AutoPEEP.
WARNING
7.7.5 Alarms in noninvasive ventila-
• The exhaled volume from the patient
can differ from the measured exhaled
tion
volume due to leaks around the mask.
Due to the changing and unpredictable
• Peak pressures exceeding 33 cmH2O
amount of leakage, volume alarms are less
may increase the risk of aspiration
meaningful in noninvasive modes than in
due to gastric insufflation. When ven-
other modes. Alarms are based on the
tilating with such pressures, consider
returned expiratory gas volume measured
using an invasive mode.
at the flow sensor; this value can be signi-
ficantly lower than the delivered tidal
When a significant leak occurs, the
volume, because the delivered tidal
inspiratory flow can never fall below ETS,
volume is the sum of the displayed VTE
thereby preventing the ventilator from
and the leakage volume.
cycling into exhalation and resulting in
endless inspiration. The TI max setting pro-
To avoid nuisance volume alarms, set the
vides an alternate way to cycle into exha-
low Vt and ExpMinVol alarms to a low
lation. When inspiration lasts longer than
level.
TI max, the ventilator cycles into exhala-
Because the noninvasive modes are pres-
tion.
sure modes, however, do pay attention to
Ensure the TI max setting is sufficiently
the pressure-related alarms. If the defined
PEEP and inspiratory pressure can be
long to give ETS the chance to cycle the
ventilator.
maintained, the ventilator is compensating
the gas leak sufficiently.
150
English | 10103179/02 USA
Monitored parameters in noninvasive ventilation
7
7.7.6 Monitored parameters in
7.7.7 Additional notes about using
noninvasive ventilation
noninvasive ventilation
Due to some unique characteristics, con-
NOTICE
sider the following points when using
• The following numeric monitoring
noninvasive ventilation.
parameters cannot be used for reli-
IntelliTrig function
able analysis of patient conditions:
ExpMinVol, RCexp, Rinsp, Insp Flow,
To synchronize, IntelliTrig compensates for
AutoPEEP, and Cstat.
leaks and resistance between the ventila-
• Continuous monitoring of clinical
tor and the patient, and with each breath,
parameters and patient comfort is
it measures the leakage at the patient
critically important.
interface (mask).
• The parameters VTE NIV, MinVol NIV,
With this information, IntelliTrig adjusts
MVSpont NIV, and MVLeak are leak
the trigger mechanism, reducing the influ-
compensated, and are used in
ence of leakage and the changing breath
noninvasive modes. These parameters
pattern on the operator-set trigger sensi-
are estimations and may not reflect
tivity.
exact values.
Maintaining PEEP and preventing auto-
Due to the leakage at the patient inter-
triggering
face, displayed exhaled volumes in the
Significant leakage can be present in
noninvasive modes can be substantially
noninvasive ventilation, which can serve to
smaller than the delivered volumes.
reduce the actual applied PEEP/CPAP and
The flow sensor measures the delivered
give rise to autotriggering. If you cannot
volume and the exhaled tidal volume; the
reach the set PEEP/CPAP, check the mask
ventilator displays the difference as VLeak
fit.
in percent (%), and as MVLeak in l/min.
The Loss of PEEP alarm alerts you to
Use VLeak and MVLeak to assess the fit of
uncompensated leaks (that is, when the
the mask or other noninvasive patient
measured PEEP/CPAP is 3 cmH2O lower
interface.
than the set PEEP/CPAP).
While a leak at the patient interface influ-
ences the tidal volume measurement,
leaks in the breathing circuit itself do not
influence the tidal volume measurement.
In addition to other clinical parameters, TI,
Ppeak, PEEP/CPAP, I:E, fTotal, Pmean, and
fSpont can be used to assess the patient’s
ventilatory status.
Hamilton Medical | HAMILTON-T1 Operator's Manual
151
7 Ventilation modes
Inspect mask fit and position
7.8.2 Setting up ASV on the ventilator
Inspect the mask position regularly and
To set up the ventilator using ASV
adjust as necessary. React promptly and
1.
Touch Modes.
appropriately to any alarms.
2.
Touch ASV, then touch Confirm
The ventilator’s VLeak parameter provides
3.
Set the controls as appropriate:
one indicator of mask fit.
- %MinVol: Set a value that results in
To verify that the mask fits properly,
the same minute volume as a previous
ensure that the leakage value shown in
mode, if applicable.
the Monitoring window (VLeak, MVLeak) is
- PEEP, Oxygen, Trigger, ETS, P-ramp:
acceptable.
Set according to clinical requirements
To monitor leakage during ventilation, set
and the patient condition.
the low limit of the Pressure alarm to a
4.
Review and adjust alarm limits.
value near the set pressure for ventilation
Set the high Pressure alarm limit to an
(PEEP/CPAP + ΔPinsp/ΔPsupport). When
appropriate value.
excessive leaks are present, the ventilator
may not be able to reach the set pressure,
The maximum peak pressure delivered
and generates an alarm.
in ASV (Plimit) is 10 cmH2O below the
high Pressure alarm limit or equal to
the Plimit setting.
7.8 Working with ASV
The maximum peak pressure for ASV
ASV is indicated for passive and spontane-
can be also set using the Plimit control
ously breathing adult and pediatric
in the Controls window.
patients.
Changing the Plimit value also
changes the high Pressure limit. For
7.8.1 Contraindications
details, see Section 5.6.1.
5.
Connect the patient to the ventilator
ASV and ASV 1.1 are contraindicated with
and start ventilation.
the following:
• Infants and neonates
The ventilator initiates several test breaths.
• If there is a high leakage (NIV or bron-
The device automatically selects the values
cho-pleural fistula)
for respiratory rate (fTotal), inspiratory
time (TI), and inspiratory pressure (ΔPinsp)
• Irregular respiratory drive (Cheyne-
based on the calculated IBW and as speci-
Stokes respiration)
fied in Table 7-3.
152
English | 10103179/02 USA
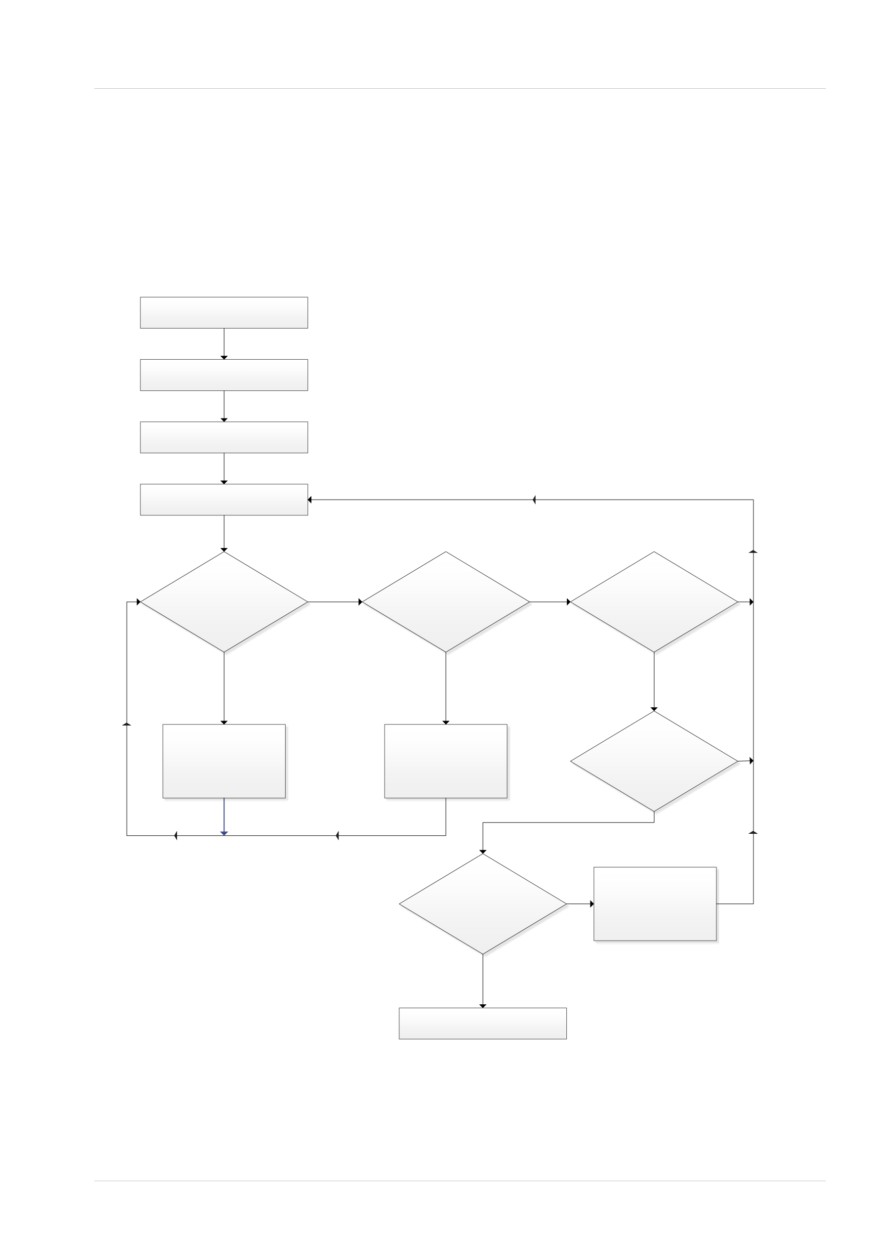
Clinical workflow with ASV
7
7.8.3 Clinical workflow with ASV
For technical specifications, see Section
15.10.
Figure 7-15 provides an overview of the
ASV clinical workflow.
Figure 7-15. Clinical use of ASV
Prepare ventilator for clinical use
Set controls as appropriate for patient
Set alarm limits appropriately
Ventilate patient for a period of time
NO
NO
Patient is stable*
NO
fSpont > fTarget +
fSpont = 0 AND
> 60 min
10b/min OR
PaCO2 < 45 mmHg?
(longer for hard-to-
PaCO2 > 45 mmHg?
wean patients)?
YES
YES
YES
Escalation
De-escalation
O2 < 40%
NO
%MinVol + 20%
%MinVol - 10%
AND
PEEP < 8 cmH2O
YES
Weaning
NO
ΔPinsp ≤ 10 cmH2O?
%MinVol - 10%
(limited to 25%)
* stable means fControl = 0 b/min AND
YES
PaCO2 ≤ 45 mmHg AND fSpont ~ fTarget
Consider extubation
Hamilton Medical | HAMILTON-T1 Operator's Manual
153
7 Ventilation modes
7.8.4 Maintaining adequate ventila-
Table 7-10. Blood gas and patient conditions
and possible adjustments for ASV
tion
Condition
%MinVol change
WARNING
Normal arterial
None
To change the minute volume setting,
blood gases
always use the %MinVol control. Do not
High PetCO2 or
Increase %MinVol
manipulate the patient height setting to
PaCO2
Pay attention to inspira-
achieve the desired IBW to control
tory pressures
minute volume.
Low PaCO2
Decrease %MinVol
Once ASV is started, the ventilator calcu-
Pay attention to mean
lates an optimal breath pattern and associ-
pressures and oxygena-
ated target values for tidal volume and
tion status
rate according to the rules in ASV and the
set %MinVol to achieve the targets.
High respiratory
Consider increase in
Depending on whether the patient is pas-
drive
%MinVol
sive or actively breathing, the ventilator
Consider sedation,
delivers pressure-controlled or pressure-
analgesia, or other treat-
supported breaths in compliance with a
ments
lung-protective strategy. For details, see
Section 7.8.8.4.
Low O2 satura-
None
tion
Consider increase in PEEP/
Once the calculated targets are reached,
CPAP and/or Oxygen
the result of the ventilation needs to be
assessed. All monitored parameters can be
used for this purpose.
7.8.5 Reviewing alarm settings
However, to assess respiratory acid-base
It is not possible to select a %MinVol that is
status, it is recommended that arterial
incompatible with the lung-protective
blood gases be measured and minute
rules that govern ASV (for a detailed
ventilation be adjusted accordingly.
description, see Section 7.8.8.4). As a con-
sequence, ASV tries to achieve the maxi-
Table 7-10 provides examples of how to
mum possible ventilation and activates the
adjust the %MinVol setting.
ASV: Cannot meet target alarm.
154
English | 10103179/02 USA
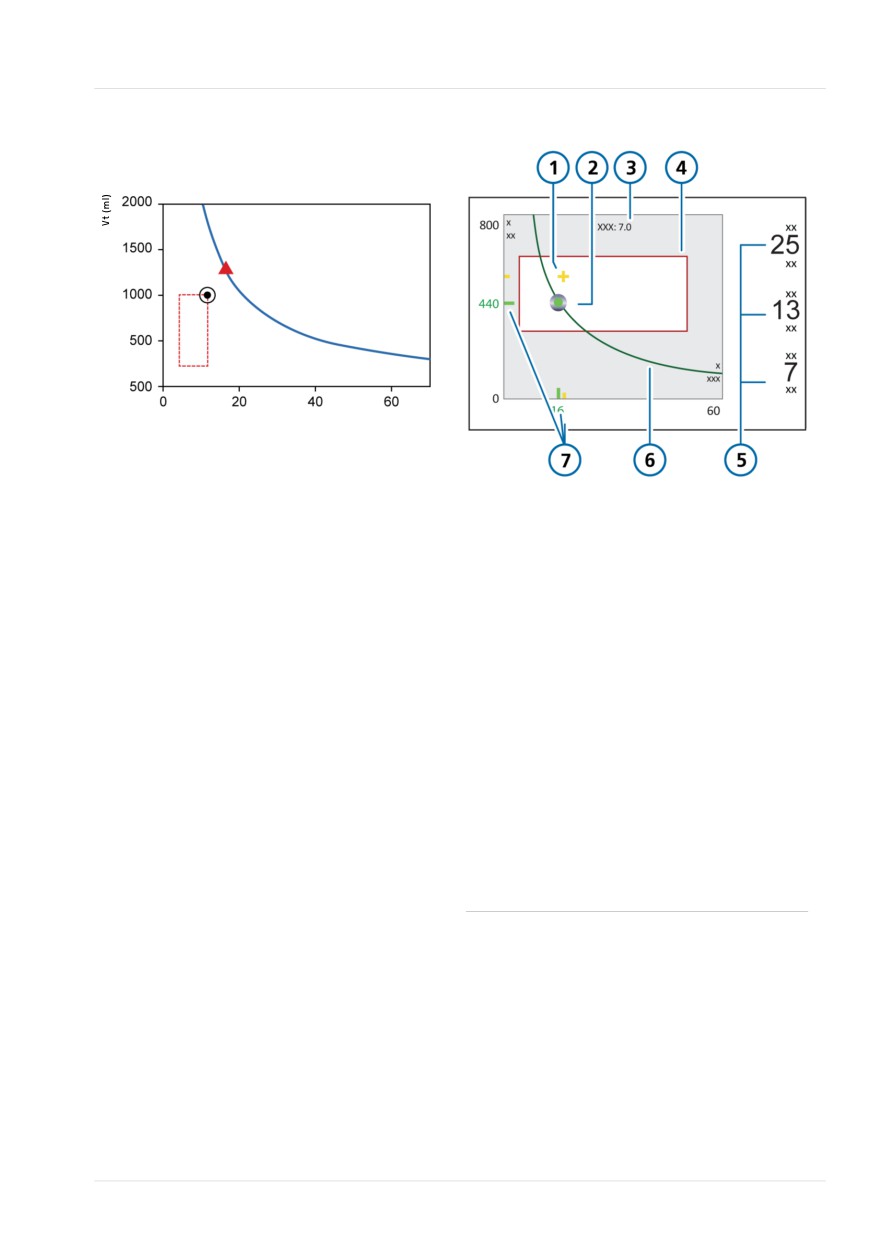
Monitoring ASV
7
Figure 7-16. Example of high %MinVol setting
Figure 7-17. ASV Graph panel
incompatible with the lung-protective rules
strategy
f (b/min)
7.8.6 Monitoring ASV
1
Patient symbol:
5
ΔPinsp: Inspira-
ASV interacts with the patient continu-
intersection of
tory pressure set
ously. Whenever the patient’s respiratory
current measured
by ventilator
mechanics change, ASV adjusts to this
tidal volume and
fControl: Machine
change. Whenever the patient’s breathing
rate
rate
activity changes, ASV adjusts the settings.
fSpont: Sponta-
The ASV graph, shown in Figure 7-17, pro-
neous breath rate
vides a real-time graphical view of the
2
Target point:
6
Minute volume
patient status relative to the set target. For
Intersection of
curve
details about the graph, see Section 8.4.3.
target tidal
For details on displaying the ASV graph and
volume and
ASV monitoring values, see Section 8.4.
target rate
3
Target minute
7
Current measured
To monitor progress over time, it is recom-
volume
point (in yellow)
mended that you plot trends for ΔPinsp,
and target value
fTotal, and fSpont. Review these trends,
(in green)
together with the %MinVol setting to gain
4
Safety frame
insight into the patient's ventilatory status.
Table 7-11 provides interpretations of typi-
cal ventilatory patterns.
Hamilton Medical | HAMILTON-T1 Operator's Manual
155
7 Ventilation modes
7.8.7 Weaning
The weaning progress can be monitored
in the trends display when inspiratory
Weaning patients from the ventilator is a
pressure (ΔPinsp), total rate (fTotal), and
clinical task that requires experience and
spontaneous rate (fSpont) are plotted.
involves more than just ventilation issues.
This section does not intend to provide
It may be necessary to reduce the %MinVol
clinical information other than that
setting to 70% or even lower to “moti-
needed to operate the ventilator using
vate” the patient to resume spontaneous
ASV mode.
breathing. If a patient can sustain minutes
or even hours with a low %MinVol setting,
ASV always allows patients to take sponta-
it does not mean that weaning is
neous breaths. Episodes of spontaneous
complete. In fact, the %MinVol setting
breathing can occur and are supported by
must always be interpreted in conjunction
ASV even within a period of fully control-
with the level of ΔPinsp needed to achieve
led ventilation. In other words, weaning
the set minute ventilation. Only if ΔPinsp
can start with ASV so early that it may go
and fControl are at their minimum values
unrecognized clinically. It is therefore
can weaning be assumed to be complete.
important to monitor the spontaneous
efforts of the patient over time.
Table 7-11. Interpretation of breathing pattern at lower than 100 %MinVol setting
ΔPinsp
fControl
fSpont
Interpretation
> 10
> 10
0
Danger of hypoventilation. Check arterial blood
gases and consider increasing %MinVol.
> 10
0
Acceptable
Enforced weaning pattern. Check arterial blood
gases and patient respiratory effort. Consider
decreasing or increasing %MinVol accordingly.
< 8
0
Acceptable
Unsupported breathing. Consider extubation.
> 10
0
High
Dyspnea. Consider increasing %MinVol and other
clinical treatments. Check for autotriggering.
156
English | 10103179/02 USA
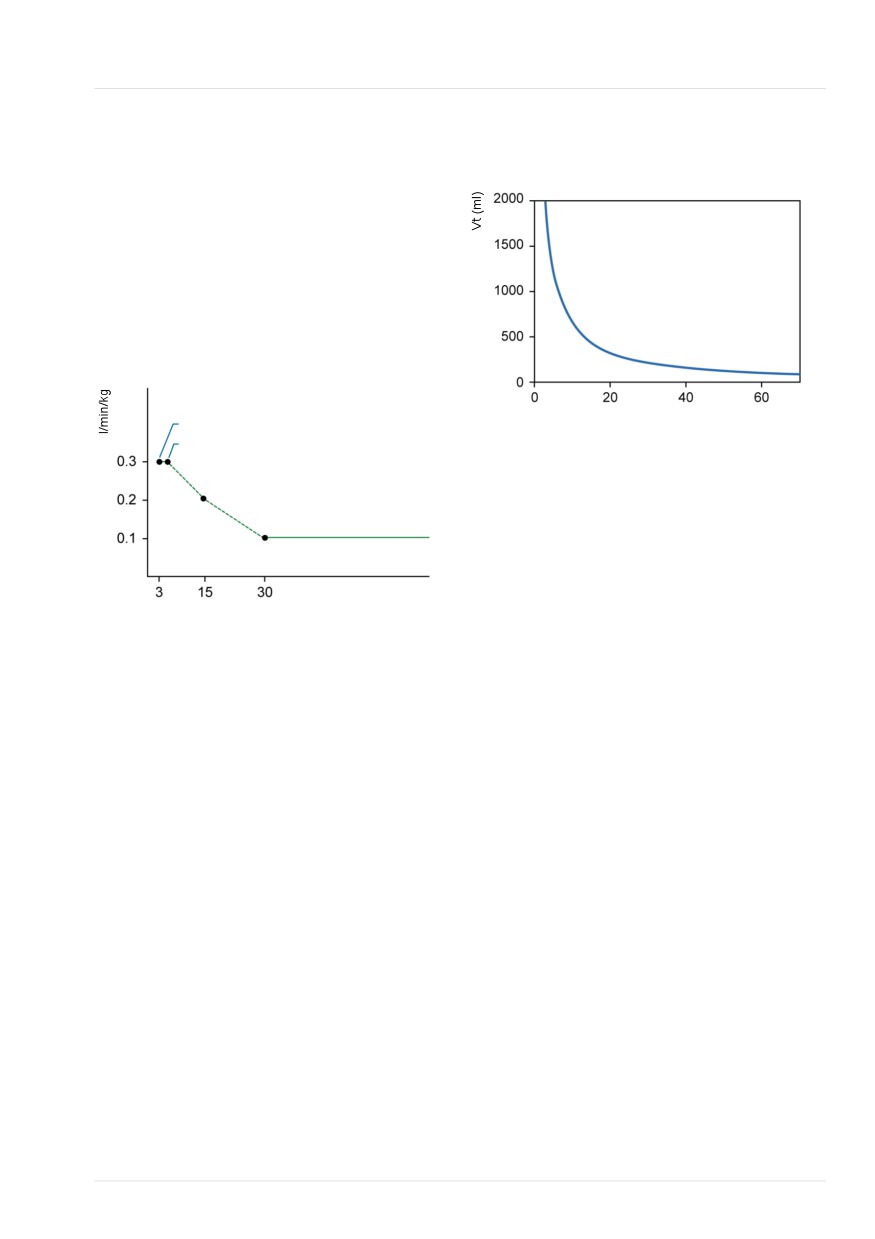
Functional overview
7
7.8.8 Functional overview
7.8.8.3 Targeted minute ventilation
The following sections provide a brief
Figure 7-19. MinVol = 7 l/min
overview of how ASV manages ventilation.
7.8.8.1 Normal minute ventilation
ASV defines normal minute ventilation
according to the graph in Figure 7-18.
Figure 7-18. Normal minute ventilation as a
function of ideal body weight (IBW)
f (b/min)
3 kg
5 kg
7.8.8.4 Lung-protective strategy
Not all combinations of Vt and f shown in
Figure 7-19 are safe for the patient. The
high tidal volumes will overdistend the
lungs, and the small tidal volumes cannot
IBW (kg)
produce alveolar ventilation at all.
Another risk lies in inadequate respiratory
7.8.8.2 Compensation for changes in
rates. High rates can lead to dynamic
apparatus dead space
hyperinflation or breath stacking, resulting
Dead space is calculated as 2.2 ml per kg.
in AutoPEEP. Low rates can lead to
This dead space is a nominal value that is
hypoventilation and apnea. Therefore, it is
valid, on average, for intubated patients
necessary to limit the number of possible
whose endotracheal tube is connected to
combinations of Vt and f.
the Y-piece of the ventilator by a standard
When limits are imposed on the possible
catheter mount.
combinations of Vt and f, ASV uses a dou-
ble strategy:
Changes in alveolar dead space due to
ventilation/perfusion mismatch must be
• The operator input for ASV determines
compensated using the %MinVol control.
the absolute boundaries.
If this dead space is altered by an artificial
• Internal calculations based on patient
airway configuration, such as the use of a
measurements further narrow the limits
heat and moisture exchanging filter
to counteract possible operator errors
(HMEF) or nonstandard tubing, modify the
and to follow changes of respiratory
%MinVol setting to take into account the
system mechanics.
added or removed dead space.
The effect of the strategy is shown in
Figure 7-20 and explained in the subse-
quent sections.
Hamilton Medical | HAMILTON-T1 Operator's Manual
157
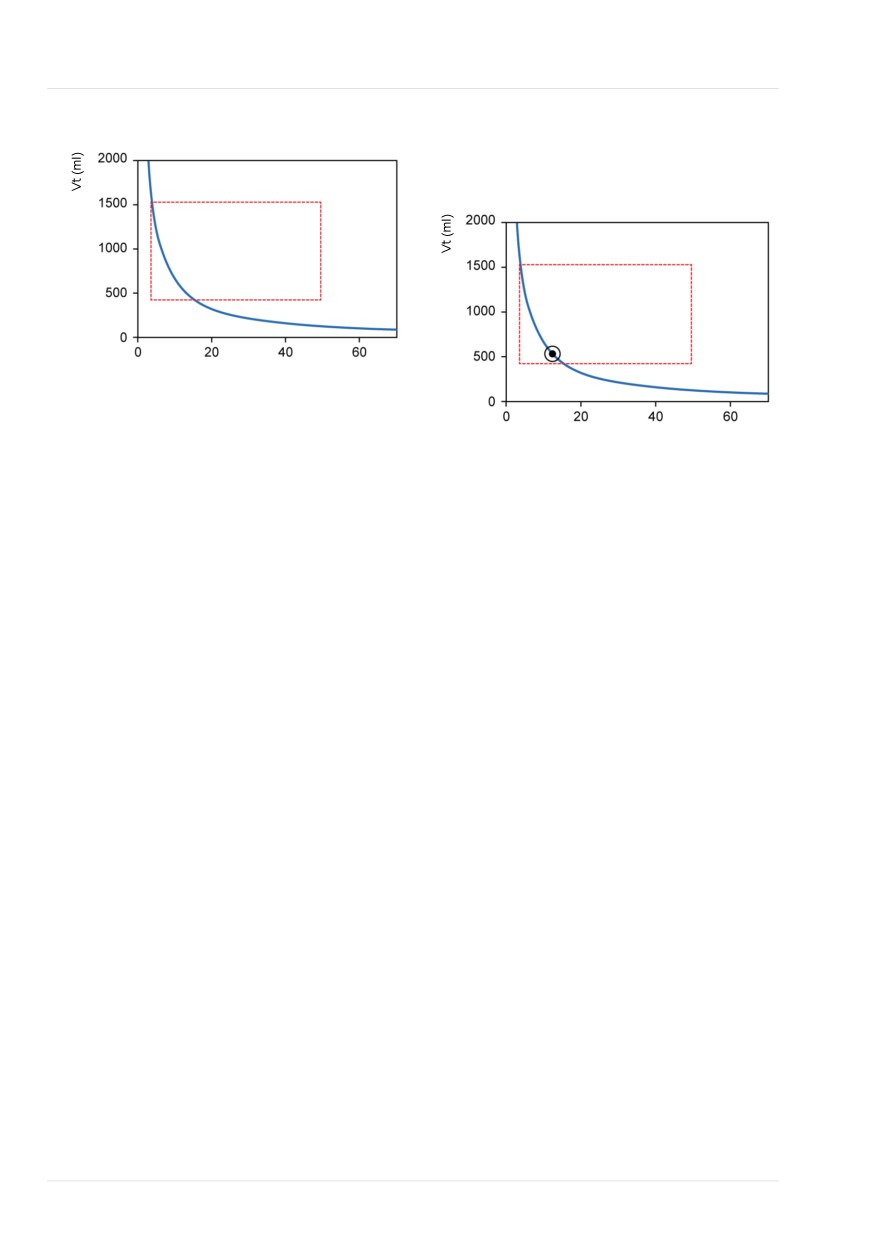
7 Ventilation modes
Figure 7-20. Lung-protective rules strategy
7.8.8.5 Optimal breath pattern
Figure 7-21. Anatomy of the ASV target graph-
A
ics window
D
C
B
f (b/min)
A: High tidal volume limit
f (b/min)
The tidal volume applied by ASV is limited
(see A in Figure 7-20) by three operator
7.8.8.6 Initial breaths: How ASV starts
settings: high Pressure alarm limit, high Vt
alarm limit, and patient height.
How do you achieve the target values for
Note the following:
a given patient if you do not know
whether or not the patient can breathe
•
You must set the high Pressure limit
spontaneously? For this purpose, ASV uses
before connecting a patient to the
a predefined rate according to the calcu-
ventilator. The maximum pressure
lated IBW (Table 7-3).
applied in the ASV mode is 10 cmH2O
below the high Pressure alarm limit.
Patient-triggered breaths are pressure sup-
ported and flow cycled.
•
Additionally, the target volume is lim-
ited to 150% of the high Vt alarm limit,
If the patient does not trigger the breath,
and pressure support is limited such
the delivery of the breath is time cycled,
that the inspired volume does not
with a preset pressure.
exceed the high Vt alarm limit in
The following controls are operator-set
mechanical breaths for more than a
(manual):
few breaths.
• PEEP/CPAP
•
If you set the Pressure alarm limit to a
very high pressure, say 60 cmH2O, the
• Oxygen
target volume is limited by the second
• P-ramp
criterion: 15 ml/kg.
• ETS
•
Check the Vt high setting to make sure
the target minute ventilation can be
• Trigger type and sensitivity
reached in passive patients.
158
English | 10103179/02 USA
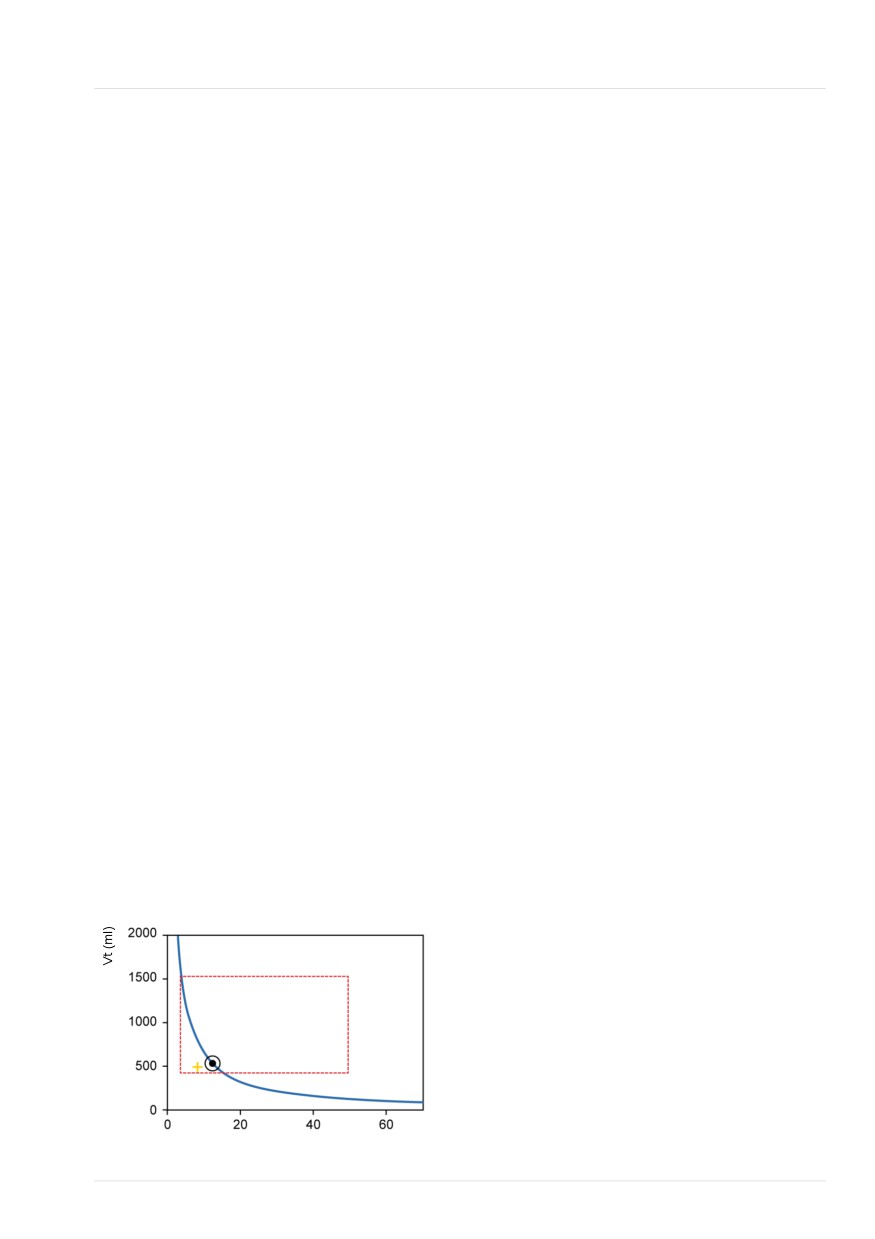
Approaching the target
7
The following controls are adjusted auto-
The patient symbol marks the actual mea-
matically by ASV, and cannot be adjusted
sured value for Vt and Rate.
by the operator:
To achieve the target, ASV uses the follow-
• Mandatory breath rate: to change total
ing strategy:
respiratory rate
• If actual Vt < target Vt, the inspiratory
• Inspiratory pressure level: to change
pressure is increased.
inspiratory volume
• If actual Vt > target Vt, the inspiratory
• Inspiratory time: to allow gas flow into
pressure is decreased.
the lungs
• If actual Vt = target Vt, the inspiratory
• Startup breath pattern
pressure is left unchanged.
• If actual rate < target rate, the fControl
To safely start ASV, you set the patient
rate is increased.
height and sex, which are then used to
calculate the IBW.
• If actual rate > target rate, the fControl
rate is decreased.
Upon starting ventilation, after some initial
test breaths are delivered, the resulting
• If actual rate = target rate, the fControl
rate and tidal volume are measured and
rate is left unchanged.
compared with the target values. ASV then
responds to the differences between the
As a result, the patient symbol in Figure
current and target tidal volumes, as well
7-22 moves toward the circle. The current
as the current and target rates.
Vt is calculated as the average of inspira-
tory and expiratory volumes. This defini-
tion compensates in parts for leaks in the
7.8.8.7 Approaching the target
breathing circuit, including the endotra-
Figure 7-22 shows a possible scenario
cheal tube.
after the initial test breaths. The current
breath pattern, which is plotted as the
7.8.8.8 Dynamic adjustment of lung
patient symbol, shows clear deviation
protection
from the target. ASV's task is to move the
patient symbol as close to the circle as
The operator preset values are not
possible.
changed by ASV, and the corresponding
safety limits remain as defined in the pre-
Figure 7-22. Example after three initial breaths
vious sections. However, if the respiratory
system mechanics change, the safety limits
change accordingly, as defined in Section
7.8.8.4. The safety limits are updated on a
breath-by-breath basis.
For example, if the lungs stiffen, the high
Vt limit is lowered proportionally, and the
high rate limit is increased.
f (b/min)
Hamilton Medical | HAMILTON-T1 Operator's Manual
159
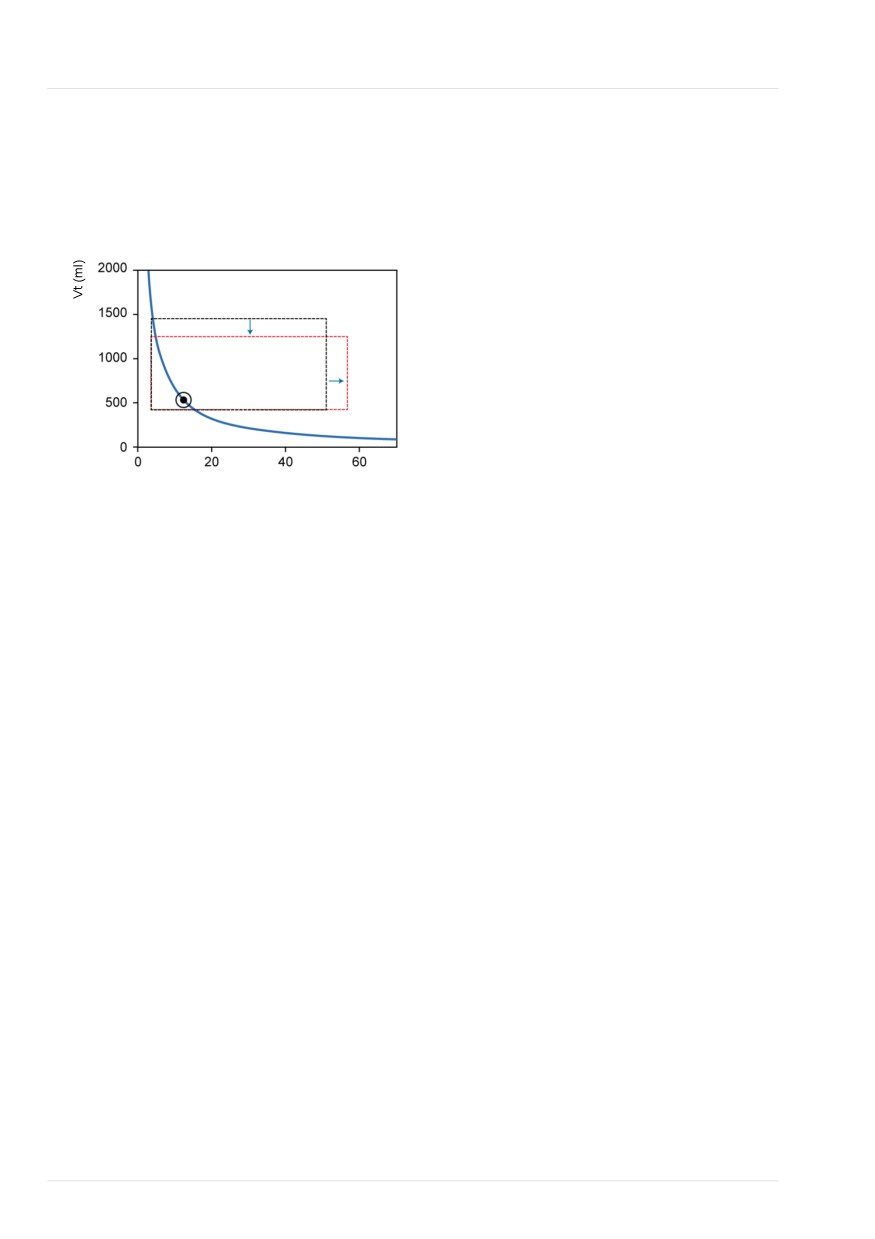
7 Ventilation modes
This dynamic adjustment ensures that ASV
applies a safe breathing pattern at all
times. In graphical terms, the dotted rec-
tangle changes as shown in Figure 7-23.
Figure 7-23. Lung-protective limits
f (b/min)
Lung-protective limits are changed dynam-
ically and according to the respiratory
system mechanics.
However, the limits set by the operator are
never violated.
7.8.8.9 Dynamic adjustment of optimal
breath pattern
After it is calculated, the optimal breath
pattern is revised with each breath accord-
ing to the RCexp measurements. A new
target breathing pattern is calculated
using ASV algorithms. The targets do not
change under steady-state conditions.
However, if the patient‘s respiratory
system mechanics change, the target
values also change.
160
English | 10103179/02 USA
8
Monitoring ventilation
8.1
Overview
162
8.2
Viewing numeric patient data
162
8.3
Viewing graphical patient data
163
8.4
Working with Intelligent panels
169
8.5
About the monitored parameters
174
8.6
Viewing patient ventilation time
183
8.7
Viewing device-specific information
183
161
8 Monitoring ventilation
8.1 Overview
8.2 Viewing numeric patient
data
You can configure how to view patient
data during ventilation, including viewing
Numeric patient data is readily available as
data numerically and graphically in a com-
follows:
bination of waveforms, loops, trends, and
• The main display prominently shows
Intelligent Panel graphics to suit your insti-
the configured main monitoring para-
tution’s needs (Figure 8-1).
meters (MMPs). See Section 8.2.1.
Data is also available in the Monitoring
• The Monitoring window provides access
window, which you can access at any time
to all of the parameter data. See
without affecting breath delivery.
Section 8.2.2.
For the list of monitored parameters, see
Section 8.5.
8.2.1 About the main monitoring
parameters (MMP)
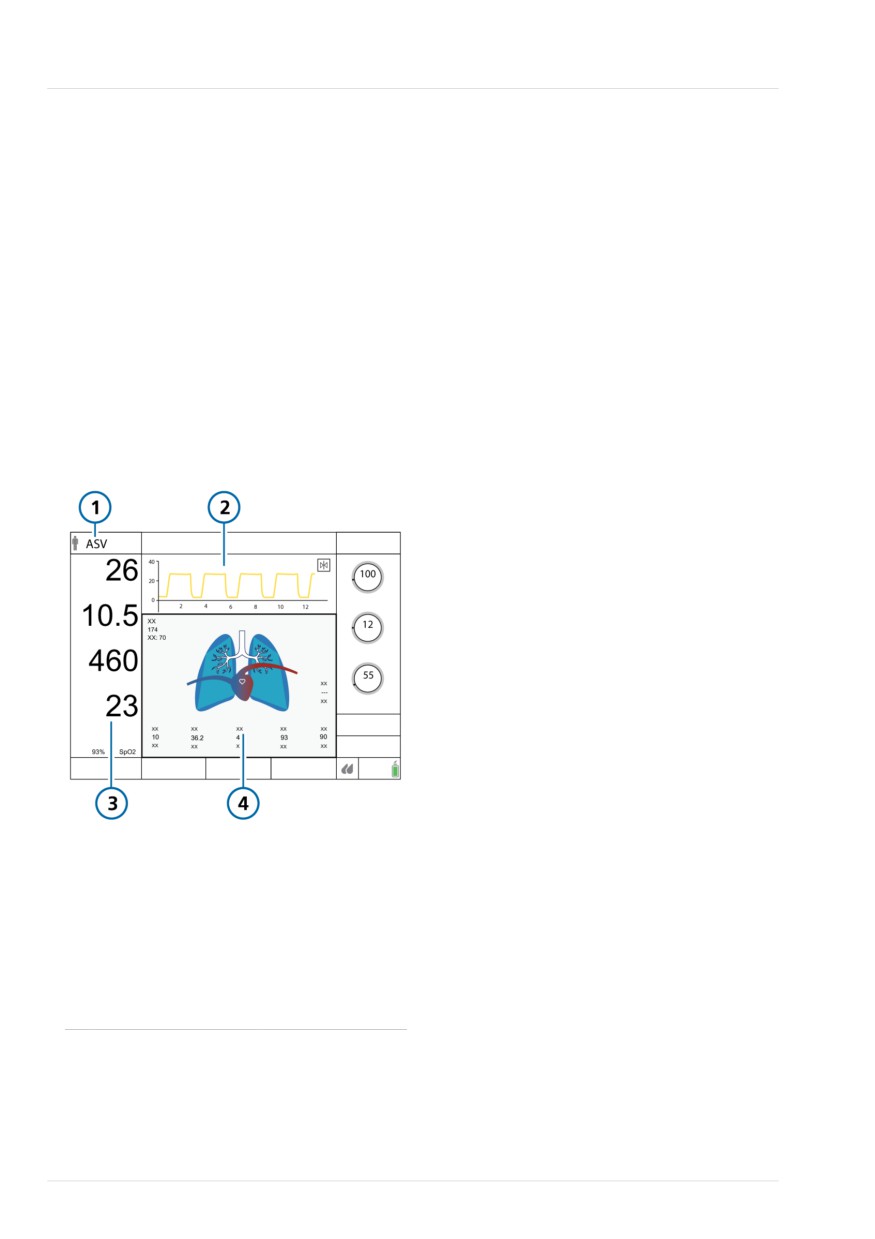
Figure 8-1. Main display
The MMPs are the numerical monitoring
parameters shown on the left side of the
display. Every displayed parameter shows
the following elements: the current value,
name, and unit of the monitoring para-
meter.
The MMPs that are displayed, as well as
their sequence on the display, can be
changed in Configuration (Section 13.5).
Any of the monitored parameters can be
displayed as an MMP. As a result, MMPs
may differ between individual ventilators.
An MMP is normally displayed in white.
When directly related to an active alarm,
1
Current mode
3
Main monitoring
the MMP is shown in yellow or red, corre-
parameters
sponding to the alarm priority. In addition,
(MMP) (Section
a colored bar appears to the right of the
8.2.1)
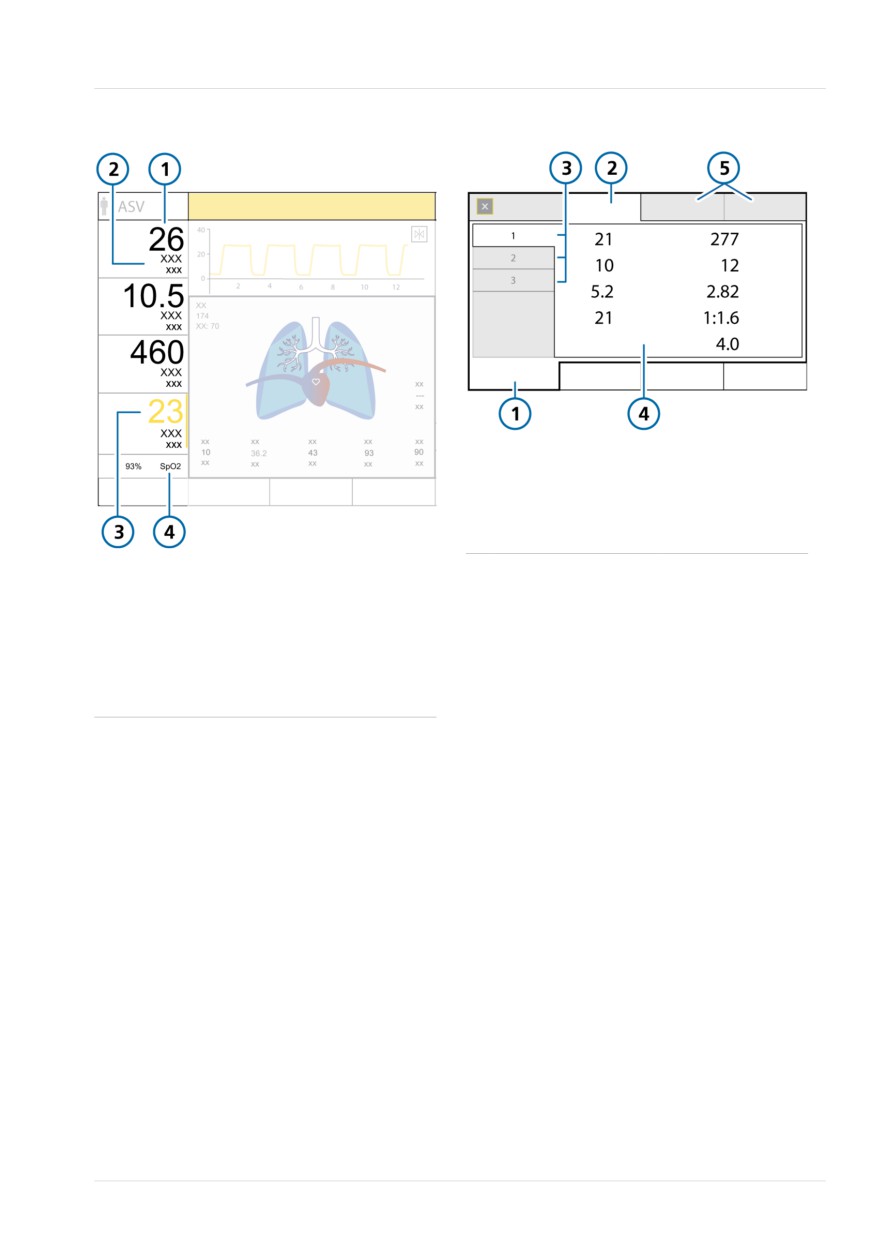
affected MMP (Figure 8-2). After the
alarm resets, the affected MMP returns to
2
Pressure/time
4
Graphic display,
white and the bar is removed.
waveform, con-
configurable
figurable (Section
(Section 8.3)
8.3.2)
162
English | 10103179/02 USA
Viewing patient data in the Monitoring window
8
Figure 8-2. MMP components
Figure 8-3. Monitoring > General window
1
Monitoring
4
Parameter values
2
General
5
CO2 and SpO2
(if enabled)
3
1, 2, 3 tabs
1
MMP value
3
Parameter associ-
ated with an
8.3 Viewing graphical patient
active alarm
data
2
Parameter name/
4
Measured SpO2
units
value*
The HAMILTON-T1 can show waveforms,
as well as graphic and Intelligent panels
* If SpO2 sensor is enabled and connected
on the lower portion of the display.
The following table shows the options for
8.2.2 Viewing patient data in the
each graphic type.
Monitoring window
The Monitoring window provides access to
monitored parameter data as follows:
• The General tab (Figure 8-3) provides
access to ventilation parameter values.
• When enabled, the CO2 and SpO2 tabs
provide access to CO2- and SpO2-rela-
ted data, respectively.
Hamilton Medical | HAMILTON-T1 Operator's Manual
163
8 Monitoring ventilation
Table 8-1. Graphical view options
2. Touch the desired option to select it,
or touch a tab (Trends, Loops, Graph-
Graphic type/Options
ics, Waveforms) to access additional
options.
Waveforms (data values plotted against time)
• Pressure
• PCO256
After making a selection, the window
closes automatically, and the display
• Flow
• FCO256
adjusts to the new selection.
• Volume
• Plethysmogram57
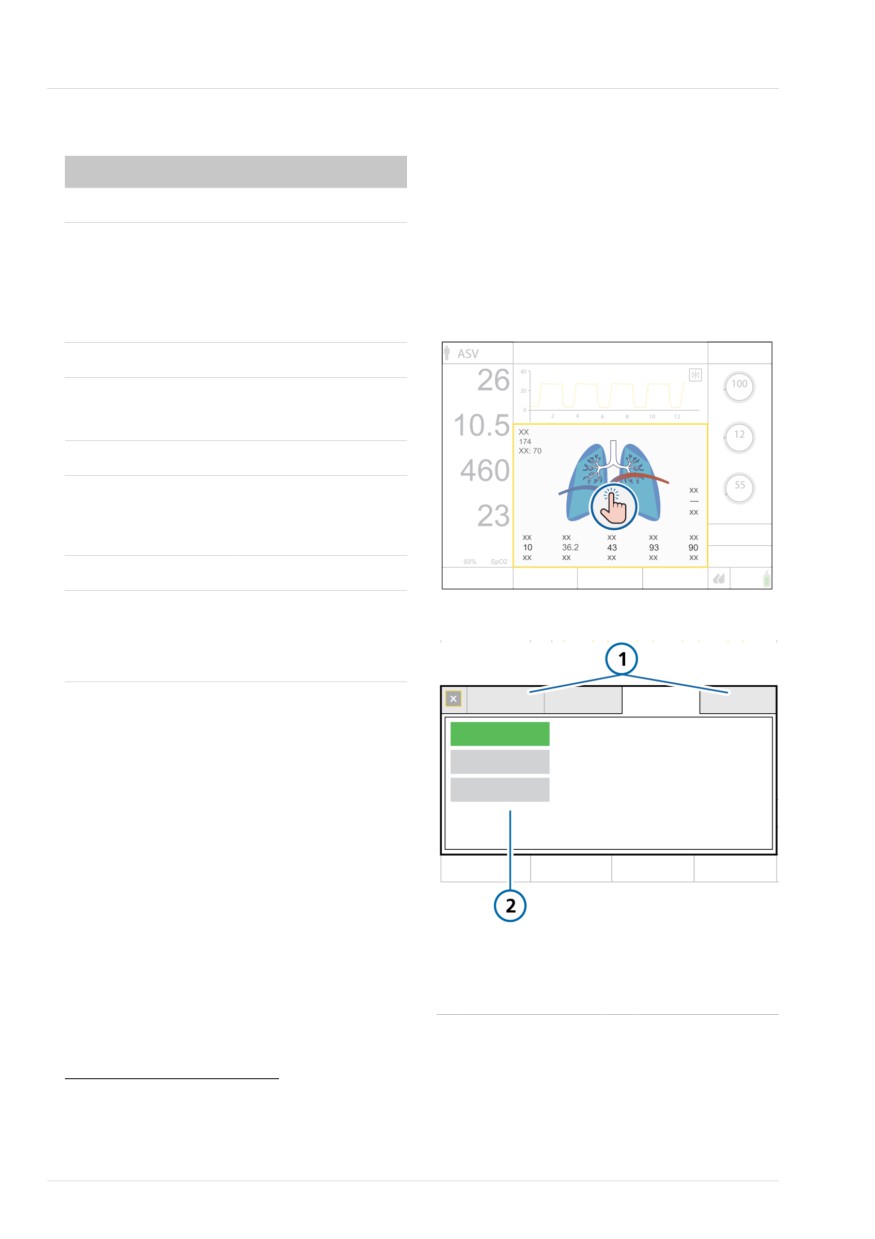
Figure 8-4. Selected panel outlined in yellow
• Off
Graphics (Intelligent panels)
• Dynamic Lung58
• ASV Graph59
• Vent Status
Trends
1-, 6-, 12-, 24-, or 72-h60 trend data for a
selected parameter or combination of para-
meters
Loops
• Pressure/Volume
• Volume/PCO256
Figure 8-5. Graphics selection window
• Pressure/Flow
• Volume/FCO256
• Volume/Flow
8.3.1 Selecting display options
You can change the graphics at any time.
To change the contents of a graphic panel
or waveform
1. Touch the area of the display to
change.
The selected panel is highlighted in
yellow (Figure 8-4).
The graphics selection window
1
Trends, Loops,
2
Available options
appears, displaying the current selec-
Graphics, Wave-
tion (Figure 8-5).
forms
56 CO2 option required.
57 SpO2 option required.
58 Only for adult/pediatric patients.
59 Only in ASV mode.
60 72-hour trend not available in all markets
164
English | 10103179/02 USA
Working with waveforms
8
8.3.2 Working with waveforms
8.3.2.3 Displaying waveforms
The ventilator can plot pressure, volume,
You select options in the Waveforms
and flow against time, in addition to other
window.
data as listed in Table 8-1.
Figure 8-7. Graphics selection > Waveforms
The waveforms provide an ongoing real-
window
time graphical view of the selected para-
meters over multiple breaths. As a result,
they also provide a way to assess the
numerical monitored parameter values.
8.3.2.1 Waveform views
You can show up to three waveforms on
the display. For details, see Section
8.3.2.3.
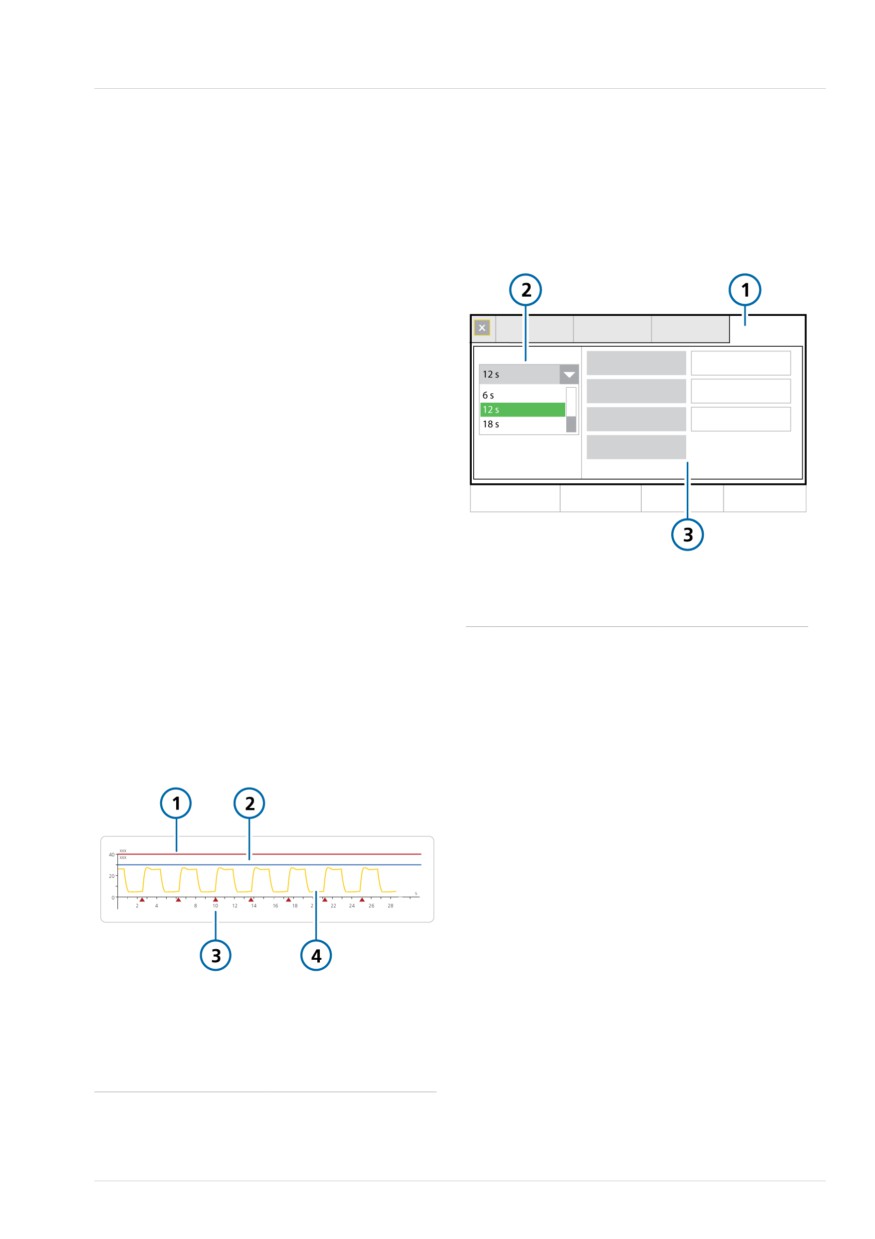
8.3.2.2 About the Pressure/time (Paw)
graph
1
Waveforms
3
Available options
The blue pressure limit line shows the
maximum pressure that the ventilator will
2
Time scale
apply, which you can set using the Plimit
control. The high Pressure alarm limit is
To select a waveform
shown as a red line. The high Pressure
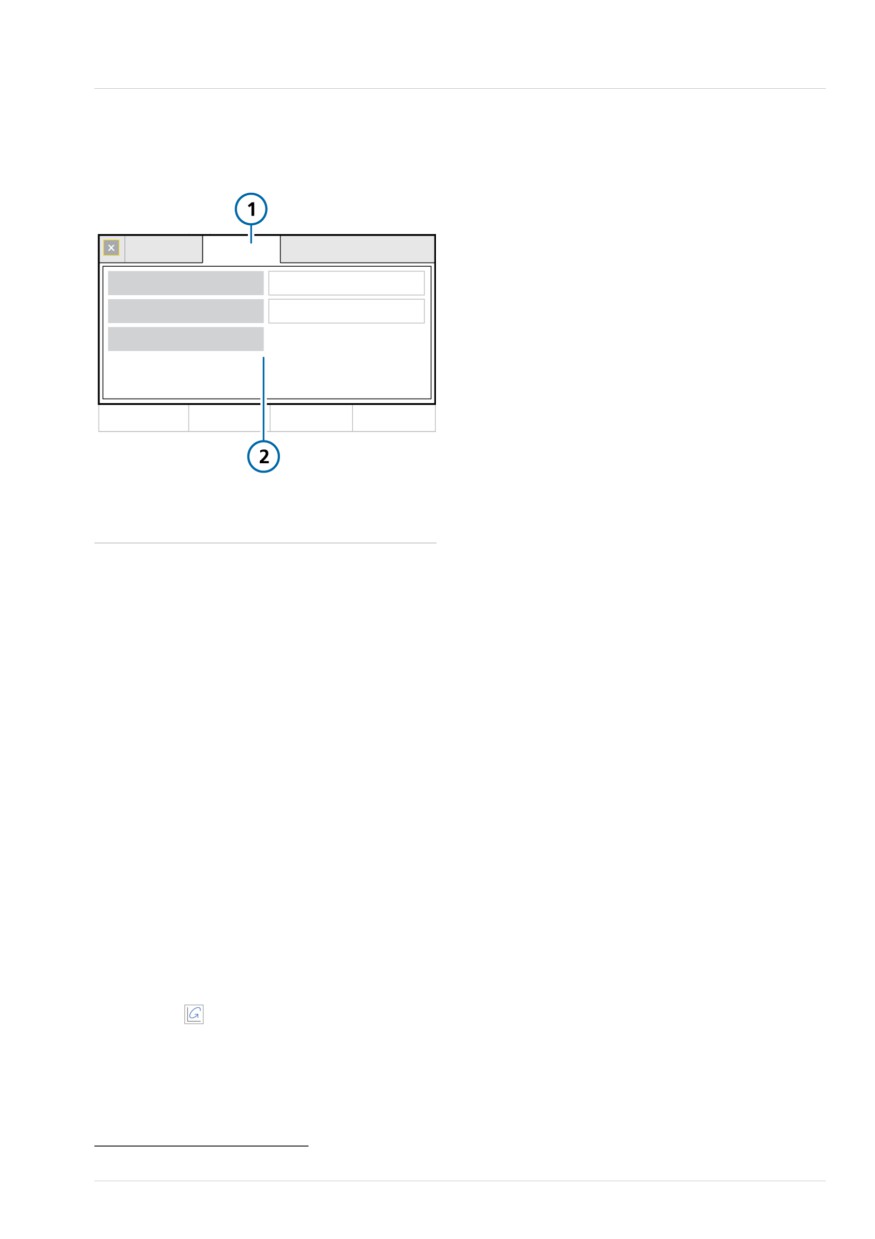
alarm limit is always 10 cmH2O greater
1. Touch the area of the display where
than Plimit.
you wish to show a waveform or
touch the waveform to change
Figure 8-6. Pressure/time graph
(Section 8.3.1).
The graphics selection window
appears (Figure 8-5).
2. If needed, touch the Waveforms tab.
3. If needed, change the time scale to
apply to all waveforms.
4. Touch the waveform type to display.
To leave the area blank, touch Off.
You must display at least one wave-
1
High Pressure
3
Patient trigger
form in the top portion of the display.
alarm limit
indicator
Once the selection is made, the
2
Plimit
4
Airway pressure
window closes and the selected wave-
(Paw) waveform
form is displayed.
Hamilton Medical | HAMILTON-T1 Operator's Manual
165
8 Monitoring ventilation
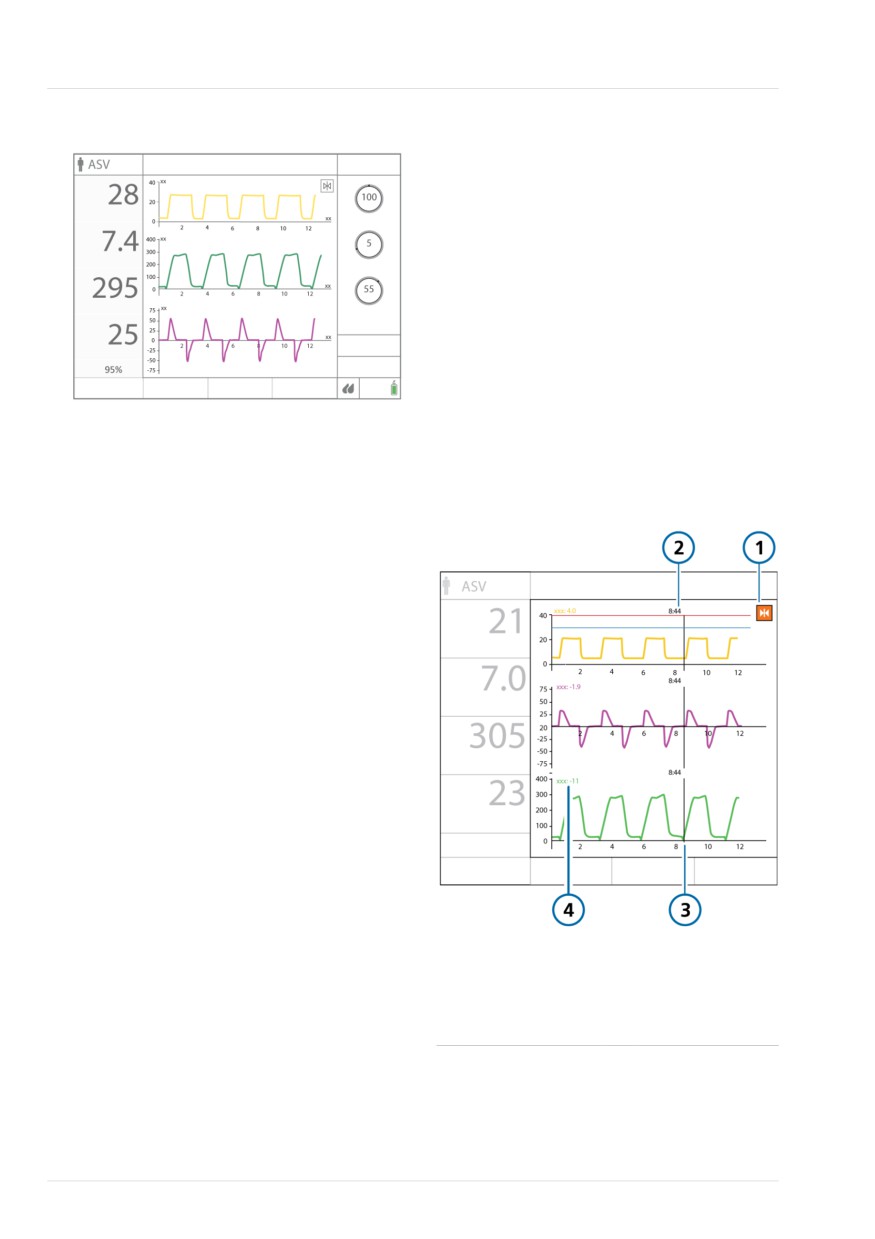
Figure 8-8. Waveform display
8.3.2.5 Freezing and reviewing waveforms
and trends
You can temporarily freeze the display of
waveforms and trends. After 30 seconds
of inactivity, they are automatically
unfrozen.
When Freeze is enabled, any displayed
waveforms and trend graphs are frozen,
allowing you to scroll through them for a
detailed review. The Freeze function is
time-synced across the displayed graphs.
Note that when Freeze is enabled, all of
8.3.2.4 Changing the waveform time scale
the elements on the display are unavail-
able.
Scaling refers to the values of the x- and y-
axis of a waveform or a loop. In the wave-
Figure 8-9. Freezing waveforms
forms displayed on the ventilator, the x-
axis represents time, while the y-axis can
represent a variety of parameters, includ-
ing pressure, flow, or volume.
You can set the time scale (x-axis values)
of the waveforms; your selection applies
to all displayed waveforms.
A scale value refers to the length of the
x-axis. For example, a scale value of 24
means that the x-axis displays the wave-
form from 0 to 24 seconds.
The HAMILTON-T1 offers the following
time scale options, in seconds:
• Adult/Ped: 6, 12, 18, 24, 30
• Neonatal: 3, 6, 12, 18, 24
To change the time scale
1
Freeze button
3
Cursor
4 In the Waveforms window, touch the
2
Time at cursor
4
Value at cursor
Time scale arrow (Figure 8-7) and
(same color as the
select the time scale to use.
waveform)
Your selection applies to all displayed
waveforms.
166
English | 10103179/02 USA
Working with Trend graphs
8
To freeze waveforms and trends
For details on freezing a trend, see the
previous section.
1. Touch the Freeze button (1 in Figure
8-9).
Most monitoring parameters can be
Any displayed waveforms and Trend
trended. The following parameters are
graphs are frozen, and cursor bars are
trended in combination: Ppeak/PEEP,
displayed.
ExpMinVol/MVSpont, fTotal/fControl,
VDaw/VTE, VTE/Vtalv, and SpO2/Oxygen
2. To scroll through the graphics for
analysis, turn the P&T knob clockwise
and SpO2/FiO2 (if supported on your
or counter-clockwise.
device).
The cursor bars move to the right and
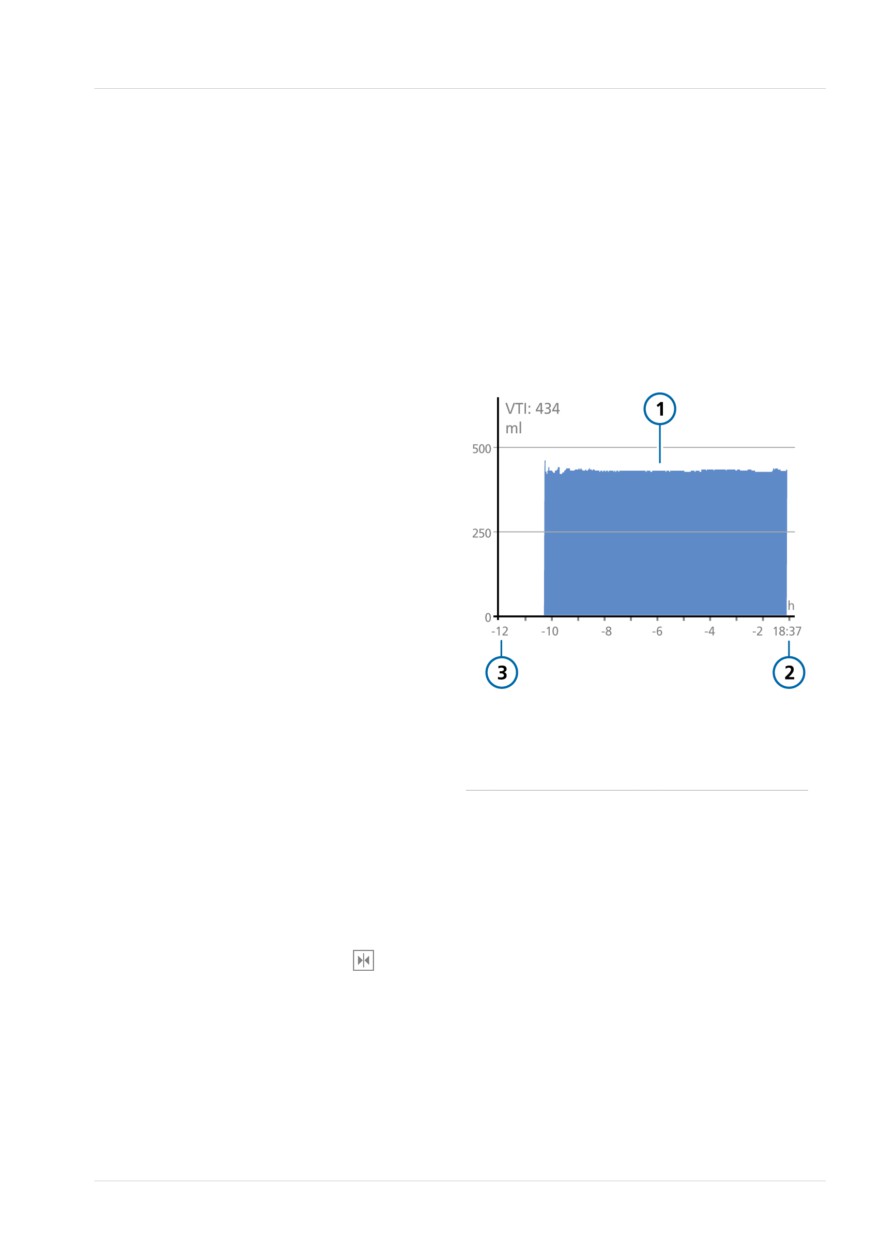
Figure 8-10. Trend panel
to the left.
3. To unfreeze the display, touch the
Freeze button again or press the P&T
knob.
The display returns to displaying real-time
data and all of the elements on the display
are available.
8.3.3 Working with Trend graphs
Trend data includes all data since the
ventilator was turned on for a selected
parameter for the past 1, 6, 12, 24, or
72 hours.
1
Trend graph
3
Elapsed time rela-
From the time the ventilator is turned on,
tive to present
it continuously stores up to 72 hours of
2
Current time
monitored parameter data in its memory,
including when in Standby. This data is
deleted upon setting up a new patient.
You can also freeze trend graphs and
examine them more closely. When trends
are frozen, the panel shows the time and
the corresponding value of the monitored
parameter. For details on using
(Freeze) to freeze trends, see Section
8.3.2.5.
Hamilton Medical | HAMILTON-T1 Operator's Manual
167
8 Monitoring ventilation
8.3.3.1 Displaying trends
8.3.4 Working with loops
Figure 8-11. Graphics selection > Trends
The HAMILTON-T1 can display a dynamic
window
loop based on the parameter combina-
tions listed in Table 8-1.
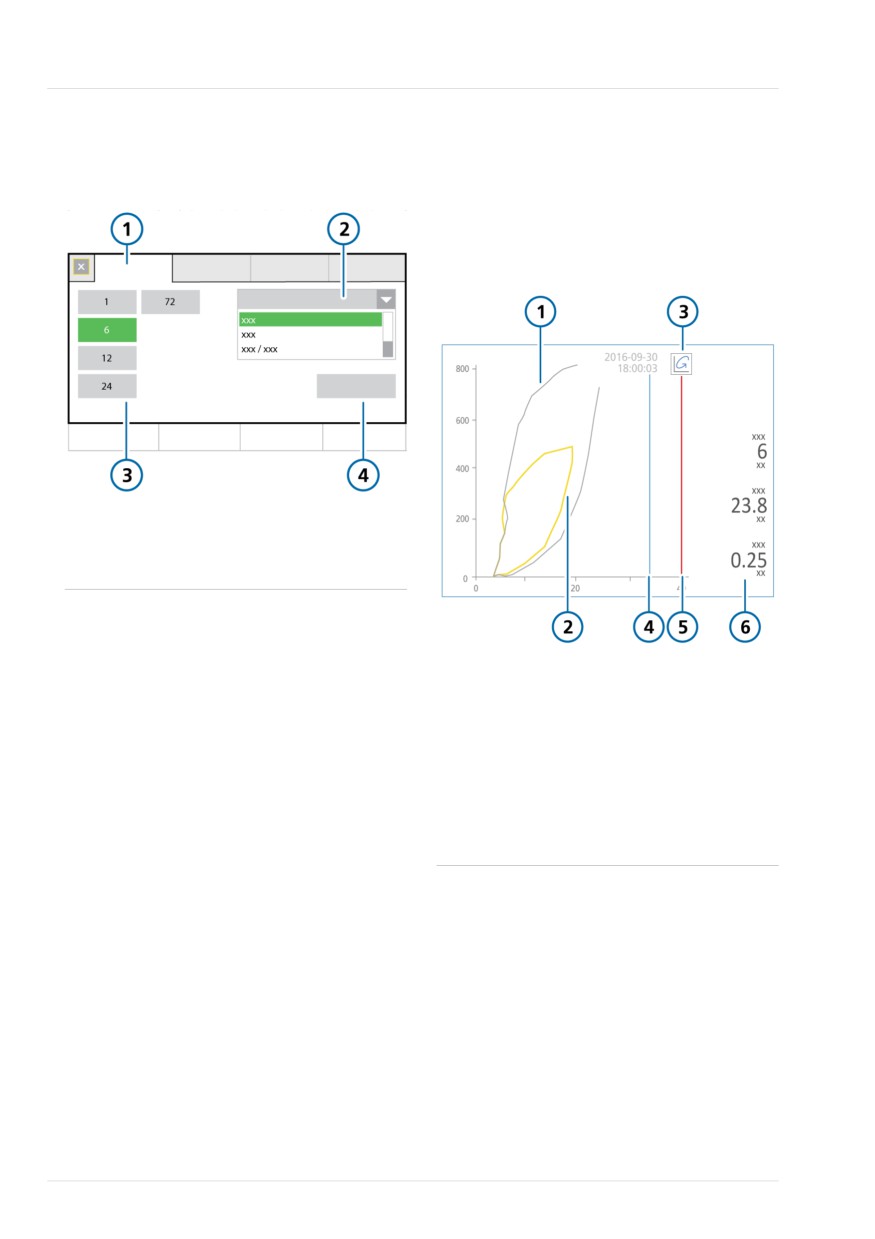
Figure 8-12. Loops panel, Pressure/Volume loop
displayed
1
Trends
3
Trend time, in
hours
2
Parameter list
4
Confirm
To display trends
1. Touch the graphics area at the bottom
1
Stored reference
4
Plimit (high Pres-
half of the display (Section 8.3.1).
loop
sure alarm limit -
2. In the graphics selection window,
10 cmH2O)*
touch the Trends tab (Figure 8-11).
2
Current loop
5
High Pressure
3. Select the parameter(s) to trend.
alarm limit*
3
Loop reference
6
Key parameters
4. Touch the desired trend time.
button
5. Touch Confirm.
* Displayed if applicable
The selected trend information is displayed
(Figure 8-10).
168
English | 10103179/02 USA
Displaying loops
8
8.3.4.1 Displaying loops
The previous and current characteristics
are shown. Any previously stored loop is
Figure 8-13. Graphics selection > Loops window
discarded.
8.4 Working with Intelligent
panels
You can show any of the following Intelli-
gent panels on the ventilator display:
• Dynamic Lung
• Vent Status
• ASV Graph
The Intelligent panels are all displayed
using the graphics selection window
1
Loops
2
Parameter
Graphics tab.
options
8.4.1 Dynamic Lung panel: real-time
To display loops
ventilation status
1. Touch the graphics area at the bottom
The Dynamic Lung61 shows an up-to-date
half of the display (Section 8.3.1).
visual representation of key ventilation
2. In the graphics selection window,
data (Figure 8-14). It visualizes tidal
touch the Loops tab.
volume, lung compliance, patient trigger-
3. Touch the parameter combination to
ing, and resistance in real-time.
display.
In addition to the graphic representation,
The selected combination is displayed
the panel shows numeric data for key
(Figure 8-12).
parameters. If all values are in a normal
range, the panel is framed in green.
8.3.4.2 Storing loops
The Dynamic Lung comprises the following
components:
You can store a loop to use as a reference,
for comparison purposes.
• Mechanical breath
• Respiratory compliance
To store a new loop
• Airway resistance
4 In the Loop display (Figure 8-12),
touch
(Loop reference) to store
• Patient triggering
the loop curve with the current date
• SpO2 data (if installed and enabled)
and time.
61 Only for adult/pediatric patients.
Hamilton Medical | HAMILTON-T1 Operator's Manual
169
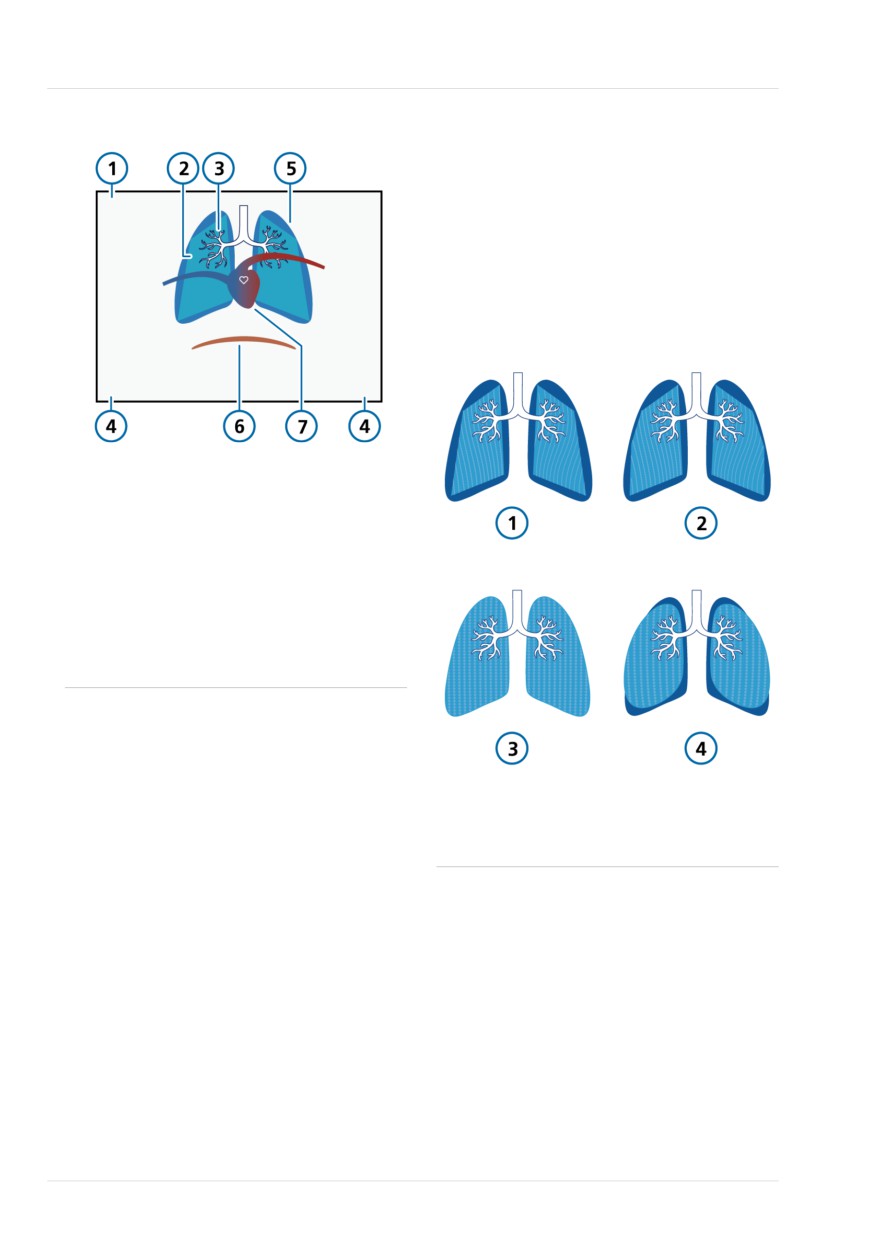
8 Monitoring ventilation
Figure 8-14. Dynamic Lung panel
Respiratory compliance
Respiratory compliance is a measure of the
lung's ability to stretch and expand. Com-
Male
pliance is illustrated by the contour lines of
174 cm
IBW: 70 kg
the lung, as shown in Figure 8-15. The
static measurement is provided with the
Cstat parameter.
PVI
---
Figure 8-15. Examples of lung compliance
%
(Cstat) illustrated in Dynamic Lung
Rinsp
Cstat
PetCO2
SpO2
Pulse
10
36.2
43
93
80
cmH2O/l/s
ml/cmH2O
mmHg
%
1/min
1
Sex, height, IBW
5
Representation of
breaths and tidal
volume
2
Representation of
6
Patient trigger
lung compliance
(diaphragm)
3
Representation of
7
Heart and pulse
airway resistance
display*
4
Monitored parameter values
* If SpO2 sensor enabled and connected.
Mechanical breaths, with tidal volume
The mechanical breath is shown as a set
of lungs that expand and contract in syn-
1
Very low compli-
3
Normal compli-
chrony with ventilator breath delivery,
ance
ance
showing the delivered tidal volume (Vt) in
real-time. The lung size displayed is rela-
2
Low compliance
4
High compliance
tive to the “normal” size for the patient’s
height.
Airway resistance
A Disconnection alarm is indicated by a
Airway resistance refers to the total resis-
deflated lung. An Exhalation obstructed
tance imposed by the patient’s airway as
alarm is indicated by an over-inflated lung.
well as the artificial airway, such as an
endotracheal tube or tracheostomy tube.
The movement and shape of the lungs
Airway resistance is illustrated by the size
allow you to quickly verify that the ventila-
and color of the tracheobronchial tree, as
tor is ventilating the patient.
shown in Figure 8-16. The resistance mea-
surement is provided with the Rinsp para-
meter.
170
English | 10103179/02 USA
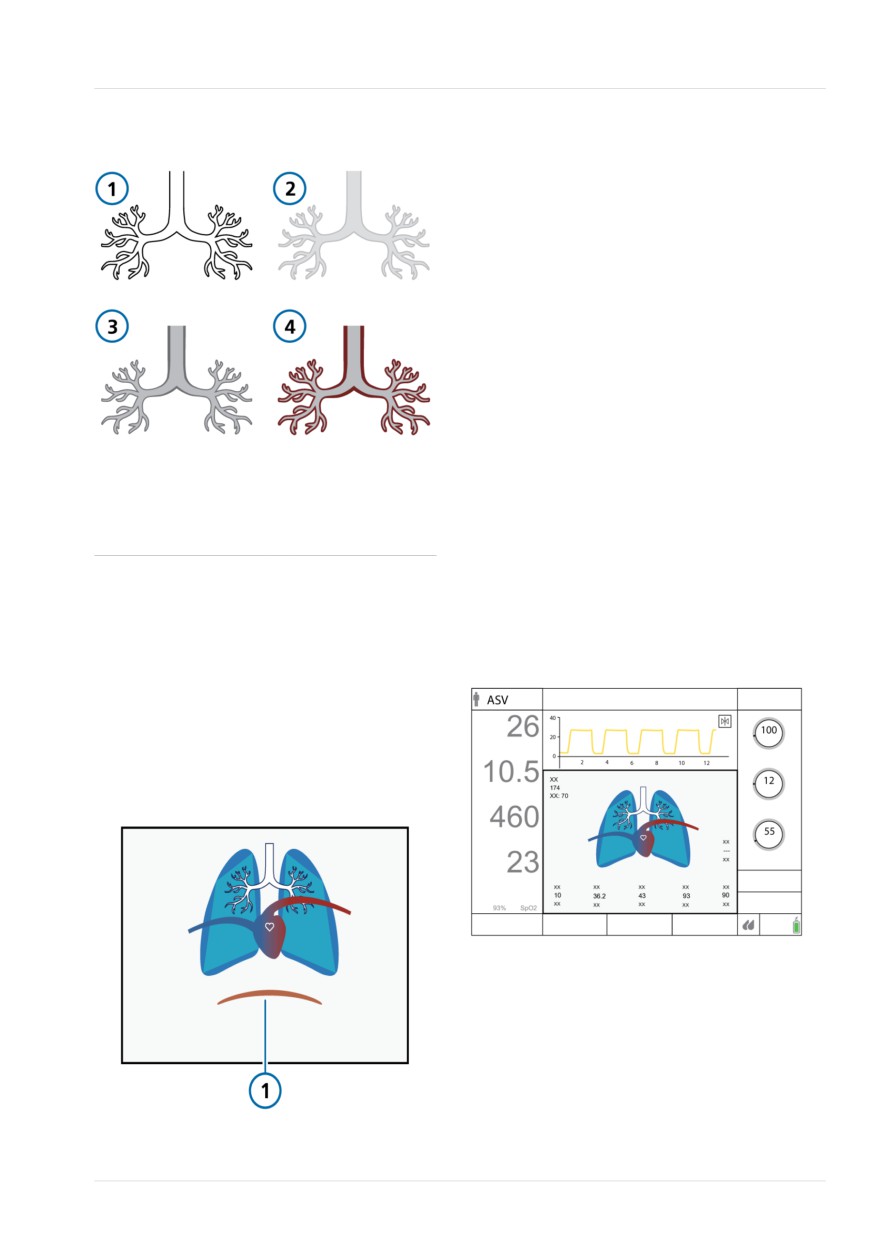
Displaying the Dynamic Lung
8
Figure 8-16. Examples of resistance shown by
SpO2 data
the bronchial tree of the Dynamic Lung
If the SpO2 option is enabled and a sensor
is connected, the Dynamic Lung panel
shows a heart and big vessel illustration
superimposed on the lungs. The heart
beats in synchrony with the patient's pulse
rate.
For details about SpO2 measurement, see
the Pulse Oximetry Instructions for Use.
8.4.1.1 Displaying the Dynamic Lung
To display the Dynamic Lung
1
Resistance
3
Moderate
1. Touch the graphics area at the bottom
information is
resistance
half of the display (Section 8.3.1).
unavailable
2. In the graphics selection window,
2
Normal resistance
4
High resistance
touch the Graphics tab (Figure 8-5).
3. Touch Dynamic Lung.
Patient trigger
The Dynamic Lung panel is displayed
If a patient trigger is detected, an illustra-
(Figure 8-18).
tion of the diaphragmatic muscle appears
Figure 8-18. Dynamic Lung in display
briefly at the beginning of inspiration, as
shown in Figure 8-17. This allows you to
quickly see whether the breath is patient
triggered.
Figure 8-17. Patient triggering (1) in Dynamic
Lung
Male
174 cm
IBW: 70 kg
PVI
---
%
Rinsp
Cstat
PetCO2
SpO2
Pulse
10
36.2
43
93
80
cmH2O/l/s ml/cmH2O
mmHg
%
1/min
Hamilton Medical | HAMILTON-T1 Operator's Manual
171
8 Monitoring ventilation
8.4.2 Vent Status panel: real-time
Figure 8-19. Vent Status panel
ventilator dependence status
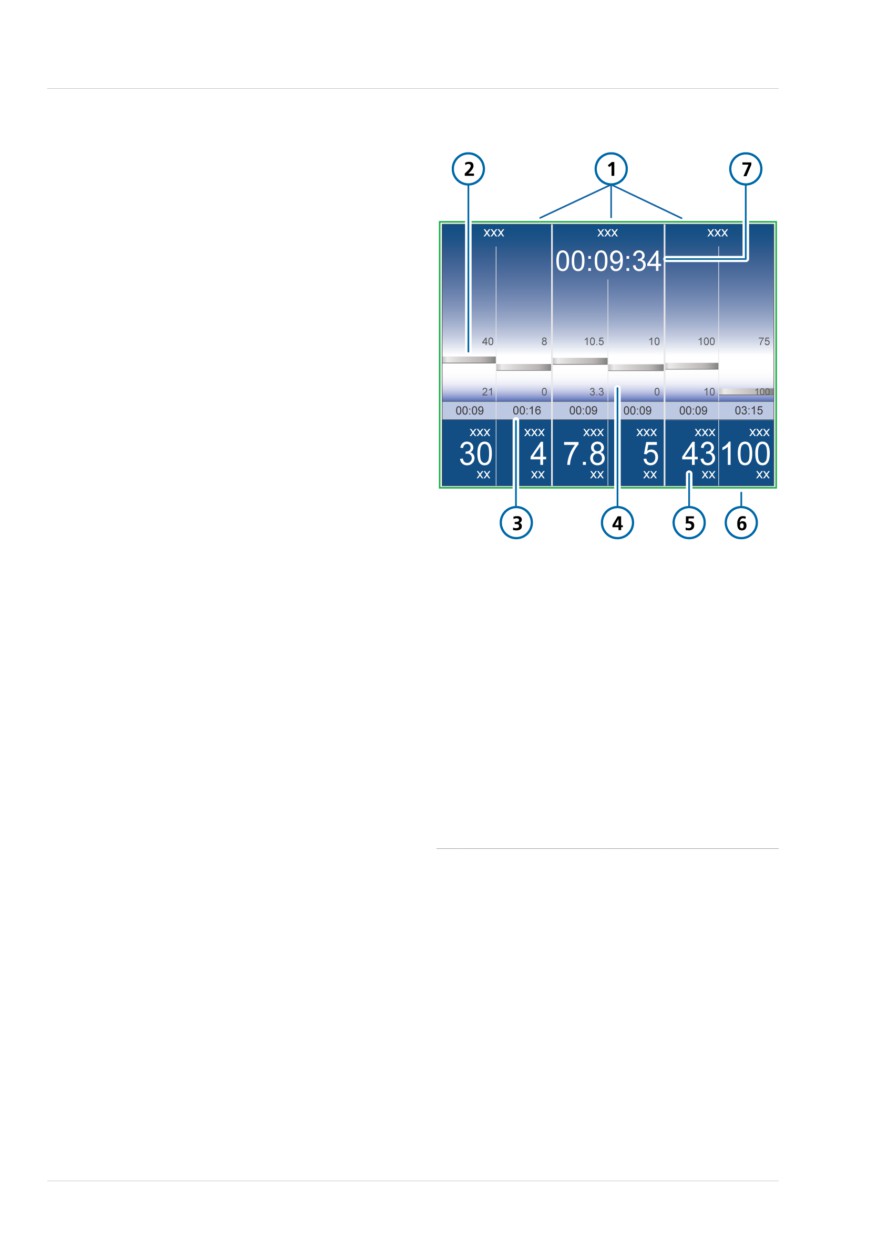
The Vent Status panel (Figure 8-19)
displays six parameters related to the
patient’s ventilator dependence, in the
areas of oxygenation, CO2 elimination,
and patient activity.
A floating indicator moving up and down
within the column shows the value for a
given parameter.
When the indicator is in the white (wean-
ing) zone, a timer starts, showing how
long that value has been in the weaning
zone. When all values are in the weaning
zone, the Vent Status panel is framed in
green, indicating that weaning should be
considered. A timer appears, recording the
length of time all values have been in the
1
Group title
5
Monitored value,
weaning zone (Figure 8-19).
numeric
2
Monitored value,
6
Green outline
The panel is updated breath by breath.
graphic (floater)
indicating all
Table 8-2 describes the parameters shown
values are in the
in the Vent Status panel.
weaning zone
3
Elapsed time
7
Elapsed time all
You can configure the weaning zone
value has been in
values have been
ranges for these parameters in Configura-
weaning zone
in weaning zone
tion. To set the values, see Section 13.6.1.
4
Weaning zone
with user-config-
urable limits
172
English | 10103179/02 USA
Displaying the Vent Status panel
8
Table 8-2. Vent Status parameters
8.4.3 ASV Graph panel: real-time
patient condition and targets
Parameter
Definition
(unit)
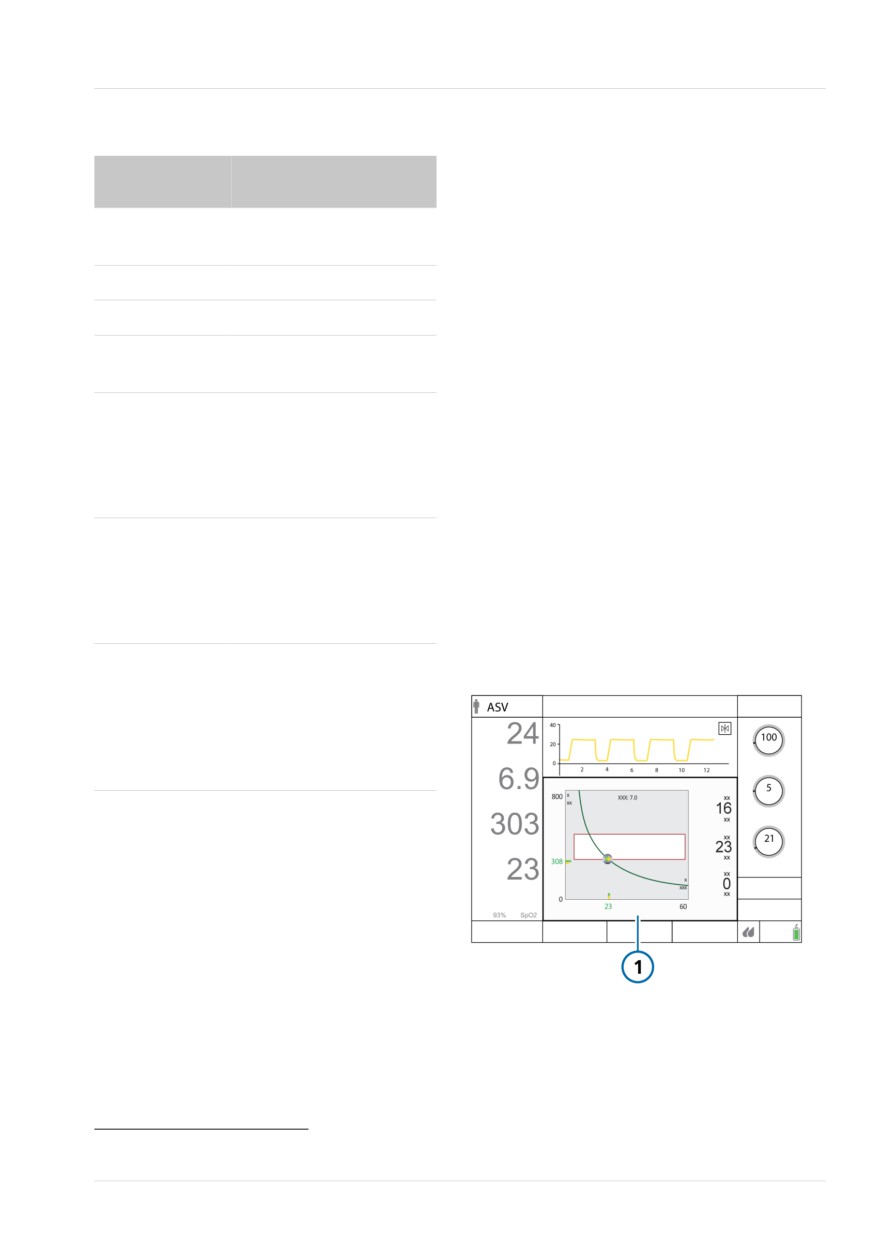
Available in ASV63 mode, the ASV Graph
shows how the adaptive lung controller
For additional details, including ranges and
moves toward its targets. The graph
accuracy, see Table 15-9.
shows both the target and real-time
Oxygen (%)
Oxygen setting.
patient data for tidal volume, frequency,
pressure, and minute ventilation.
PEEP (cmH2O)
PEEP/CPAP setting.
Figure 7-17 in Chapter 7 describes the
MinVol (l/min)
Normal minute ventilation
graph in detail.
(see Section 7.8).
ΔPinsp (cmH2O)
Inspiratory pressure, the
8.4.3.1 Displaying the ASV Graph
target pressure (additional
to PEEP/CPAP) applied
To display the ASV Graph
during the inspiratory
1. Touch the graphics area at the bottom
phase.
half of the display (Section 8.3.1).
RSB
Rapid shallow breathing
2. In the graphics selection window,
(1 / (l*min))62
index. The total breathing
touch the Graphics tab (Figure 8-5).
frequency (fTotal) divided
3. Touch ASV Graph.
by the exhaled tidal
volume (VTE).
The ASV Graph is displayed (Figure 8-20).
%fSpont (%)
Spontaneous breath per-
Figure 8-20. ASV Graph panel (1)
centage. The moving
average of the percentage
of spontaneous breaths
over the last 10 total
breaths.
8.4.2.1 Displaying the Vent Status panel
To display the Vent Status panel
1. Touch the graphics area at the bottom
half of the display (Section 8.3.1).
2. In the graphics selection window,
touch the Graphics tab (Figure 8-5).
3. Touch Vent Status.
The Vent Status panel is displayed (Figure
8-19).
62 Weaning zone defaults are based on normal values < 100/(l*min) for adult patients. Default values can be changed in Configuration.
63 Only for adult/pediatric patients.
Hamilton Medical | HAMILTON-T1 Operator's Manual
173