PL7 JUNIOR/PRO Operate modes manual (Operate modes manual eng V4.0) - page 8
Debugging
Animating program elements
At a Glance
The animation of the parts of the program when the PLC is in RUN (rungs Ladder,
instruction LIST sequence, Structured text sequence, Grafcet) is carried out directly
in the language editors by activating the animation function when PL7 is connected
to a PLC.
Ladder rung
The editor animates the following elements:
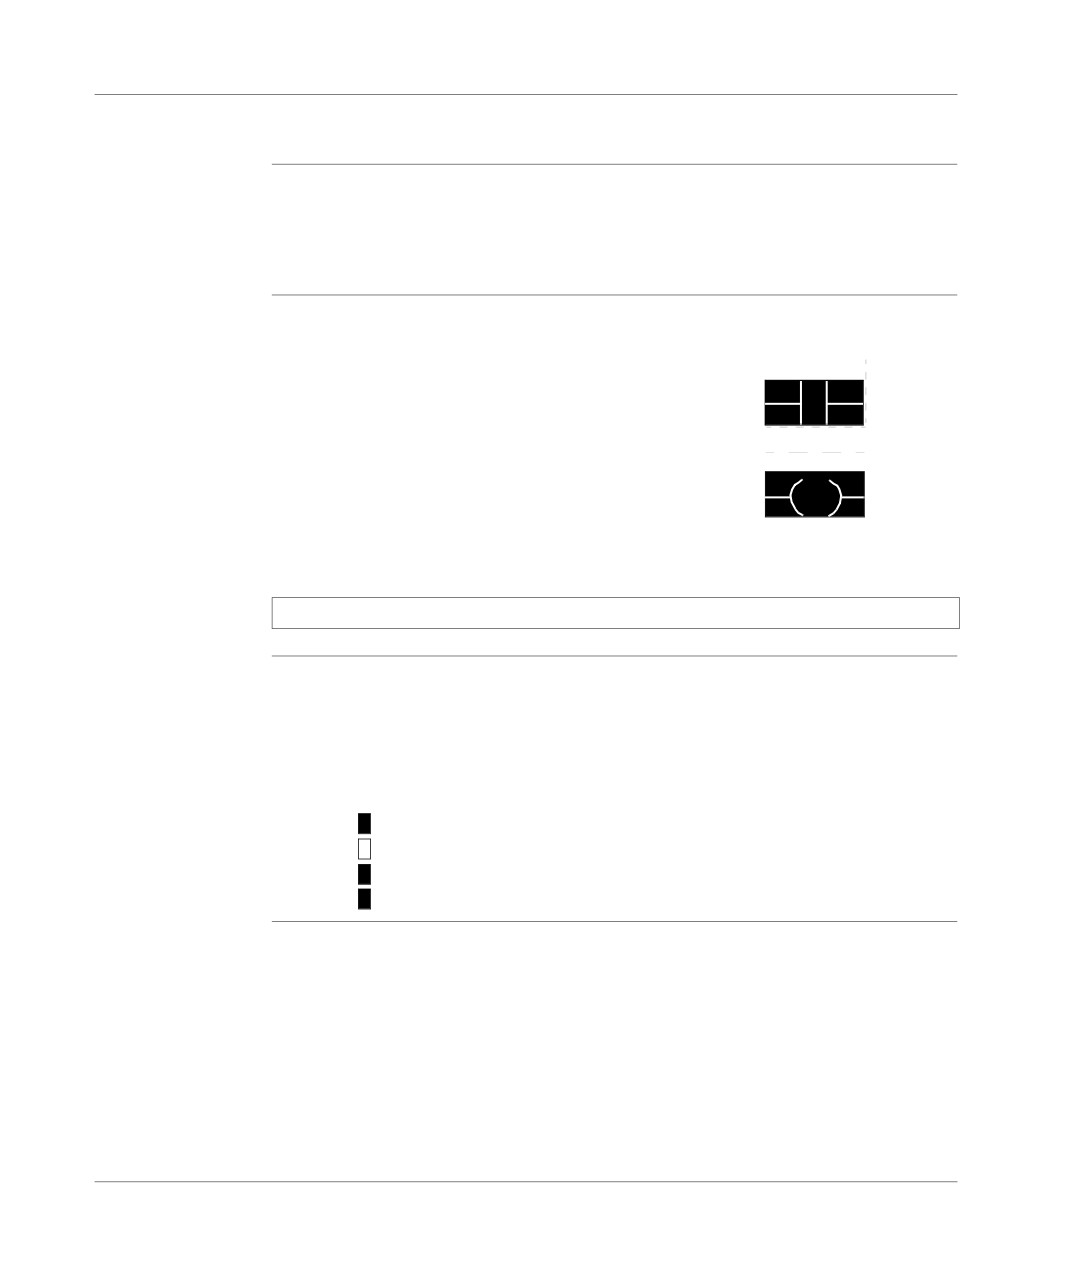
animation
l the rungs are highlighted when they are running,
%M12
l the coils are highlighted when the associated bit is set to 1,
%M12
R
l the FB outputs are highlighted when they are set to 1. Some internal parameters
are animated by the display of their numerical value inside the block.
Note: A forced variable is indicated by F.
Animation of List The editor carries out animation in the following way:
sequences
l a variable at 1 is indicated by a black rectangle,
l a variable set at 0 is indicated by a white rectangle,
l a forced variable is indicated by an F.
Example:
LDN
%M0
ST
%M1
LD
%M2
ST
%M3
285
Debugging
Animation of
The editor animates by linking itself to the Animation tables tool in the following way:
Structured text
sequences (PL7
Select the Option → Animation by tables, command after having started the Struc-
Junior, PL7 Pro)
tured Text sequence editor, and the tool is then placed next to the editor.
Each language element displayed on the editor screen is entered in the table, keep-
ing to the limit of 40 possible variables.
Note: For a table type variable, only the first element in the table is taken into ac-
count. It is therefore possible to add other elements from the table which may be
important in the context of the application.
Animation of the The editor carries out animation in the following way:
Grafcet steps
l an active step is indicated by a black rectangle,
l an inactive step is indicated by a white rectangle,
Example:
22
11
Animation of
A macro-step is animated (highlighted) if at least one of these steps is active.
macro-steps
Animation of
If the DFB type has not been code protected, it is possible to view the code dynam-
DFB code
ically using animation tables.
Select a call interface in a section then select the Opencontextual menu.
286
Debugging
Animation
Commands and functions:
commands
Com-
Function
mand
Utility →
Suspends animation.
Stop Ani-
mation
Utility →
Restarts animation.
Animate
Utility →
The animation is frozen, the variables change but the display is no longer re-
Freeze
freshed.
Note:
l the animation is synchronous with the end of the MAST task cycle.
l for all indexed objects, if index overflow occurs, there may be inconsistency in
the animation.
Example:
LD %M[%MW10] animation = status of indexed object even in the case of index
overflow.
ST %M1 animation = status of %M0 if there is index overflow.
287
Debugging
Grafcet debugging
At a Glance
Grafcet debugging allows you to:
l control charts in order to facilitate debugging,
l perform maintenance actions.
This makes it possible to check that the synchronization of operating modes and the
coordination of tasks is being carried out correctly (forcing command).
When an installation is switched to manual mode, either for adjustment or because
of an error, the context of the graph is saved (freeze command) and it is then possi-
ble to resume the cycle at the same place once the adjustment is finished or the fault
has been acknowledged.
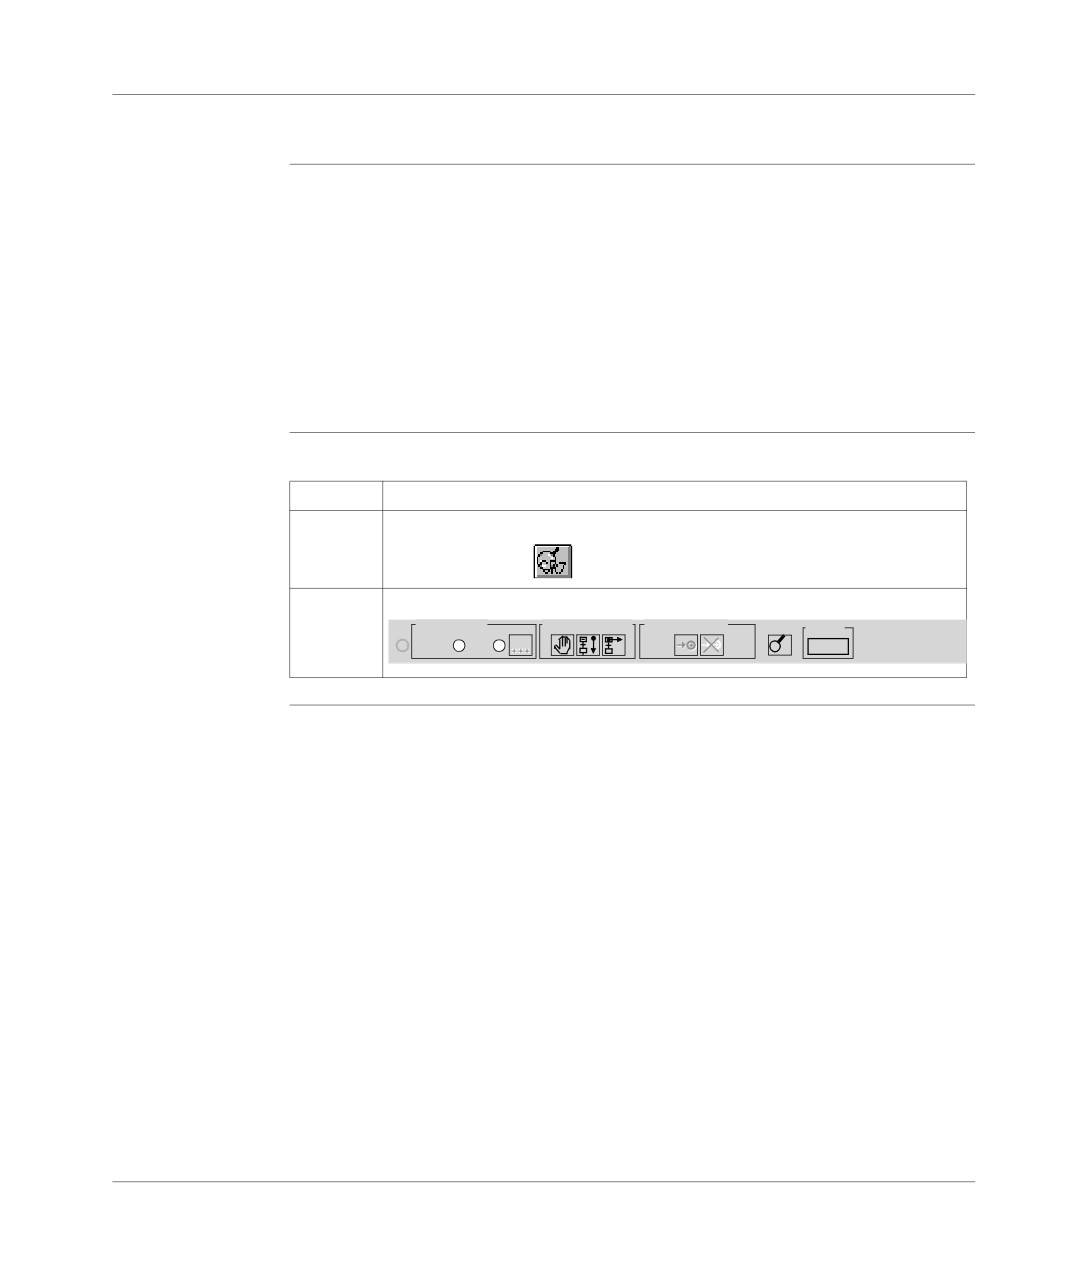
How to gain
Carry out the following steps:
access to the
Step
Action
Grafcet
debugging bar
1
Click on the debugging bar icon .
2
The following bar appears:
Chart status
Actions on chart Prepositioning
Mast
Frozen
Error
PRG
RUN a
288
Debugging
Grafcet
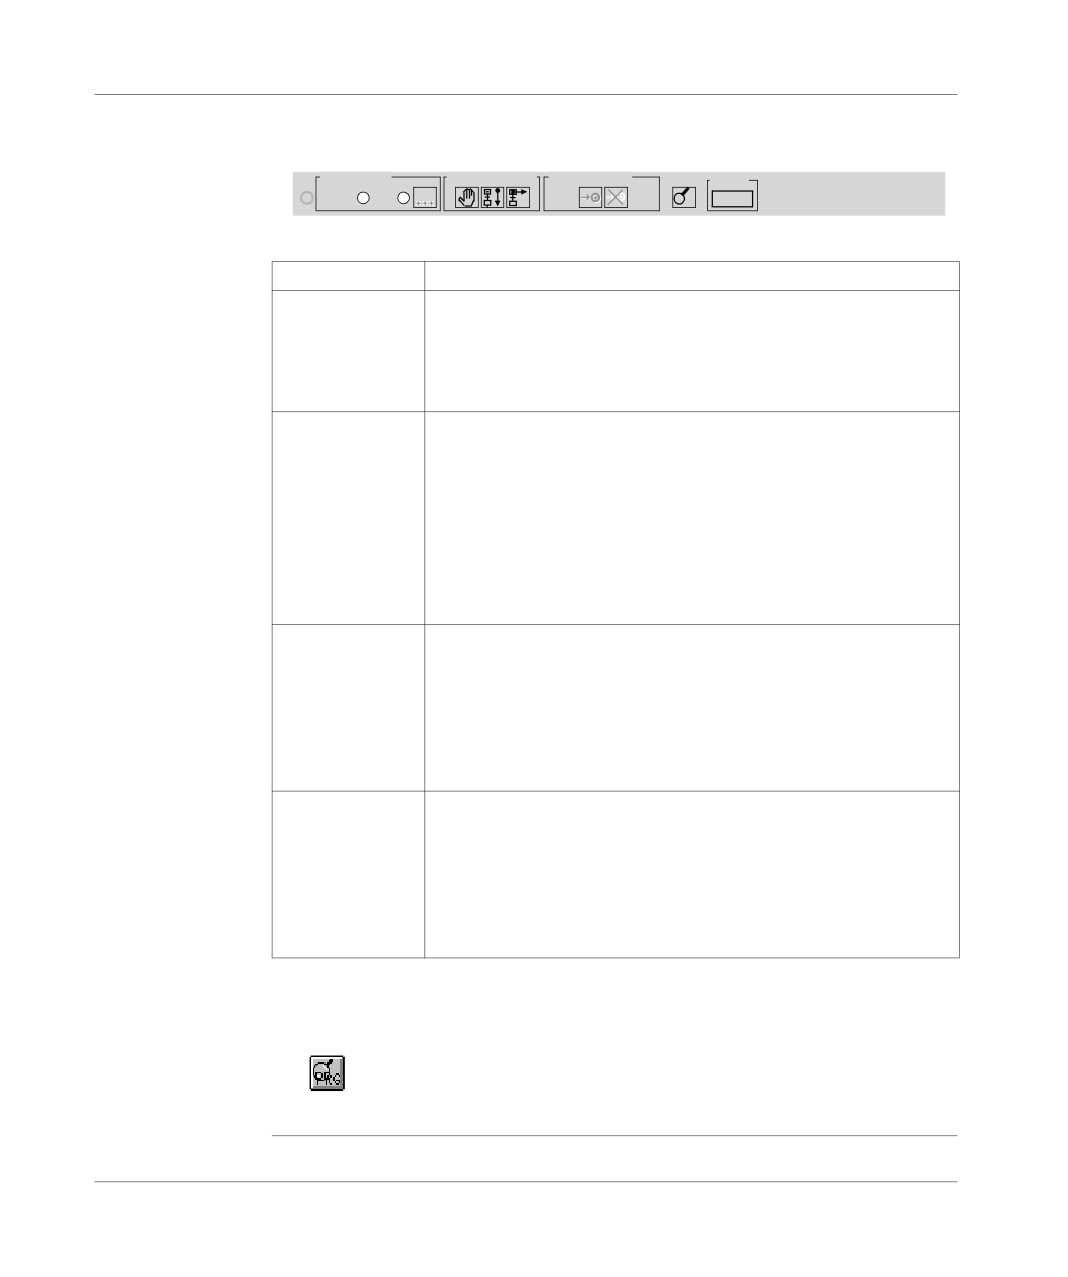
The following illustration shows the arrangement of the command buttons in the de-
debugging bar
bugging bar.
Chart status
Actions on chart Prepositioning
Mast
Frozen
Error
PRG
RUN a
Zone
Functions
Chart status
Provides information about the chart status:
l Frozen:indicates whether or not the chart is frozen,
l Error: indicates whether there is an error in the chart,
l Button: can be activated when there is an error, is used to create an
information box with the list of active errors.
Actions on chart
Contains buttons which are used to:
l Freeze/Unfreeze the chart.
On Freeze, the active steps remain active and continuous actions
only are executed.
On Unfreeze, the operating cycle resumes from the same place.
l Initialize the chart on these initial steps. It develops from these steps
and continues in its current operating mode.
l Position the chart in an empty location with no step on the chart be-
ing active.
Prepositioning
Contains buttons which are used to:
l Position the chart on the steps to be prepositioned that are selected
from the grafcet editor.
Prepositioning is indicated by a full stop to the left of the step.
l Delete configured prepositions.
To delete the prepositioning of a step, select the step from the editor
and the Delete prepositioning command from the contextual menu.
Mast
Provides information on the task status:
l RUN a: Mast task active in Run,
l STOP a: Mast task active in Stop,
l RUN i: Mast task inactive in Run,
l STOP i: Mast task inactive in Stop,
l STEP: Step by Step program in progress,
l ERR: execution error.
The animation of the Grafcet section’s activity condition is displayed on the far left
of the debugging bar.
The
button is used to switch from the Grafcet debugging bar to the program
debugging bar.
289
Debugging
How to gain
Carry out the following steps:
access to the
Step
Action
Grafcet
1
In the Application browser in the Structure view, look at the Program direc-
debugging
tory and right click (contextual menu) on the G7 icon.
screen
2
The following screen appears:
Grafcet Debug Browser
operate
Prl
G7
Chart
G7
Macro0
G7
Macro1
LD
Post
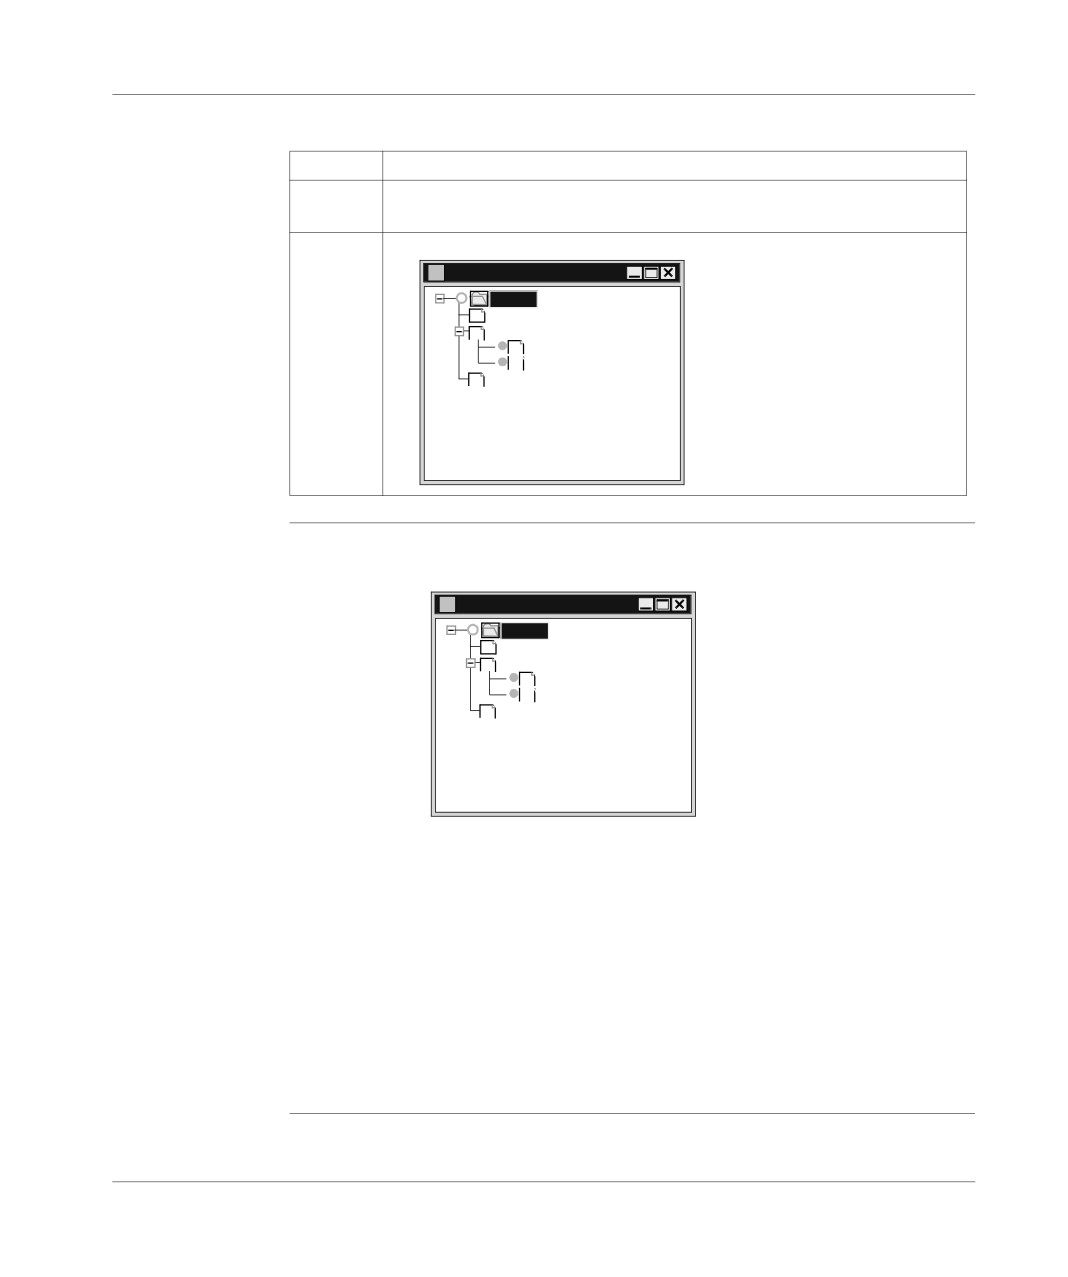
The Grafcet
The Grafcet debug browser can be accessed from the Grafcet editor or from the ap-
debug browser
plication browser’s Grafcet section using the contextual menu.
Grafcet Debug Browser
operate
Prl
G7
Chart
G7
Macro0
G7
Macro1
LD
Post
This screen gives a hierarchical view of the chart with the nesting of the CHART
module and macro-steps.
This view is animated in online mode with the animation indicated by the absence
or presence of a token (an active macro-step is shown by the presence of a green
circle).
A certain number of operations are possible via:
l the contextual menu at the bottom of the screen,
l the contextual menu on an item describing a macro-step:
l deactivating a macro-step,
l activating a macro-step,
l editing a macro-step.
290
Debugging
Executing the programme
At a glance
Executing an application on a PLC can be controlled using the functions:
l RUN, STOP, INIT PLC,
l RUN, STOP at the level of a task (MAST or FAST),
l breakpoint and step by step,
l Grafcet debugging.
Finding out the
Carry out the following steps:
confirmation
Step
Action
conditions of a
section
1
In the Application Browser of the structure view, choose the section.
2
Right click (contextual menu) and select Properties.
Accessing the
Carry out the following steps:
contents of a
Step
Action
section
1
Go to the Application Browser of the Structure View.
2
Double click on the section icon.
Operating the
In runtime:
programme
l a green circle indicates that the section is confirmed,
l a red circle indicates that the section is not confirmed (confirmation bit at zero).
Forcing the
Carry out the following steps:
confirmation
Step
Action
values of the
section
1
In the Application Browser in the structure view, choose the section.
2
Select the contextual menu (right click) Force the activation condition to 0
orForce the activation condition to 1, this is indicated by a F on the green
circle.
291
Debugging
Task properties
Task
The MAST task may feature:
configuration
l cyclical execution (default selection),
l periodic execution.
In cyclic operation, the task executions follow on directly from one another.
In periodic operation, the task executions are sequencced at a period set by the us-
er.
Whatever the operating mode: whether periodic or cyclic, the task is controlled by a
watch dog device which is used to detect an abnormal period in the application pro-
gram. If overrun occurs, the S% system bit is positioned at t 1 and the application is
declared in blocking fault mode for the PLC.
Task debugging The Operating mode zone indicates the status of the task execution.
The Duration zone indicates the execution time of the MAST and FAST tasks.
292
Debugging
Executing the MAST task
Introduction
In this procedure, only the MAST task is executed.
How to put the
There are several ways in which the MAST task can be put into RUN:
MAST task into
l select the Debug → Run Mastcommand,
RUN
l select the Debug → Access the PLC debugging screen command and click on
the RUN button associated with the MAST task.
How to put the
There are several ways in which the MAST task can be put into STOP:
MAST task into
l select the Debug → Stop Mastcommand,
STOP
l select the Debug → Access the PLC debugging screen command and click on
the STOP button associated with the MAST task.
l click on the STOP icon on the general panel.
Note: The execution status of the task is shown in the debugging bar:
l STOP, RUN,
l a: the task is active (the %S30 system bit is at 1),
l i: the task is inactive (the %S30 system bit is at 0),
l Non Pr: the task is not programmed,
l STEP: step by step function in progress,
l ERR: execution error.
Duration
In periodic operation, the "Adjusted Period" column is used to adjust the task period.
adjustment
This adjustment is lost on cold start, it is the value entered in the configuration which
is taken into account in this case, it is possible to save the adjusted period using the
Services → Save the Set Period command.
Note: The Service → Restore periods command replaces the period set with the
period defined in the configuration.
The mimimum, current, maximum durations are provided by the PLC, the duration
button Init in the column Init resets these values in order to carry out new process
values.
293
Debugging
Task
The Activation/Deactivation button on theUC debugging screen is used to acti-
activation-Fault
vate the MAST task when the latter is in RUN.
management
The Err button on theUC debugging screen displays the MAST task errors and the
Reset button is used to reset the system bits associated with task errors to zero to
ensure that the error(s) is/are still valid.
294
Debugging
Executing the FAST task
Introduction
In this procedure, only the FAST task is executed.
How to put the
There are several options for putting the FAST task into RUN:
FAST task into
l select the Debub → Run Fastcommand,
RUN
l select the Debug → Access the UC debugging screen command and click on
the RUN button associated with the FAST task.
How to put the
There are several options for putting the FAST task into STOP:
FAST task into
l select the Debug → Stop Fastcommand,
STOP
l select the Debug → Access the UC debugging screen command and click on
the STOP button associated with the FAST task.
l click on the STOP icon on the general panel.
Note: The execution status of the task is shown in the debugging bar:
l STOP, RUN,
l a: the task is active (the %S30 system bit is at 1),
l i: the task is inactive (the %S30 system bit is at 0),
l Non Pr: the task is not programmed,
l STEP: step by step function in progress,
l ERR: execution error.
Duration
In periodic operation, the "Adjusted Period" column is used to adjust the task period.
adjustment
This adjustment is lost on cold start, it is the value entered in the configuration which
is taken into account in this case, it is possible to save the adjusted period using the
Services → Save the Set Periodcommand.
Note: The Service → Restore periods command replaces the period set with the
period defined in the configuration.
The mimimum, current, maximum durations are provided by the PLC, the duration
button Init in the column Init resets these values in order to carry out new process
values.
295
Debugging
Task
The Activation/Deactivation button on theUC debugging screen is used to acti-
activation-Fault
vate the MAST task when the latter is in RUN.
management
The Err button on theUC debugging screen displays the FAST task errors and the
Reset button is used to reset the system bits associated to task errors to zero in or-
der to ensure that the error(s) present are still correct.
296
Debugging
Execution of a program with breakpoint
At a Glance
The software manages a single breakpoint which can be set in on-line mode on any
program element (LD rung or IL, ST, DFB sequence) that is contained in the MAST,
FAST, or SR tasks.
Setting these breakpoints is one of the functions of the debug bar.
How to access
Carry out the following steps:
the debug bar
Step
Action
1
Click on the Debug menu on the PL7 task bar.
2
Click on the Debug bar sub-menu.
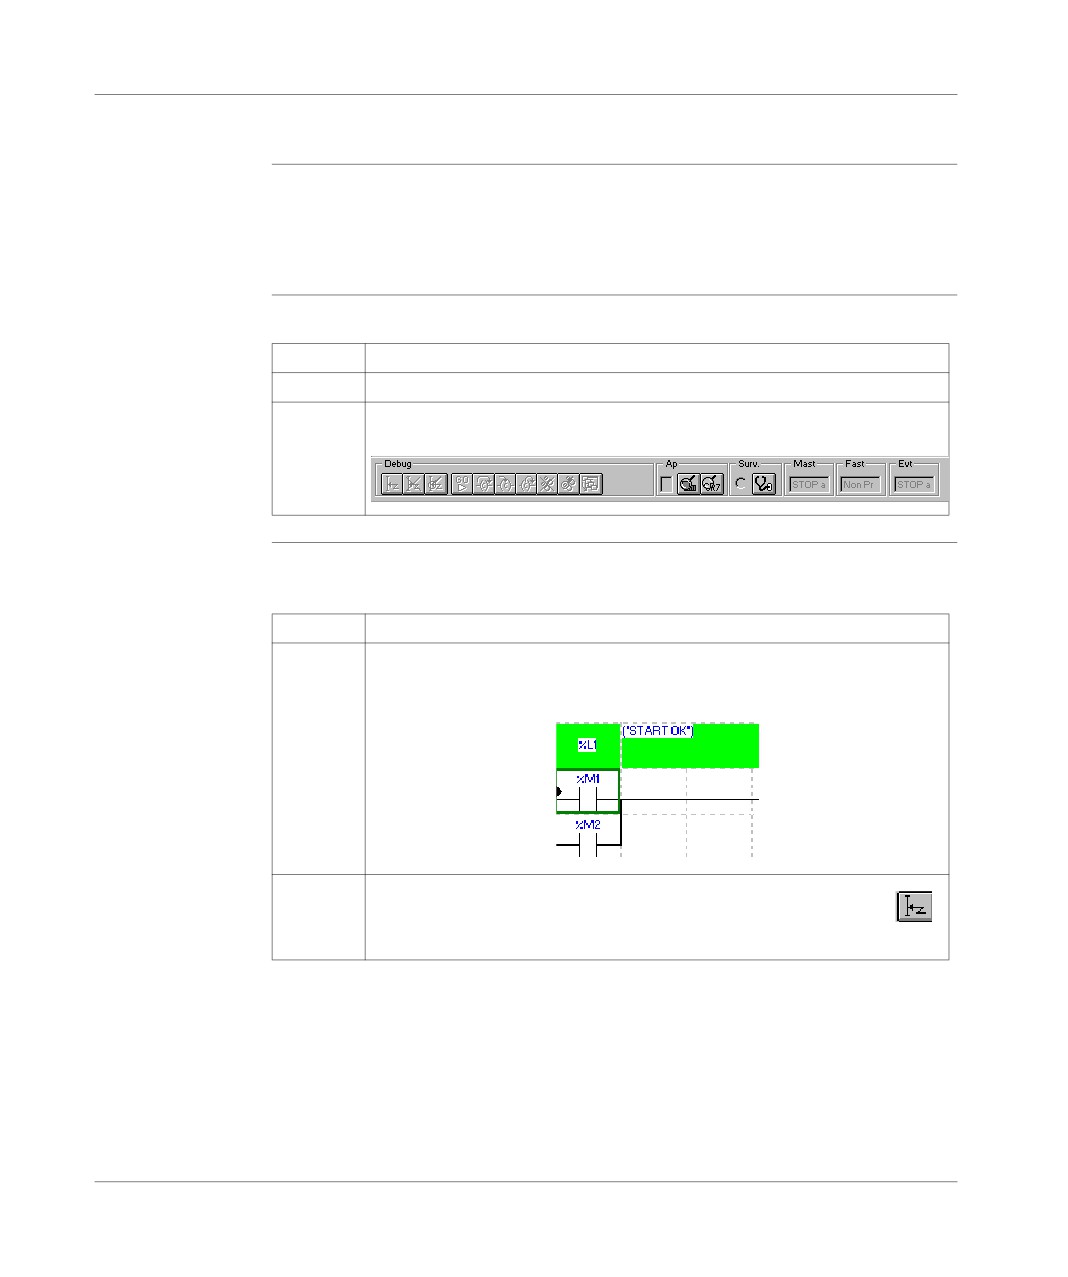
Result: the following bar appears at the bottom of your PL7 screen
Setting a
Breakpoint are positioned directly from the languages editors.
breakpoint
Carry out the following actions:
Step:
Action:
1
Place the cursor on the program element (LD rung or IL, ST statement) that is
to be the breakpoint.
Example:
2
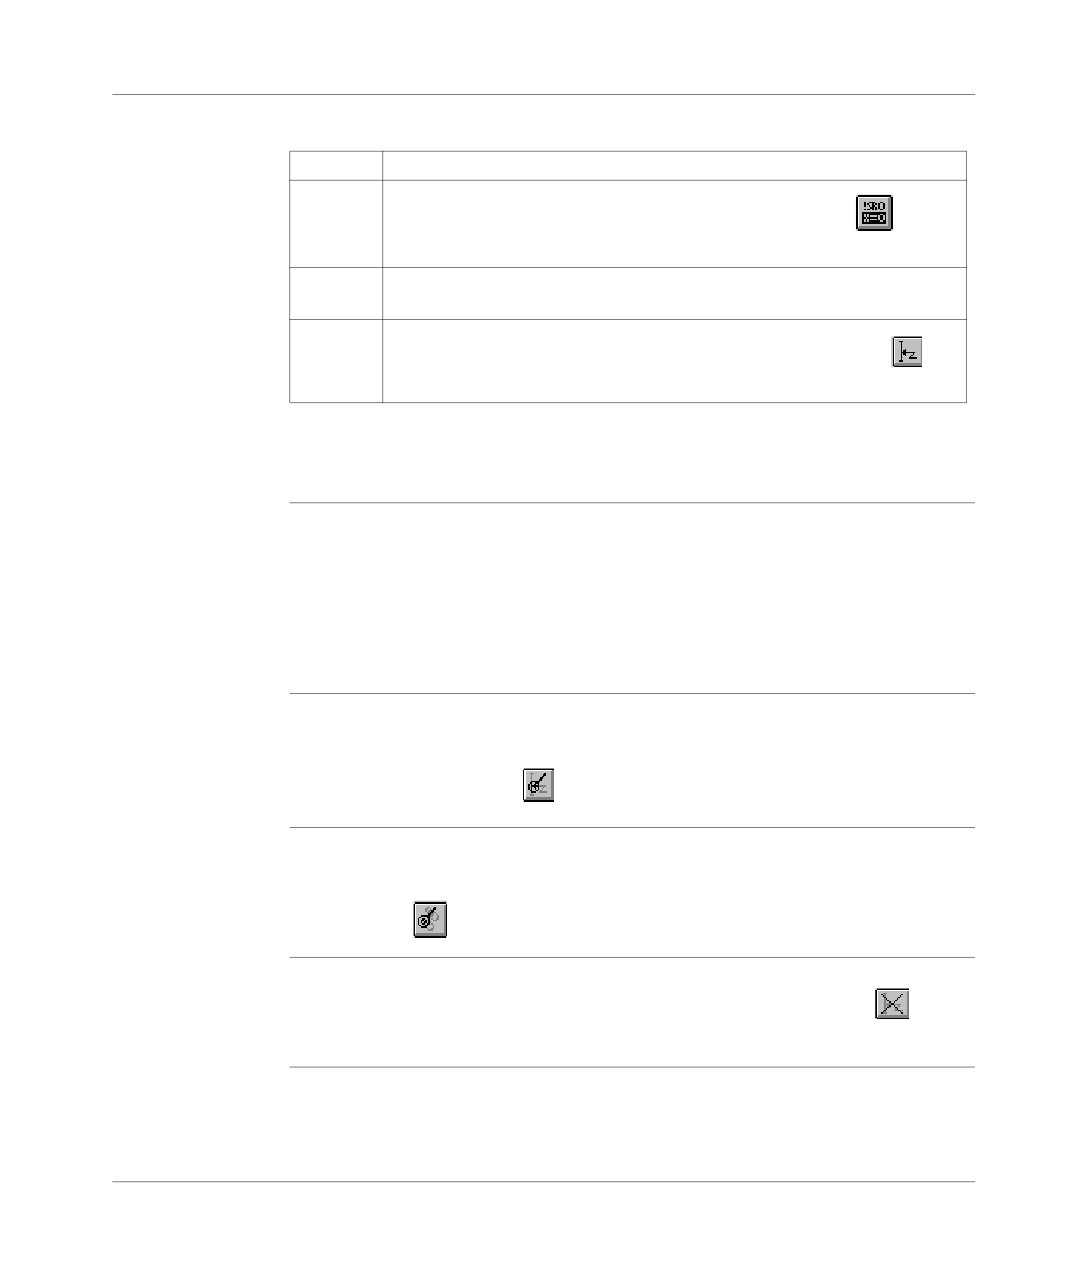
Select the Debug/Set the breakpoint command or click on the button
on the debug bar.
297
Debugging
With Structured Text:
Step:
Action:
1
Select the Debug/Line mode command or click on the button
on the
debug bar.
2
Place the cursor at the position on the instruction line at which the breakpoint
is to be set,
3
Select the Debug/Set breakpoint command or click on the button
on
the debug bar.
Note:
Setting a new breakpoint deletes any existing breakpoint.
Executing the
Execute the PLC/Run, Debug/Run Mast, Debug/Run Fast program if the PLC is
program
not already in Run.
The program is executed until the rung, the statement or the instruction line (with
Structured Text in line mode) associated with the point is reached. The statement,
instruction line or the rung is not executed.
The breakpoint is displayed in yellow (step in progress), so it is possible to execute
the program in step by step mode.
Accessing the
To place the cursor directly on the breakpoint set in the application (without first ac-
breakpoint
cessing the program module), select the Debug/Show Breakpoint Inserted com-
mand or click on the button
Accessing the
To place the cursor directly on the step in progress in the application (without first
step in progress
accessing the program module), select the Debug/Show Current Step command
or click on the
button on the debug bar.
Deleting the
breakpoint
Select the Debug/Remove breakpoint command or click on the button
on the
debug bar.
298
Debugging
With DFBs
A breakpoint cannot be directly inserted into the code of a DFB type (accessible in
read mode).
It is recommended that you set the breakpoint directly on the calling code element,
then enter the instance code via the Call Module menu.
Module Call
For an error diagnosed in a SR or in a DFB, the Debug/Set up module call stack
Stack
command is used to recognize the chronological sequence of calls that have led to
the faulty module being executed.
The dialog box contains the following information:
l the current task name,
l the module call list as well as the line/statement number which have led to the
execution of the faulty module (the first in the list is the top of the stack).
The View button is used to view the module selected in the stack. This function is
also accessible by double clicking on the List Box.
299
Debugging
Executing a program in step by step mode.
At a Glance
The program is executed rung by rung, sequence by sequence or instruction line by
instruction line (in line mode with ST). All the active tasks are executed, the inputs
are acknowledged and the outputs are set.
One of the functions of the debug bar is to execute the program in step by step
mode.
How to access
Carry out the following steps:
the debug bar
Step
Action
1
Click on the Debug menu on the PL7 task bar.
2
Click on the Debug bar sub-menu.
Result: the following bar appears at the bottom of your PL7 screen
ebug
PLC
Monit. Mast
Fast
Evt
GO
c
c
c
F
cR7
RUN a
RUN a
RUN a
Step by step
Carry out the following actions:
program
Step:
Action:
execution
1
Insert a breakpoint in a module through which the program will pass when it is
executed in step by step mode.
2
Give the AP/Run, Debug/Run Mastand Debug/Run Fast commands in pro-
gram execution mode.
300
Debugging
Commands
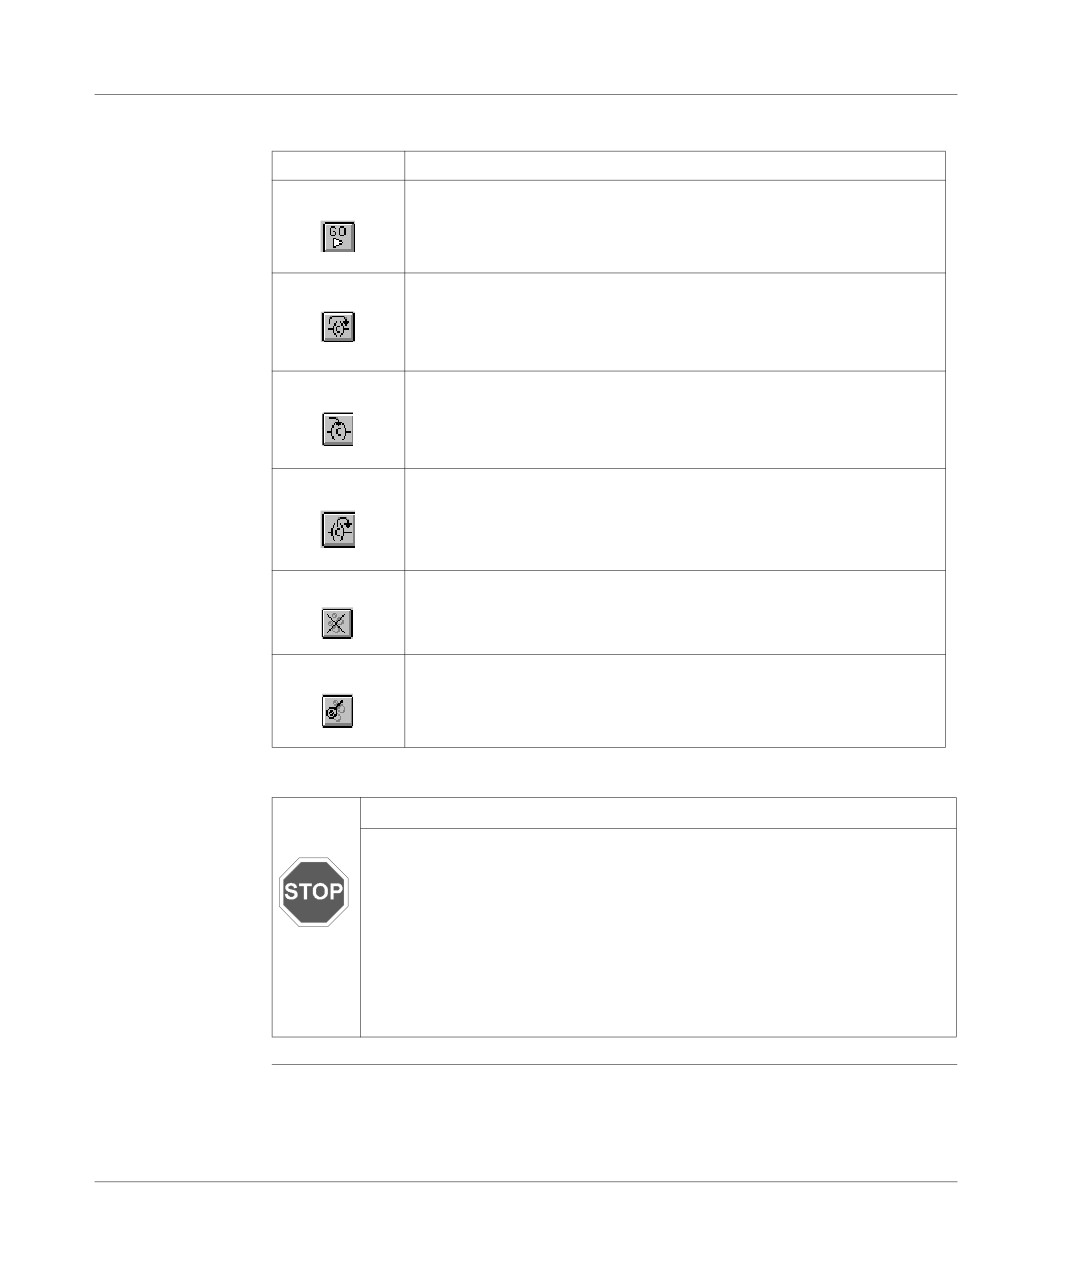
The commands are accessible via the debug bar or the Debug menu:
Debug bar:
Debug menu:
Button:
Menu/Start task (in step by step mode).
Button:
Debug/Go to next rung/next sequence/next instruction line (execute
the program element at the position at which it stopped and stop at the
beginning of the following program element). With a SR call, this function
does not enter the SR body and executes all of it.
Button:
Debug/Call module (access SR module).
Button:
Debug/Exit module (return to calling module).
Button:
Debug/Abort Step by Step (the breakpoint is deleted and the task re-
starts).
Button:
Debug/Show Current Step(move directly onto the current application
step, without accessing the program module beforehand).
WARNING
With alarm relay:
At each step the alarm relay (or safety output) controlled by the PLC
momentarily changes its status. At the end of the cycle, the outputs are
refreshed for approximately 1 ms. To avoid these effects on the alarm
relay and the physical outputs, the %S9 bit can be set at 1, which will
force the physical outputs into fallback.
Failure to observe this precaution can result in severe injury or
equipment damage.
301
Debugging
Forcing TOR input
Introduction
You must be in connected mode to access the forcing of TOR input .
How to force
Carry out the following steps:
TOR inputs
Step
Action
1
Select the command AP → Connect.
2
In Application Browser in the structure view, click on the Configuration direc-
tory, then double click (or contextual menu) on the Hardware configuration di-
rectory.
3
Select the module and then double click (or contextual menu).
Each channel is viewed:
l channel: input or output channel number,
l symbol: symbol set by the user linked to the channel,
l parametering: memory, event…
4
Next select the channel and right click, then click on Command.
5
Select the commandForce to 0(state F0) or Force to 1 (state F1).
To delete the forcing of a channel click on Unforce (select the channel then the con-
textual menu Command.
To delete the forcing of all of the module’s channels, click on the Global unforcing
button.
302
Debugging
Forcing analog inputs, TSX Micro
Introduction
You must be in connected mode to access the forcing tools.
How to force
Carry out the following steps:
analog inputs
Step
Action
1
Select the command AP → Connect.
2
In Application Browser in the structure view, left mouse click on the Config-
uration directory then double click on the Hardware configuration directory.
3
Select the position of the module then double click on it.
4
Select the channel.
5
Select the forcing value.
6
Click on the Force button.
Note: When a channel is forced, the information F appears in the value’s display
zone.
Forcing an input When an analog input is forced, the value present in the module’s input is not avail-
able. The forced value is indicated in the Value and Forcing fields on the screen.
The forcing of inputs is active whether the PLC is in RUN or in STOP mode.
Forcing an
When an analog output is forced, the value present in the module’s output is indicat-
output
ed in the Forcing field on the screen. The value calculated by the application re-
mains displayed in the screen’s Value field .
Deleting forcings To delete the forcing of a channel, select it and then press the Unforce button.
To delete the forcing of all of the module’s channels, click on the Global unforcing
button.
303
Debugging
Forcing analog inputs, TSX Premium
Introduction
You must be in connected mode to access the forcing tools.
How to force
Carry out the following steps:
analog inputs
Step
Action
1
Select the command AP → Connect.
2
In Application Browser in the structure view, left mouse click on the Config-
uration directory then double click on the Hardware configuration directory.
3
Select the position of the module then double click on it.
4
Select the channel.
5
Select the forcing value.
6
Click on the Force button.
Note: When a channel is forced, the information F appears in the value’s display
zone.
Forcing an input When an analog input is forced, the value present in the module’s input is not avail-
able. The forced value is indicated in the Value and Forcing fields on the screen.
The forcing of inputs is active whether the PLC is in RUN or in STOP mode.
Forcing an
The forcing is only possible if the task associated to the output is in RUN mode. If
output
the task is in STOP mode the output is put into fallback/maintain.
When an analog output is forced, the value present in the module’s output is indicat-
ed in the Forcing field on the screen. The value calculated by the application re-
mains displayed in the Forcing on the screen field. The value calculated by the
application remains displayed in the Value field on the screen.
Deleting forcings To delete the forcing of a channel, select it and then press the Unforce button.
To delete the forcing of all of the module’s channels, click on the Global unforcing
button.
304
Debugging
Adjustment of the application specific functions
Introduction
You must be in connected mode to access the adjustment of the application specific
functions.
How to adjust the
Carry out the following steps:
application
Step
Action
specific
functions
1
Select the command AP → Connect.
2
In the structural view’s Application browser selectConfiguration → Hard-
ware configuration.
3
Select the module position to be debugged then select the contextual menu
(right click) Open the moduleor double click on the module.
The attainable functions are:
l viewing the parameters,
l adjusting the selected channel.
4
Select the adjustment option to start the adjustment functions.
In local: the input parameters correspond to the initial parameters (value of the pa-
rameters during the first start or during a cold re-start).
In connected: the input parameters correspond to the current parameters (they are
lost during a cold re-start if they have not been saved beforehand).
The commands Commands and functions:
Command
Function
Service → Save pa-
Allows you to save the current parameters (replacing the initial val-
rameters
ues with the current values) if the application is in RAM memory.
Service → Restore
Allows you to replace the current values with the initial values.
parameters
Note: the functions and the commands which are available depend upon the ap-
plication specific module which you are using.
305
Debugging
Debugging a functional module
At a Glance
The organization of a functional module and the distribution of Grafcet sections,
events and modules in the different modules has no effect on the execution of the
program.
The program runs in the order shown in structure view.
In order to debug a functional module, the user can use of the following functions:
l standard debugging functions. Refer to the "Access to debugging functions"
heading of the " Debugging" Chapter of the Part "Debugging, Adjustment,
Documentation and Annexes".
l additional functions allowing incremental debugging of the application, functional
module by functional module.
Execution
The execution condition is used to validate or inhibit a section by program.
condition of the
sections
The section is active if the condition is at 1 and it is inhibited if it is at 0 (on cold start,
the execution conditions are at 0).
A section can be activated or deactivated by the user insofar as the condition is for-
cable.
Types of objects accepted as conditions:
Objects:
Forcable:
%Si
%Mi
X
Grafcet Objects
%MW:Xj
X
%SW:Xj
%KW:Xj
%Mi[%MWj
%Mi[%SWj]
%Mi[%KWj]
306
Debugging
Deactivation of
Action used to force to 0 all the execution conditions of the module sections.
all sections
Step:
Action:
linked to a
1
Select the desired functional module.
functional
module
2
From the contextual menu, select the Activation condition for the included
sections command.
3
Select the Force to 0 command.
Activation of all
Action used to force to 1 all the execution conditions of the module sections.
sections linked
Step:
Action:
to a functional
module
1
Select the desired functional module.
2
From the contextual menu, select the Activation condition for the included
sections command.
3
Select the Force to 1 command.
Cancellation of
Action used to unforce all the execution conditions of the module sections.
the forcing of all
Step:
Action:
sections which
1
Select the desired functional module.
are linked to a
functional model
2
From the contextual menu, select the Activation condition for the included
sections command.
3
Select the Unforce command.
307
Debugging
Debugging DFBs
Procedure
Refer to the section "Debugging, Adjustment, Documentation and Annexes"
Chapter "Debugging" headings:
l see : Animating program elements, p. 285,
l see : Execution of a program with breakpoint, p. 297,
l see : Executing a program in step by step mode., p. 300,
l see : Animation and modification of the variables: DFBs, p. 314.
308
Adjustment of variables
14
Introduction
Subject
This chapter describes how to adjust variables.
What’s in this
This Chapter contains the following Maps:
Chapter?
Topic
Page
Animation of variables: creating Animation tables
310
Working with animation tables
312
Animation and modification of the variables: DFBs
314
Modification of the variables:
316
List of forced bits
317
309
Adjustment of variables
Animation of variables: creating Animation tables
At a Glance
The software is used to create animation tables containing lists of variables and is
used to ascertain the value of the variables using various display types and to force
the bit variables. The variables tables can be created in offline or in online mode.
It is possible:
l to create an animation table automatically,
l to create an animation table manually,
l to enter a table of variables of the same type.
Automatically
The software is used to automatically create animation tables by selecting one or
creating an
more rungs LD (Ladder), statements IL (Instruction List), instructions ST (Structured
animation table
Text), or a DFB in the language editors and by activating a utility which initializes a
new table with all the objects contained in the selected program element.
Procedure:
Step
Action
1
Access the program module of the structure or function views, on which the ta-
ble is to be created.
2
Select the rung, the statement, the instruction and the DFB then select the Ini-
tialize Animation Table contextual menu. The tables which are automatically
created in this way can then be modified by deleting or adding new variables.
Manually
Procedure:
creating an
Step
Action
animation table
1
Select Animation Table in the application browser.
2
Select Edit/Create or use the contextual menu.
3
Enter the variables in address or symbol format and confirm with ENTER. The
current value of the variables is displayed.
4
When the table is created, close the entry box.
5
Specify the name of the table, enter any comments and confirm with ENTER
or Confirm As.
310
Adjustment of variables
Entering a table
Procedure:
of variables of
Step
Action
the same type
1
Enter the first variable.
2
Enter the separator - to increment the position or -.. to increment the channel.
3
Enter the length.
4
Confirm with ENTER.
Accessing an
Carry out the following steps:
existing
Step
Action
animation table
1
In the Application browser go to structure view.
2
Double click on the Animation table directory.
3
Double click on the Animation table that you want to access.
Result:the animation table editor appears.
Animation table
Animation table properties are:
properties
l Table name: it is possible to modify the name, if the table is not open.
l Location: this gives the name of any potential functional module associated with
the animation table when using PL7 Pro. The animation table can be assigned to
a different functional module or detached from the functional module (select
"None").
l Comment: the comment can be entered and modified.
How to display or
Carry out the following steps:
modify the
Step
Action
properties of an
1
Select the animation table.
animation table
2
Select the Properties contextual menu.
3
Carry out the modifications.
4
Click on OK.
311
Adjustment of variables
Working with animation tables
At a Glance
It is possible to perform several types of operation in an animation table:
l selecting and deleting one or more lines,
l entering a value for N consecutive variables,
l changing the format of N consecutive variables,
l inserting one or more lines,
l saving the animation table on the PC,
l deleting the table,
l changing the name of the table,
l masking the "Modification, Forcing" zone.
Selecting and
Selecting
deleting one or
Click on the rectangle on the left of the variable address (SHIFT+SPACE) in order
more lines
to select the line or click and drag to select more than one line (the selected lines
are highlighted in black).
Deleting
Select the line or lines and press Delete.
Entering a value
Carry out the following steps:
for
Step
Action
N consecutive
1
Click on the first of the consecutive values in the Current value field.
variables
2
SHIFT+Click on the last of the consecutive variables in the Current Value
field.
Result: the selected variables are highlighted in black.
3
Enter your value in the animation table entry field and confirm with Enter.
Result: the selected variables all have the same value.
Changing the
Carry out the following steps:
display format
Step
Action
for
1
Select N consecutive variables as explained above.
N consecutive
variables
2
Press the F9 key until the required format is obtained.
312
Adjustment of variables
WARNING
Displaying digital values:
If numerical values of more than three figures are truncated, change the
thousands separator value in the Windows Control Panel under Re-
gional Settings, numbers section.
Failure to observe this precaution can result in severe injury or
equipment damage.
Inserting one or
Select the line before which the insertion is to be made and select the Insert a line
more lines
contextual menu.
Saving the
Select the command Edit → Confirm asenter the name of the table and confirm with
animation table
OK.
on the PC
Deleting an
Procedure:
animation table
Step
Action
1
Select the table in question from the application browser.
2
Select Edit → Delete from the menu or press the DELETE key or use the De-
lete contextual menu.
Changing the
Procedure:
name of an
Step
Action
animation table
1
Select the table.
2
Press the F2 key or select the Properties contextual menu.
3
Enter the new name and confirm with OK.
Masking the
Select the View → Command Zone command.
"Modification,
Forcing" zone
313
Adjustment of variables
Animation and modification of the variables: DFBs
Introduction
With DFBs, there are several possibilities for the animation and the modification of
the variables:
l automatic creation via a DFB code,
l automatic creation via a DFB instance call,
l automatic creation via a DFB instance code,
l contraction and expansion,
l display and modification of a character string,
l the operate mode for the tables.
Note: You can only animate the instances used in the table.
Automatic
It is possible to automatically create an animation table from a DFB code. Select the
creation via a
instance in the list and confirm with OK. All the accessible variables on the animation
DFB code
table level will automatically be input.
Automatic
Proceed according to the following cases:
creation via a
If the DFB type…
Then…
DFB instance
is not protected
the call interface and the public variables are viewed and are modifi-
call,
able.
These standard functions are available only for the PL7 Pro product
to enable debugging of the DFB type.
For the PL7 Junior product, the variables are not modifiable.
is protected
the call interface and the public variables are viewed in read-only. The
instance variables are viewed in the table according to a Contract/Ex-
pand operate mode on the DFB types.
314
Adjustment of variables
Automatic
It is possible to automatically create an animation table from a DFB instance code.
creation via a
The variables of the instances depend on the level of protection.
DFB instance
Several levels of protection are possible:
code
If the DFB type…
Then…
is not protected
the parameters and the public and private variables used in the code
are viewed and are modifiable. These standard functions are available
only for the PL7 Pro product to enable debugging of the DFB type. For
the PL7 Junior product, the variables are not modifiable and the private
variables are not viewed.
is write-protected
the parameters and public variables used in the code are viewed in
read-only.
is in know-how pro-
no access is possible.
tection
Contract/Expand
If the variable in the animation table is preceded by the + symbol, to know the objects
associated to the variable:
l select the variable,
l select the Edit → Expand command or double click on the +, so the list of asso-
ciated variables is displayed.
To contract the list of objects associated to the variable, select the Edit → Contract
command or double click on the -.
Displaying/
All the displayable ASCII characters (eg: 1,2,A,B,+,…) are displayed only in anima-
Modifying a
tion and the non-displayable ones are replaced by a vertical dash. The NULL char-
character string
acter shows the end of the chain. It is not displayed. In animation, only the first 10
characters are displayed.
To Display/Modify a whole string, you can:
l double click on the concerned cell,
l select the Display → Modify menu (as a contextual menu or on the menu bar).
Modification: all the objects whose attributes are mandatory inputs (objects whose
attributes are by reference) are not modifiable.
The operate
According to the type of table chosen in the DFB editor (static or dynamic), the An-
mode for the
imation tables tool offers:
tables
l static tables: Contract/Expand expand to the same level as the number of the
element,
l dynamic tables: (in connected mode with the PLC in RUN) Contract/Expand ex-
pand when the instance is executed and the number of elements is known.
315
Adjustment of variables
Modification of the variables:
Introduction
The software allows you to create animation tables containing lists of variables, to
know the value of the variables with different types of display and to force the bit vari-
ables.
The variables tables can be created in local or in connected mode.
Viewing the state In connected mode, you can activate (Service → Animate command) or deactivate
of the variables
a table’s animation (Service → Stop animation command). The animation is car-
ried out asynchronously: all the values of the objects are read in the processor at the
end of the MAST task’s cycle. You can view each value on the screen in different
display modes. The available modes depend on the type of the object. It is also pos-
sible to individually modify the value of a variable and to force or unforce the value
of a bit.
Modifying a
Steps to follow:
variable
Step
Action
1
Select the variable and put the cursor on the Current value zone.
2
Input the variable’s value and confirm with Modify.
Forcing a bit in
Steps to follow:
an animation
Step
Action
table
1
Select the variable to be forced and put the cursor on the Current value zone.
2
Select Force 0 to force the bit to zero. The forcing is shown by the letter F.
Select Force 1 to force the bit to 1 and the forcing is again shown by the letter
F.
Unforcing a bit in
Steps to follow:
an animation
Step
Action
table
1
Select the variable to be unforced and put the cursor on the Current value
zone.
2
Select Unforce.
316
Adjustment of variables
List of forced bits
Introduction
PL7 features a tool which allows you to view the list of forced bits in the PLC at any
given time without having to go into the animation table in the usual way.
Principles
The forced bits display function is available from the PLC menu in online mode only.
Launch the forced bits search and the resulting list is displayed in the animation ta-
bles editor. The entire man-machine interface is therefore sub-processed to the an-
imation tables editor.
The " Forced bits list" tool can be broken down into 2 components:
l A component in the PLC’s OS environment, with the following functions:
l managing a forced bits trace table in order to optimize the search,
l implementing a request to read the trace table.
l A component in the PL7 environment, with the following functions:
l searching for forced bits and creating a list of forced bits,
l initializing an animation table from this list.
List of forced
You must be in online mode to access this tool.
bits" tool
Click on PLC → List of forced bits.
There are two possible scenarios:
If…
Then…
the PLC
the following message is displayed: "No forced bits."
contains
no forced
bits
there are
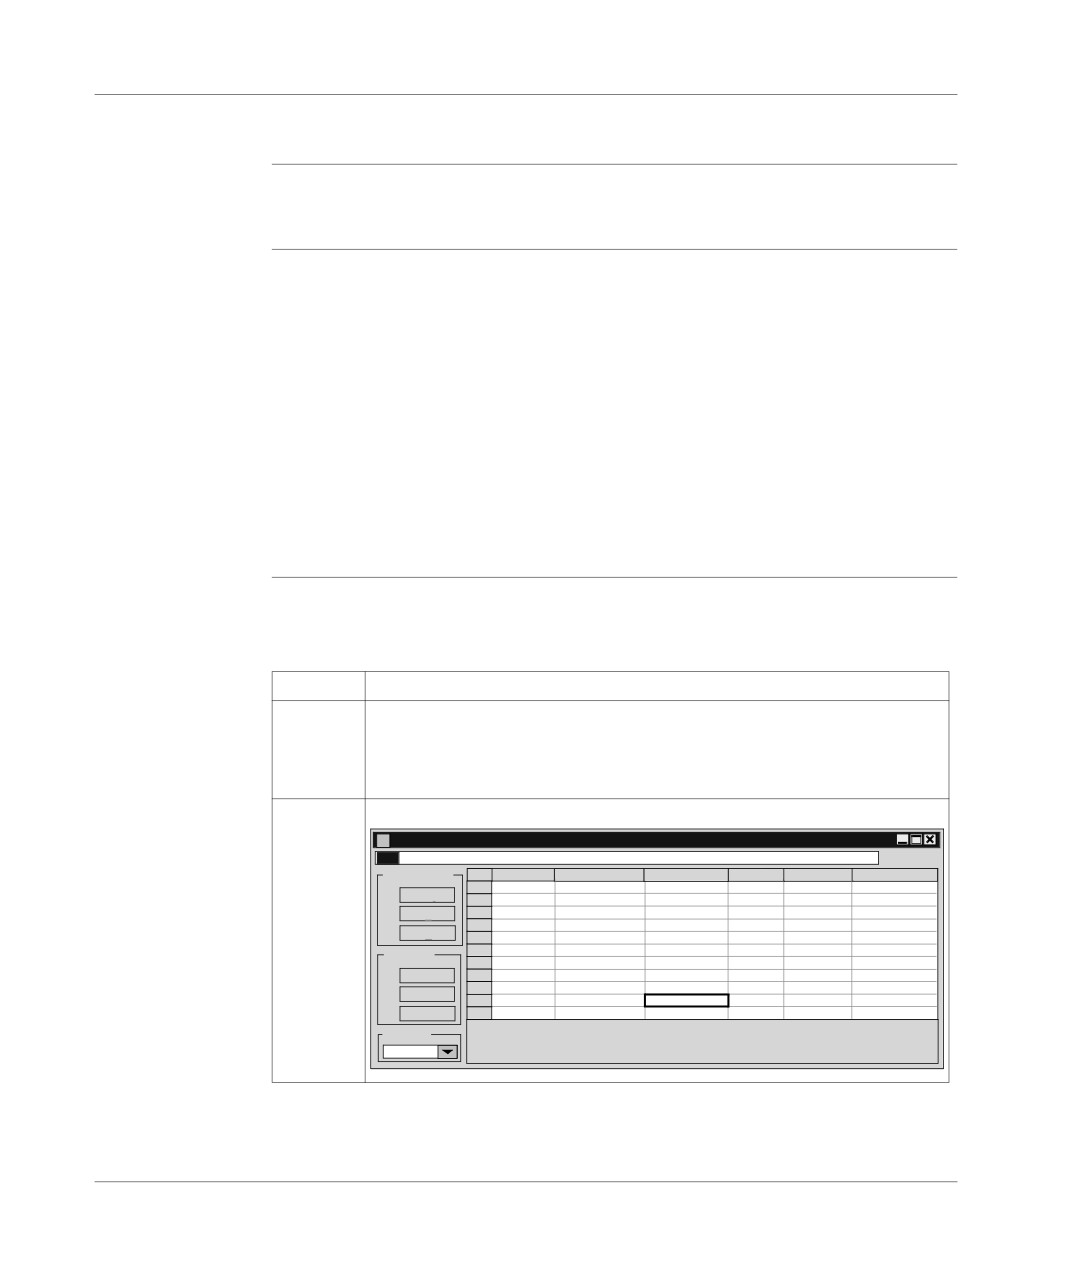
a forced bits animation table appears:
forced bits.
TABLE_1 (Animated)*
F 1
10/11
Modification
Address Symbol / Name
Current value
Kind
Type
Comment
%SW108
9
F3
Modify
%M201
F1
F7
0
%M202
F1
%M203
F1
F8
1
%M204
F1
Forcing
%M205
F1
%M206
F1
F4
Forcing 0
%M207
F1
%M208
F1
F5
Force 1
%M209
F1
F6
Unforce
Display
Dec.
317
Adjustment of variables
When the table is open, the PLC → List of forced bits command restarts the search
creating another forced bits animation table.
Note: the List of forced bits table displays the forced bits at a given time t in the
PLC and this table is not refreshed. In fact, we have a static image of the data read
in the PLC at the time at which the PLC → List of forced bits is executed. To ob-
tain the list of forced bits at any given moment t+1 another List of forced bits table
must be launched.
318
Adjustment of variables
Contents of the
The contents of a list is identical to the contents of an animation table except that the
"List of forced
system word %SW108 which gives information about the number of forced bits in
bits" table
the PLC, appears at the start of the list.
Review of table fields:
l address,
l symbol,
l current value,
l kind,
l type,
l comments.
Limits and
A List of forced bits table has a display capacity of 32 forced bits.
restrictions
If the table is full, no further new forced variables are stored and the %S108 bit sys-
tem switches to 1. In the case of additional forcing, an OS internal flag will indicate
this overflow.
When the maximum number of forced bits is reached, the OS component saves no
further forcing/unforcing actions in the table. However, these actions are still carried
out and there is no change to the operating procedures at the user and PL7 end.
In this context, there is inconsistency between the table contents and the PLC mem-
ory. An information message is displayed, which could be:
l "Overflow of number of forced bits",
l "Cold start necessary to reinitialize the forced bits table",
l "OK".
The forced bits list will be displayed again following a cold start (reinitializing all the
forced bits and the forced bits table).
319
Adjustment of variables
320
Diagnostic functions
15
Introduction
Subject of
This chapter describes the diagnostic functions available for diagnosing the hard-
chapter
ware and the application.
What’s in this
This Chapter contains the following Maps:
Chapter?
Topic
Page
Diagnostic of the PLC’s last stop
322
Module/channel diagnostics
323
Program diagnostics
324
Module call stacks
326
Diagnostics DFBs
327
Implementation of diagnostics DFB
328
DFB diagnostics error messages
329
321
Diagnostic functions
Diagnostic of the PLC’s last stop
Introduction
To access the diagnostic of the PLC’s last stop, you need to be in connected mode.
How to access
The UC debugging screen which is accessible through the Debug → Access UC
the diagnostic of
debugging screen command, allows you to know the cause of the last stop and
the PLC’s last
the date when this stop happened.
stop
Refer to the debugging chapter, last stop zone (See Last stop zone, p. 282).
322
Diagnostic functions
Module/channel diagnostics
Introduction
The software provides various diagnostics tools. You must be in online mode to ac-
cess these tools.
Note: the diagnostics for the Discrete modules and for the analog modules are
performed in the same way as those described below.
How to access to
Carry out the following steps:
module/channel
Step
Action
diagnostics
1
Select the command PLC → Connect.
2
In the Application Browser in the structure view, select the Configuration
directory then double click on Hardware configuration.
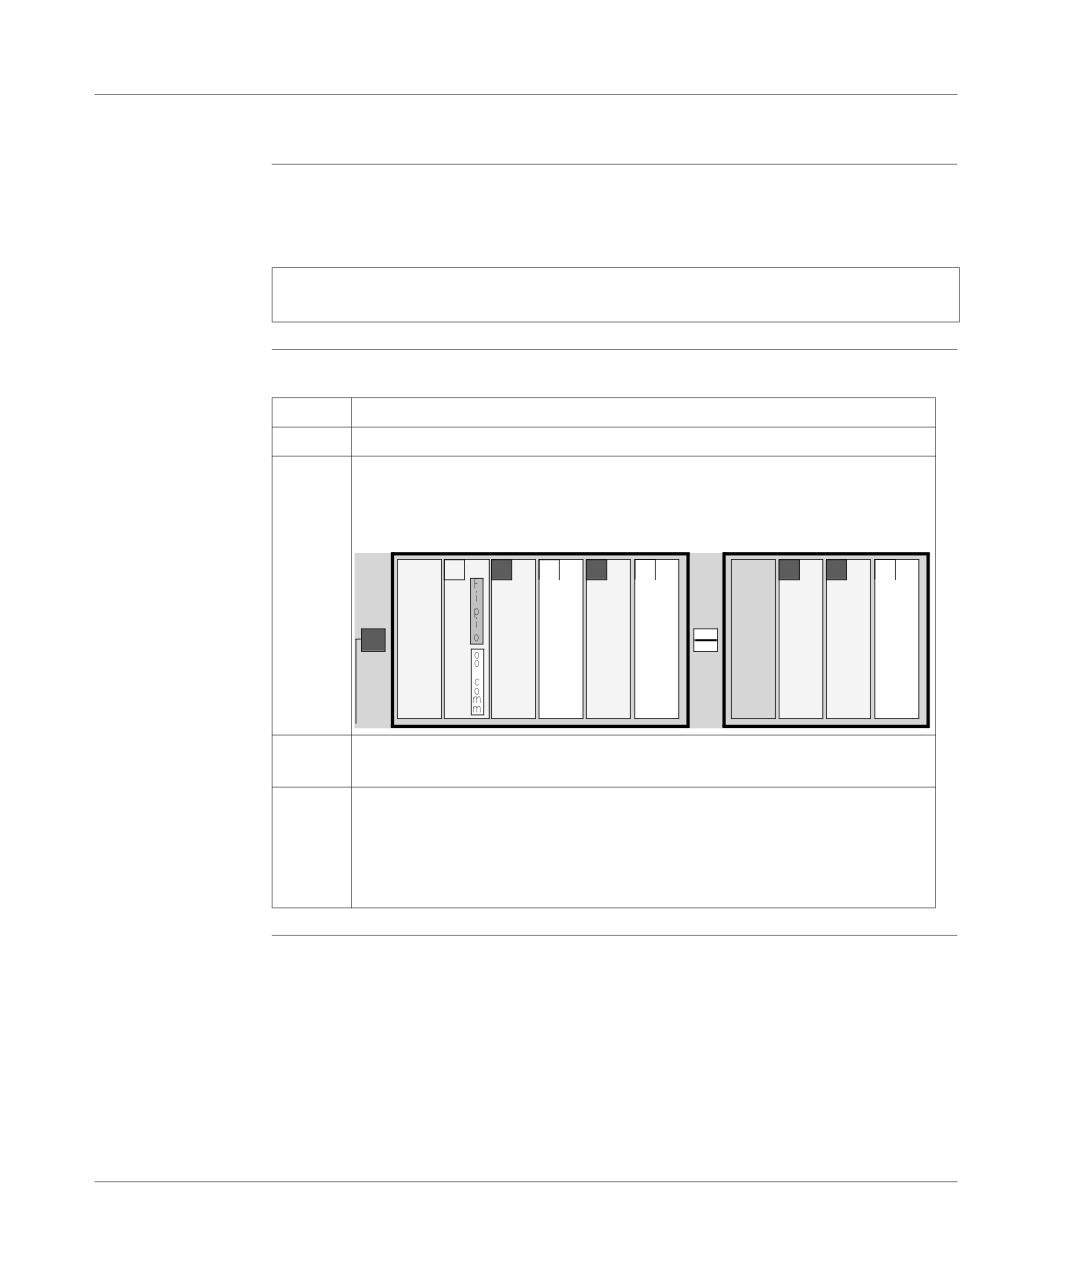
When a module is faulty, a red indicator appears on the module position (see
example below).
0
1
2
3
4
8
9
10
P
T
D
D
D
D
S
S
E
S
E
S
Y
X
Y
Y
Y
Y
0
2
5
0
0
1
1
6
7
8
8
6
6
0
3
R
D
A
R
0
5
4
2
2
5
2
D
3
Select the position of the faulty module, then right click and choose the Open
the module command or double click on the selected position.
4
Click on the Diag button.
The Diagnostics module screen displays the errors classified by category: in-
ternal errors, external errors or other errors.
The Channel Diagnostics screen which is accessible by the Diag button in
the command zone is used to refine the results.
323
Diagnostic functions
Program diagnostics
Introduction
To access the diagnostics tools it is necessary to be in online mode. To connect, se-
lect the PLC → Connect command.
Program diagnostics is used to find out the cause and the source of the switch to
error mode. Various types of error are signaled:
l blocking errors (which cause the execution to be stopped),
l non-blocking errors (which become blocking when the application monitoring op-
tion is selected),
l non-blocking errors.
Blocking errors
Blocking errors causing the execution to be stopped:
(causing the
l HALT instruction,
execution to be
l incomplete JUMP instruction,
stopped)
l watchdog overflow,
l Grafcet table overflow (active steps, valid transitions),
l undefined downstream step (rerouting to one step).
Non-blocking
Non-blocking errors which become blocking when the application monitoring option
errors (which
is selected:
become blocking
l index overflow,
when the
l division by zero,
application
l capacity overflow of an unsigned arithmetic calculation,
monitoring
l character string error (the character string transfer zone is too small to accommo-
option is
date this string),
selected)
l floating point calculation error (division by zero, capacity overflow, incompatibility
with the IEEE 754 format following the overlap of the memory zones etc.).
Non-blocking
the following are non-blocking errors:
errors
l cycle time overflow,
l task inputs/output overflow,
l capacity overflow during an arithmetic calculation.
A blocking error is signaled on the status bar.
324