Network Intrusions Responder Program (NITRO). Instructor Guide - page 8
Fundamentals of Log Analysis
Network Intrusion Responder Program
Hypothesis Evaluation
Hypothesis
A hypothesis is evaluated using digital forensic data acquisition
Evaluation
and analysis techniques. A general process for this is listed below,
and will be described in further detail in the following pages.
1. Acquire target log files
2. Review the format of collected logs
3. Establish search/extraction criteria based upon predicted
artifacts and log format
4. Search log files and extract relevant data
5. Record and correlate findings
6. Document unexpected findings related to the case (“leads”)
Procedure
There are many technical procedures you can implement to
Selection
accomplish each of the tasks listed above. For instance there are
multiple methods of searching and filtering log files presented in
this text. Applied procedures should meet the following criteria:
The procedure can locate specific potential artifacts identified
in the previous step in the Scientific Method.
The procedure should have been tested and peer reviewed
The procedure should be repeatable
The procedure should be as objective as possible
9-38
For Official Use Only - Law Enforcement Sensitive
01/09
Network Intrusion Responder Program
Fundamentals of Log Analysis
Acquiring Target Log Files
Acquiring Log
You will most likely acquire log files through one of the following
Files
methods:
Log files may be provided directly to you by an incident
responder or network administrator who collected them from
the original source media.
You may obtain a physical or logical image of the original
storage media containing the log files, and then extract the logs
from that image.
You may logically copy log files from the source system or
device using a live forensic tool such as LiveWire Investigator.
Regardless of the method, ensure that the logs are collected in a
sound manner in accordance with maintaining the integrity of the
evidence to the best of your ability. This includes hashing any log
files you receive and comparing those hashes against those
provided by the responder.
01/09
For Official Use Only - Law Enforcement Sensitive
9-39
Fundamentals of Log Analysis
Network Intrusion Responder Program
Previewing Log Formats
Previewing Log
Before analyzing collected logs, you should first preview the
Formats
format of those logs to ensure that you know how to read them
properly and use the correct methods for searching them. Search
techniques are significantly different between text and binary logs.
Furthermore, information may be presented in different forms in
text logs. There may be different field formats and field and record
separators. For example, time may be represented in a 24-hour
format, or in a 12-hour format with AM or PM specified.
Determining File
The first step in previewing log format is to determine the file
Type
type. This can be done by:
Viewing the file extension, and correlating it to a file type. For
instance a file with a “.EVT” extension is a Windows Event
Log file and should be viewed in the Microsoft Event Viewer
application. If unfamiliar with the extension, research it online.
Using the GNU “file” command on a Linux, Unix, or OS X
based computer. This does not rely on file extensions, so it is
most useful if the log file does not include an extension. Usage
example:
[prompt]# file evidence.log
Attempting to view the file with a text log viewer, such as
notepad.exe, or a GNU command such as “cat”, “more”, “tail”,
etc. If successful you will have determined that the file is a text
log and viewable as such.
The File - Open dialog in Wireshark will display the format of
binary capture files that it recognizes when you highlight the
file.
Determining Data
Once you know the file type for each log, you should identify the
Format within a
format of the data within. For network traffic capture logs, this is
Log
relatively uniform. Text logs will vary. When presented with a text
log, you should:
Determine if the records include one line or multiple lines.
Identify the field and record separators.
Determine where common data types (IP addresses, port
numbers, date/time, etc.) are located in each record, if
anywhere. Also determine if these locations are always the
same, or variable.
9-40
For Official Use Only - Law Enforcement Sensitive
01/09
Network Intrusion Responder Program
Fundamentals of Log Analysis
Establishing Search/Extraction Criteria
Search/Extraction Your general goal will be to search for and extract log entries, or
Criteria
portions of log entries that support or contradict your hypothesis.
To do this, you find entries that include either observed or
predicted artifacts. Typical criteria for finding these entries
include:
The known or estimated time frame
Observed or predicted source or destination IP addresses
Messages that correlate with observed or predicted activity
Observed user name or alias
Observed or predicted network protocols or traffic types
Any combination of the criteria mentioned in the items above
These examples are guides. There is no hard and fast rule for
choosing specific search and extraction criteria. Rather the criteria
must be selected based upon the potential for resulting data to
further the investigation of the hypothesis.
01/09
For Official Use Only - Law Enforcement Sensitive
9-41
Fundamentals of Log Analysis
Network Intrusion Responder Program
Searching Log Files and Extracting Relevant Data
Searching Log
At this point, you will use the search and extraction techniques
Files and
presented earlier to obtain the target data. When performing these
Extracting Data
tasks, maintain focus on the search/extraction criteria you have
established. Investigative tangents based on your intuition can be
beneficial, but should be kept to a minimum when attempting to
process large amounts of data.
9-42
For Official Use Only - Law Enforcement Sensitive
01/09
Network Intrusion Responder Program
Fundamentals of Log Analysis
Recording and Correlating Findings
Recording
As noted earlier, your method for recording findings will vary
Findings
depending upon the approved data repositories used by your
organization. This course will use a spreadsheet document
provided by your instructor.
Correlation:
The main task of correlation is the establishment of a unified
Timeline
timeline. This is accomplished by one of the these methods:
Unification
1) Normalizing all log files to a synchronized time and time
notation. This involves changing the actual date/time
stamps in a log file and should only be performed on
working copies of a log. Investigators must ensure that they
do not perform this step on original evidence as the
information will be permanently altered, which could
prevent it from being admissible in court.
2) Record all events identified during initial observation and
subsequent testing/evaluation into a single timeline,
adjusting the time on each event as necessary as it is
recorded.
If you perform these tasks, the resulting timeline can be read
sequentially, providing a top-level view of events from all sources.
The first option should only be used if you have access to a tool
that can reliably interpret and skew the date/time stamps from all
log formats, or if you can script this action yourself. Otherwise,
use the second option.
Note: Sawmill can skew log file date/time stamps in 1 hour
increments.
01/09
For Official Use Only - Law Enforcement Sensitive
9-43
Fundamentals of Log Analysis
Network Intrusion Responder Program
Recording and Correlating Findings, continued
Correlation: Event
Verify events by checking each log entry for another recording of
Verification
the same event from other sources. Some useful techniques for
correlation include:
Any network event can be correlated with the data in a full
network traffic capture, if it is available.
Verify Web browser history with proxy server logs. Both will
record URL access and the associated times.
Verify IDS scan alerts with firewall logs. A firewall will often
block and log some of the scan packets.
Verify IDS password attacks alerts with authentication logs,
such as the Windows Security Event Log or /var/log/secure,
etc.
Verify e-mail header date/time stamps with e-mail gateway or
e-mail server logs.
Correlation: Using
The dates/times for events verified against multiple sources can
Event Verification
also be compared to see if there is a time skew between the data
to Synchronize
sources. For instance, the IE history for a user may show access to
Times
Web mail occurring at 2105, but the Web proxy shows that access
occurring at 2135. The analyst could use these two events to
determine that the proxy server clock was most likely set 30
minutes behind the clock on the subject system.
Ideally, there would be multiple events verification that could be
used to confirm time skew. More verified events produced
increased confidence in the time skew established by the
investigator. Additional methods for date/time correlation include:
Compare date/time stamps embedded in files with the file
system date/time stamps.
Compare the date/time stamp of the last entry in a log with the
file system last accessed time.
If an event involved access to one or more files, check the
appropriate file system date/time stamps for that file. For
instance, if an IDS alert indicated the traversal of a Windows
command shell banner over the network, check the NTFS/FAT
last accessed time for cmd.exe, or for the prefetch file
corresponding to cmd.exe.
9-44
For Official Use Only - Law Enforcement Sensitive
01/09
Network Intrusion Responder Program
Fundamentals of Log Analysis
Keeping Track of New Leads
Unexpected
You will often discover information that was not directly predicted
Findings
during the initial analysis of your hypothesis. This information can
be called a “lead.” This information is sometimes related to your
hypothesis, and other times be important, but outside the current
path of your investigation. In either case, such information should
be recorded so that it can be followed up as needed.
Lead Tracking
New leads should be documented. In addition to your investigative
notes, leads should be recorded in your Attribute List spreadsheet
along with other relevant data. However entries representing leads
should be marked as to whether or not they are relevant to a
current working hypothesis.
Marking these entries makes it easier for you to review your
results at a later time to determine if you need to modify your
current hypothesis or create a new one. Methods for annotating an
attribute entry as a lead include:
Highlighting the entry in a different color
Listing lead entries on a separate page, tab, table, etc.
Using a column in a table to mark entries as leads
01/09
For Official Use Only - Law Enforcement Sensitive
9-45
Fundamentals of Log Analysis
Network Intrusion Responder Program
This page intentionally left blank.
9-46
For Official Use Only - Law Enforcement Sensitive
01/09
Network Intrusion Responder Program
Log Sources
Module 10
Log Sources
Overview
Knowing where the logs of interest reside on a system is a key
piece of information when starting a network investigation. In this
module, you will see some of the typical locations of logs for
select applications and systems.
Purpose of this
You will learn where to look in Windows, Linux, Solaris and
Module
general IDS systems for logs of interest. In some cases, you will
look at the typical contents of these logs to give you a better
understanding of them.
Objectives
After completing this module, you will be able to:
Describe the storage locations of typical log files
Discuss some of the log file formats
Recognize IDS logs and their contents
In this Module
The following table shows the contents of this module.
Topic
See Page
Lesson 1 - Windows Log Sources
10-3
Lesson 2 - Linux Log Sources
10-9
Lesson 3 - Solaris Log Sources
10-13
Lesson 4 - Log Searching
10-15
Lesson 5 - IDS Logs
10-19
01/09
For Official Use Only - Law Enforcement Sensitive
10-1
Log Sources
Network Intrusion Responder Program
This page intentionally left blank.
10-2
For Official Use Only - Law Enforcement Sensitive
01/09
Network Intrusion Responder Program
Log Sources
Lesson 1 - Windows Log Sources
Introduction
This lesson will cover the most common logs found in a Windows
environment.
Purpose of this
The purpose of this lesson is to list the locations of log files for the
Lesson
operating system and several standard applications in a Windows
environment.
Objectives
After completing this lesson, you will be able to:
Explain where Windows Logs are stored
Recognize naming conventions of log files
Identify some of the file formats for these files
In this Lesson
The following table shows the contents of this lesson.
Topic
See Page
Windows Logs
10-4
Windows Services Logs
10-6
01/09
For Official Use Only - Law Enforcement Sensitive
10-3
Log Sources
Network Intrusion Responder Program
Windows Logs
Mail
Windows comes with a version of Outlook or Outlook Express
mail client. The default location for these log files in Windows
2000, Server 2003 and XP is inside each user’s profile.
The log concerning Outlook’s MAPI accounts, typically used by
most users, is found at: C:\Documents and
Settings\username\Local Settings\Temp\Opmlog.log
If a user has established a Hotmail account in Outlook, these
events will be logged in:
C:\Documents and Settings\username\Local
Settings\Temp\Outlook Logging\Hotmail\http0.log.
Microsoft SQL
Microsoft SQL Server, one of the most popular database services
Databases
used in businesses, stores its log files in the directory:
C:\MSSQL\LOG
In this directory, you will find the following log files:
ERRORLOG - MS SQL’s default error log file. If logging is
configured to create new files on a routine basis, or if the file
grows too large, additional error logs will be created with a
sequential number appended to the end.
SQLAGENT.OUT - Can contain information generated by
the SQL programmer or messages generated by default in the
administrative panel. These files can have version numbers at
the end as well. The file with the OUT suffix is the current log.
SQLDump9999.txt and SQLDump9999.mdmp - These are
special dump files that can be generated if the SQL Server
crashes or terminates unexpectedly. The information in these
files generally contains memory and data pointers at the time of
the failure. It is also possible for the administrator, or attacker
to force the generation of these files under special
circumstances.
Note: If the server is running, you may not be able to copy or
open the current log files.
10-4
For Official Use Only - Law Enforcement Sensitive
01/09
Network Intrusion Responder Program
Log Sources
Windows Logs, continued
MySQL
MySQL is free, open source database application that is also
popular on many Windows systems. The default location for
installation of MySQL in Windows is:
C:\Program Files\MySQL\MySQL Server X.X
In this folder name, X.X is the software’s version number. Under
this folder are the following directories and logs:
bin: Contains the client programs and server program
data: Holds the log files and the actual databases
share: Has the error message files
The error filename will typically start with the network host name
of the system MySQL is running on and end with the .err suffix.
For example, enron.err.
Microsoft Access
Microsoft stores any errors generated by Access in the Windows
Event logs. For information on how to retrieve these logs, refer to
the System Logs section below.
01/09
For Official Use Only - Law Enforcement Sensitive
10-5
Log Sources
Network Intrusion Responder Program
Windows Services Logs
Internet
IIS is a service used by millions of Windows-based servers to host
Information
Web, FTP, and e-mail services. Depending on the version of IIS in
Server (IIS)
use, these logs can be found in different locations. While IIS will
normally store its logs into a default folder, this location can be
easily changed in the administration control panel.
For IIS versions 4 and 5, found on Windows NT 4.0 and Windows
2000, log files will be stored in: C:\winnt\system32\logfiles
For IIS version 6 and 7, found on Windows XP and newer
systems, log files will be stored in: C:\windows\system32\logfiles
Log file names will be named “W3SVC” followed by the Site
Instance ID, which is numbered sequentially for each service. For
example, the first web site log files will start with W3SVC1, and
the second will be W3SVC2.
Because all Web enabled services originate in the IIS service, FTP
and DNS messages will be mingled in this same file if their
services are active.
10-6
For Official Use Only - Law Enforcement Sensitive
01/09
Network Intrusion Responder Program
Log Sources
Windows Services Logs, continued
System Logs
Almost all other services that originate in the Windows
environment will log entries into one or all of the standard Event
Logs for the system.
These logs are divided into the Application, Security, and System
logs. If you want to use or view these logs, you must use the Event
Viewer that is available from the Administrative Tools Control
Panel.
Unless you use a specialized tool like the Event Viewer, the native
log files are stored in a mixed binary format, making standard text
based tools ineffective. You can choose the log file you are
interested in from the menu in Event Viewer and then choose
Export List from the Actions drop down menu to export the log as:
Tab Delimited text
Comma Delimited text
Tab Delimited Unicode text
Comma Delimited Unicode text
Once exported, these files can be filtered and searching using tools
like Grep and Findstr.
Directory Services If Directory Services is configured for diagnostic logging events
that generate a log event, these events will be found in the Event
Viewer with the System, Application and Security logs in a
separate table called Directory Services.
Remote Logs
Looking at mounted share locations and names may give you an
indication that logs are being stored remotely. Examination of
these remote shares may give you folder and file names which will
indicate what types of logs are being stored remotely.
01/09
For Official Use Only - Law Enforcement Sensitive
10-7
Log Sources
Network Intrusion Responder Program
This page intentionally left blank.
10-8
For Official Use Only - Law Enforcement Sensitive
01/09
Network Intrusion Responder Program
Log Sources
Lesson 2 - Linux Log Sources
Introduction
This lesson will cover the common and most used logs found in a
Linux environment.
Purpose of this
The purpose of this lesson is to list the locations of log files for the
Lesson
operating system and several standard applications in a Linux
environment.
Objectives
After completing this lesson, you will be able to:
Explain where Linux logs are stored
Identify naming conventions of log files
Recognize some of the file formats for these files
In this Lesson
The following table shows the contents of this lesson.
Topic
See Page
Linux Logs
10-10
01/09
For Official Use Only - Law Enforcement Sensitive
10-9
Log Sources
Network Intrusion Responder Program
Linux Logs
Mail Logs
Because Linux is based on the Unix style kernel, mail services are
provided by sendmail processes. Logs for these services can
usually be found in the file:
/var/log/maillog
Database
MySQL is the most popular database program within the Linux
community. MySQL logs can typically be found in the
/var/log/mysqld.log file.
Services
Linux services are usually found in the following directories and
files:
/var/log/message: General messages and system related errors
/var/log/auth.log: Remote Login Authentication logs
/var/log/secure: Remove Login Authentication log
/var/log/kern.log: Kernel logs
/var/log/cron.log: Crond logs, for services that start
automatically
/var/log/httpd/: Apache web server access and error logs
directory
/var/log/boot.log : System boot log
/var/log/utmp or /var/log/wtmp : Binary Login history file
/var/log/yum.log: Yum log files to track installed and
uninstalled applications
Directory
Linux doesn’t support Microsoft Active Directory directly, but
Management
there are many third party add-on tools available providing this
service. You will need to seek out documentation for the specific
AD tool and determine the location of logs for each tool.
10-10
For Official Use Only - Law Enforcement Sensitive
01/09
Network Intrusion Responder Program
Log Sources
Linux Logs, continued
System Logs
Most Linux system log entries are located in the /var/log/message
file.
Remote Logs
Looking at mounted share locations and names can give you an
indication that logs are being stored remotely. Examination of
these remote shares can give you folder and file names which will
indicate what types of logs are being stored remotely.
01/09
For Official Use Only - Law Enforcement Sensitive
10-11
Log Sources
Network Intrusion Responder Program
This page intentionally left blank.
10-12
For Official Use Only - Law Enforcement Sensitive
01/09
Network Intrusion Responder Program
Log Sources
Lesson 3 - Solaris Log Sources
Introduction
This lesson covers the common and most used logs found in a
Solaris environment.
Purpose of this
The purpose of this lesson is to list the locations of log files for the
Lesson
operating system and several standard applications in a Solaris
environment.
Objectives
After completing this lesson, you will be able to:
Explain now where Solaris logs are stored
Recognize naming conventions of log files
Identify some of the file formats for these files
In this Lesson
The following table shows the contents of this lesson.
Topic
See Page
Solaris Logs
10-14
01/09
For Official Use Only - Law Enforcement Sensitive
10-13
Log Sources
Network Intrusion Responder Program
Solaris Logs
Mail
Depending on the version of Solaris you are examining, you may
find a file in the /etc directory called syslog.conf, and it may have
the location of sendmail logs listed inside.
Many ISP’s have gone to custom mail software and you may have
to seek documentation on the software to determine the log file
location.
Databases
If MySQL is installed on the Solaris system you will find the logs
in the default locations of either /usr/local/mysql/data or
/opt/mysql/mysql/data.
Oracle is a popular database for Solaris systems. You will need to
determine the version and release level of Oracle software and
then search for the default installation location of log files.
Services
In Solaris, most services put log messages in the
/var/adm/messages log file. It is the general catch all file for log
entries in a Solaris environment.
Directory
Solaris doesn’t natively support Microsoft Active Directory
Management
directly, but there are numerous third party add-on tools available
providing this service. You will need to seek out documentation
for the specific AD tool and determine the location of logs for each
tool.
System
Traditionally all system log files will be located in the /var
directory in a Solaris environment. You will not be able to open
files that are in use. There usually are several nested directories of
log files under the /var directory and your investigation may show
that some or all of these files may have information of evidentiary
value.
Remote Logs
You may have to search for pipes and hard links to mounted
volumes to discover whether logs are being stored remotely on a
Solaris system. In this environment, you may want to locate a
certified Solaris administrator to discover some of the obfuscated
links.
10-14
For Official Use Only - Law Enforcement Sensitive
01/09
Network Intrusion Responder Program
Log Sources
Lesson 4 - Log Searching
Introduction
This lesson presents several ways to manually search through a log
file.
Purpose of this
The purpose of this lesson is to show ways in which you can use
Lesson
commonly available tools to search log files.
Objectives
After completing this lesson, you will be able to:
Explain how to use the findstr command
Describe how to use Grep/Egrep
Explain the basics of regular expressions
In this Lesson
The following table shows the contents of this lesson.
Topic
See Page
Log Searching
10-16
Regular Expressions
10-17
Regular Expressions: Literal Characters
10-18
01/09
For Official Use Only - Law Enforcement Sensitive
10-15
Log Sources
Network Intrusion Responder Program
Log Searching
Overview
Flexibility is the most important feature for log file searching
tools. You will encounter a wide variety of log files that will
require you to search for different types of values. Your tools and
techniques must be usable regardless of the log type and the value
for which you are searching.
GREP
One of the primary applications used for searching and filtering
text logs is GREP (Global Regular Expressions Print), and its
newer version EGREP (“Extended”GREP). These applications use
regular expressions to define search parameters. These
applications are used because regular expressions are the most
common method for defining search parameters and they are used
in many other popular applications, such as PERL, Snort, and
EnCase.
While GREP is typically found in Unix, Linux, and OS X
environments, there are versions available for the Windows
operating systems.
FINDSTR
While Windows does not natively ship with GREP, it does include
a similar command line utility called Findstr that can help find
specific strings of text in a log file or other type of text file. Typing
“findstr /?” at the command prompt will display the quick help
screen of options and the command format.
Options that may be of interest are:
/I to disable case sensitivity
/S to search all files in the current directory and subdirectories
/R to allow the use of regular expressions
/N to print line numbers
/G:filename to use a file of key strings to search for
10-16
For Official Use Only - Law Enforcement Sensitive
01/09
Network Intrusion Responder Program
Log Sources
Regular Expressions
Introduction
Regular expressions are patterns used for executing searches and
filters. This is accomplished by combining literal text and special
characters, called metacharacters, to create a pattern used to
search files.
Examples of items that have a set pattern and can be identified
with regular expressions include:
IP addresses
Dates and time
Phone numbers
URLs
Credit card numbers
Social Security numbers
For example, an investigation may require that all IP addresses be
extracted from a set of logs and put together in a central list. You
would not search for a specific IP address because that search
would miss IP addresses with different values. The search would
have to be for any number that matches the decimal representation
of an IP address, which consists of 4 numbers, 1-255, that are
separated from each other by periods. Regular expressions can be
used to accomplish this and other similar tasks.
You need to understand regular expressions and how to use them
effectively to search or filter the wide range of text logs. Many
tools incorporate regular expression engines into their standard
functionality. Some GNU command line tools, such as grep/egrep,
sed and awk, as well as many text editors, allow searching and/or
replacement of text through the use of regular expressions. Regular
Expression engines and syntax may vary slightly from product to
product.
The basic syntax for egrep is:
[prompt]# egrep “<expression>” <target log file>
01/09
For Official Use Only - Law Enforcement Sensitive
10-17
Log Sources
Network Intrusion Responder Program
Regular Expressions: Literal Characters
Literal Character The simplest type of regular expression is the literal representation
Searches
of the target value. For example, you could search for the word
“jsmith” in the file log.txt by simply telling egrep to search for the
string “jsmith”:
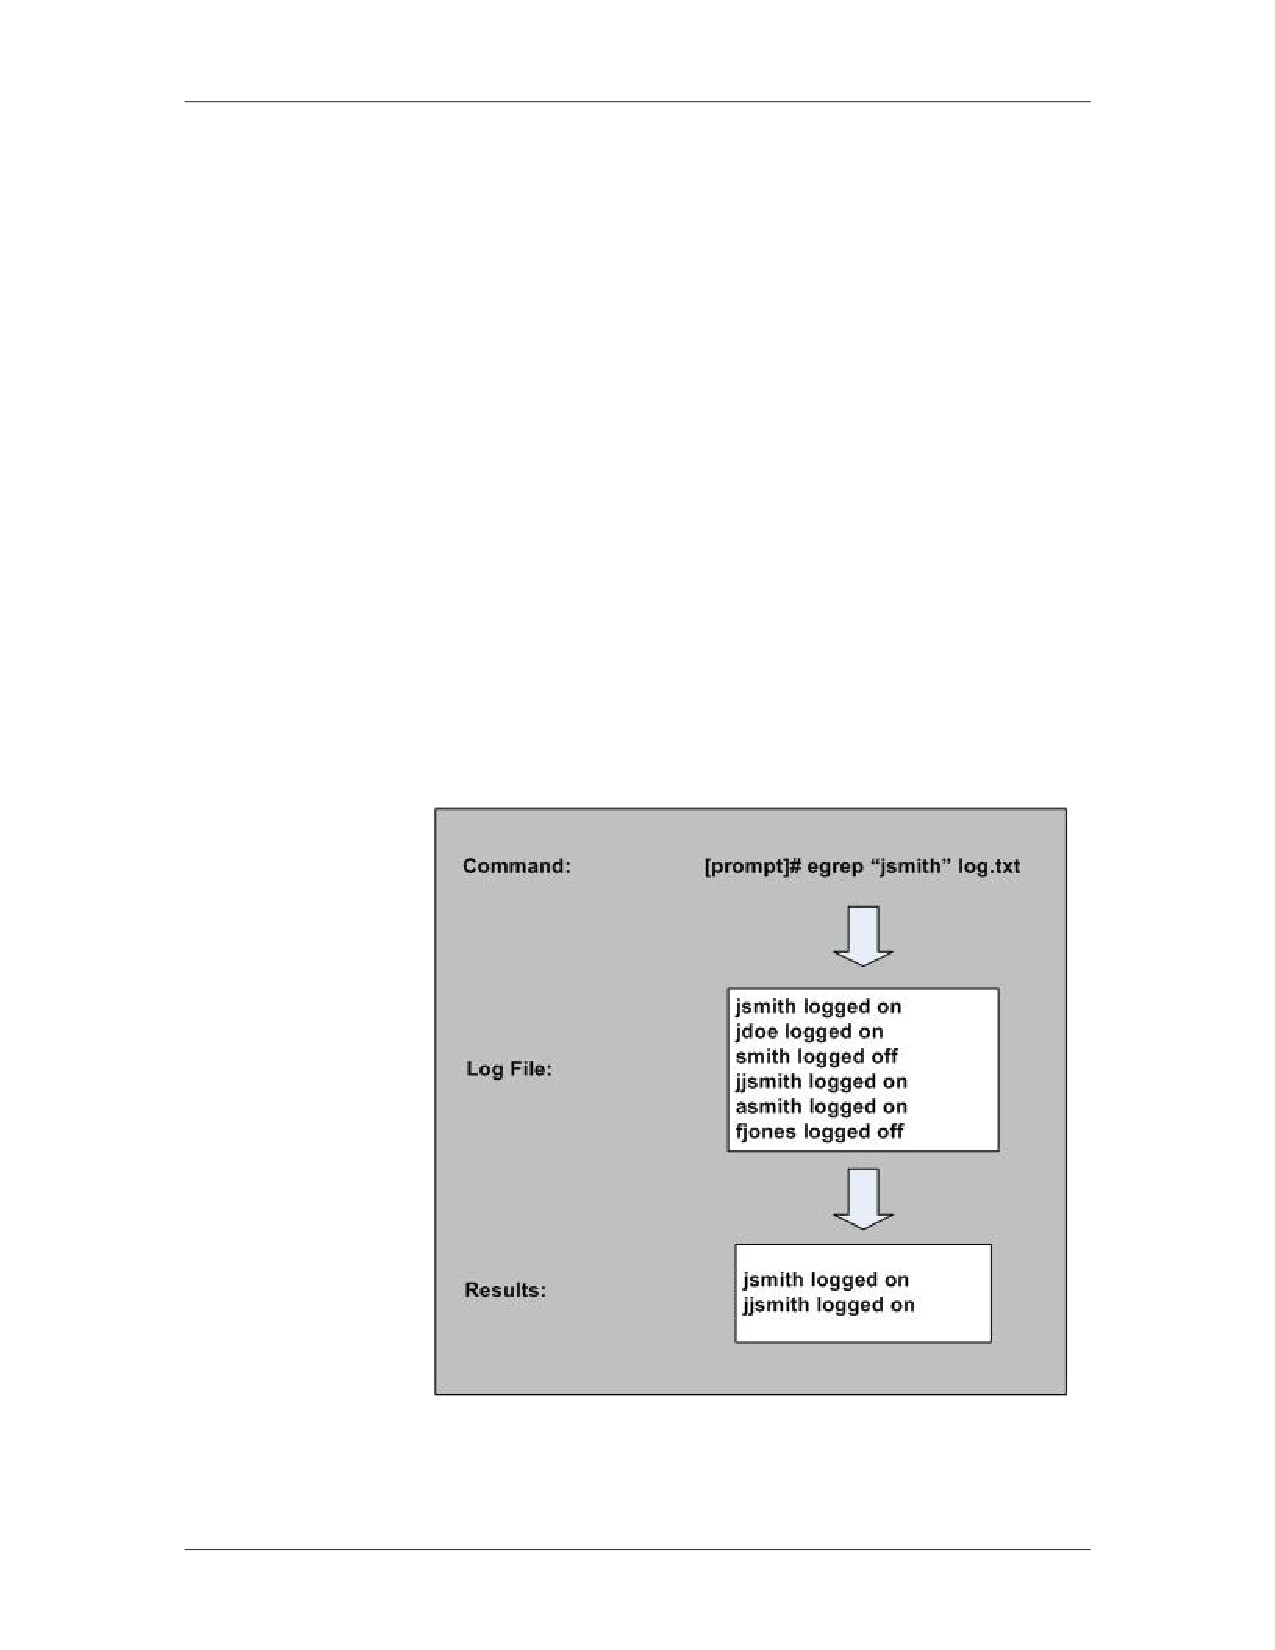
[prompt]# egrep “jsmith” log.txt
Most programs search a file one line at a time. This means that the
command line above will return each line in a file that contains the
string “jsmith” to whatever output is specified.
An example of a search for a literal string is shown below. In the
example, a log file is searched for the string “jsmith” using egrep,
and the results are displayed. Notice that any line that included the
string “jsmith” was matched, even the one that begins with
“jjsmith.” In a search for a literal string, it does not matter what is
before or after the target, only that the target exists within the line.
This means that the target “jsmith” could be a stand-alone word, or
just part of a word, such as “jsmithsonian.”
10-18
For Official Use Only - Law Enforcement Sensitive
01/09
Network Intrusion Responder Program
Log Sources
Lesson 5 - IDS Logs
Introduction
This lesson will cover Intrusion Detection System logs.
Purpose of this
The purpose of this lesson is to increase your understanding of
Lesson
typical IDS logs and to introduce the Snort tool.
Objectives
After completing this lesson, you will be able to:
Recognize the importance of IDS logs
Explain how Snort is used
In this Lesson
The following table shows the contents of this lesson.
Topic
See Page
IDS Logs
10-20
01/09
For Official Use Only - Law Enforcement Sensitive
10-19
Log Sources
Network Intrusion Responder Program
IDS Logs
Intrusion
Intrusion Detection Systems (IDS) have become prolific and are
Detection Systems
found in many networked environments. You will probably find
that most of the logs generated by these systems are binary rather
than text files. When you find these files, you may have to use a
proprietary program to view or convert the file to text. Some of
these IDS will save logs in the libpcap format. This format enables
you to use packet sniffer tools like Wireshark to open, view, and
export the files as needed.
Snort
Snort is a popular IDS and intrusion reporting tool. Along with
being a popular free application, Snort allows administrators to
flag alerts on both live traffic and traffic captured with a packet
sniffer. After parsing through traffic, Snort will generate a text log
displaying all of the alerts of suspicious traffic it encountered. An
example of such an alert is displayed below:
[**] [1:2001689:5] BLEEDING-EDGE WORM Potential MySQL
bot scanning for SQL server [**]
[Classification: A Network Trojan was detected] [Priority: 1]
08/18-12:21:55.172252 <remote IP>:49812 -> <local IP>:3306
TCP TTL:93 TOS:0x20 ID:256 IpLen:20 DgmLen:40
******S* Seq: 0xBE7728D2 Ack: 0x0 Win: 0x4000 TcpLen: 20
Be aware that Snort requires a complex set of steps to configure it
properly, and this configuration will change with each type of log
or capture you feed it. By default, all of Snort’s log files on a
Linux, Unix, or OS X system will be found in: /var/log/snort
10-20
For Official Use Only - Law Enforcement Sensitive
01/09
Log Analysis
Network Intrusion Responder Program
Module 11
Log Analysis
Overview
When identified, log data must properly formatted and assembled
into reports. Log entries can be used directly as items of evidence,
or assembled into other forms of data, such as statistics, charts,
graphs, and other representations.
Purpose of this
You will be introduced to methods for manipulating log data into
Module
formats that can be easily analyzed for pertinent information.
Objectives
After completing this module, you will be able to:
Generate statistics from log data
Format log data into report-friendly formats
Form visual charts and graphs with log data
In this Module
The following table shows the contents of this module.
Topic
See Page
Lesson 1 - Binary Traffic Analysis
11-3
Lesson 2 - Manual Log Analysis
11-23
Lesson 3 - Automated Log Analysis Tools
11-29
01/09
For Official Use Only - Law Enforcement Sensitive
11-1
Network Intrusion Responder Program
Log Analysis
This page intentionally left blank.
11-2
For Official Use Only - Law Enforcement Sensitive
01/09
Log Analysis
Network Intrusion Responder Program
Lesson 1 - Binary Traffic Analysis
Introduction
Binary logs require different filtering and searching techniques
than those that are used with text logs. Due to the size of binary
logs and their required processing power, it is often more efficient
to filter binary network captures with command line tools.
Purpose of this
You will learn techniques for filtering and searching binary logs of
Lesson
network traffic using command line tools.
Objectives
After completing this lesson, you will be able to:
Describe the types of criteria that can be used to filter binary
logs
Convert binary logs to text files
Demonstrate how to filter and search binary logs with
Wireshark
In this Lesson
The following table shows the contents of this lesson.
Topic
See Page
Introduction to Wireshark
11-4
Converting Binary Logs to Text Format
11-5
Filtering and Searching in Wireshark
11-6
Filtering Data during Capture with Wireshark
11-7
Filtering Displayed Data in Wireshark
11-8
Colorizing Data Using Filters in Wireshark
11-14
Searching in Wireshark
11-16
Generating Statistics with Wireshark
11-17
Exporting Data from Wireshark
11-22
01/09
For Official Use Only - Law Enforcement Sensitive
11-3
Network Intrusion Responder Program
Log Analysis
Introduction to Wireshark
Wireshark
Wireshark is a powerful, open source protocol analyzer that can be
used to view full network traffic capture logs. Wireshark can:
Open a variety of binary log formats
Act as a sniffer
Translate, or decode, known protocols within a binary log to
human readable format
Display highly detailed information on a frame-by-frame basis
Search through a capture log for frames that match specific
criteria
Automatically reconstruct TCP sessions
Procedure:
These steps show how to import a binary log file into Wireshark
Importing Logs
for analysis.
into Wireshark
Note: This procedure and all others in this lesson use Wireshark
0.99 version. Be aware that new versions are released
frequently and can have menu options in different
locations.
Step
Action
1
Open Wireshark.
2
Click File on the menu bar and select Open.
3
In the Open Capture File dialog box, browse to the
location of the capture file.
4
Left click the file name one time to highlight it.
5
Click Open.
Viewing Binary
Wireshark displays binary logs in a window with three panes
Logs in Wireshark
which contain the following information:
Top Pane: Summary of captured frames, including frame
number, date and time, source IP, destination IP, protocol and
basic description
Middle Pane: Decoded protocol header information, organized
inversely to the order of each protocol within the OSI model
Bottom Pane: Full frame contents in hexadecimal on the left
side with any included clear text displayed on the right
11-4
For Official Use Only - Law Enforcement Sensitive
01/09
Log Analysis
Network Intrusion Responder Program
Converting Binary Logs to Text Format
Binary vs. Text
The following lessons of this module will provide instructions for
Format
searching and filtering logs in binary format. However, it is
sometimes more efficient to change binary logs to text format. By
doing so, the logs can be manipulated using text log filtering
techniques to quickly find target data.
You can change binary logs to text format with tcpdump. The
default output of tcpdump is text format. Therefore, it can be used
to read a binary capture and redirect the output to a text file instead
of the screen. Here is an example:
[prompt]# tcpdump -r log.cap > log.txt
In the command line above, tcpdump read the file log.cap, and
placed a text interpretation of the contents into the text file log.txt.
Note that by default tcpdump does not print the full contents of
each packet, just some summary data.
This is not always necessary when performing quick searches and
filters on network protocol data. It will sometimes be useful to
modify the default output format of tcpdump. Options for doing
this include:
Command Option
Description
-A
Print the content of each packet in hex,
except for the Data Link Layer
-n
Do not convert numbers to names, such
as port numbers to service names, or IP
addresses to hostnames
-tttt
Print the date as the first field of the
packet before the time
-v, -vv, -vvv
Print more verbose output, progressively
increasing with more v’s
01/09
For Official Use Only - Law Enforcement Sensitive
11-5
Network Intrusion Responder Program
Log Analysis
Filtering and Searching with Wireshark
Filtering Binary
Wireshark offers several filtering and searching options:
Logs with
Wireshark
Capture filters: Interface used to filter data while it is being
captured from a network; uses the tcpdump syntax.
Display filters: Interface used to filter traffic that is currently
being displayed by Wireshark.
Color filters: Interface used to apply colors to certain packets
based upon a filter expression.
Find menu: Standard find menu that allows packet to be
searched by hex value or string. Display filters can also be
entered here.
11-6
For Official Use Only - Law Enforcement Sensitive
01/09
Log Analysis
Network Intrusion Responder Program
Filtering Data during Capture with Wireshark
Procedure:
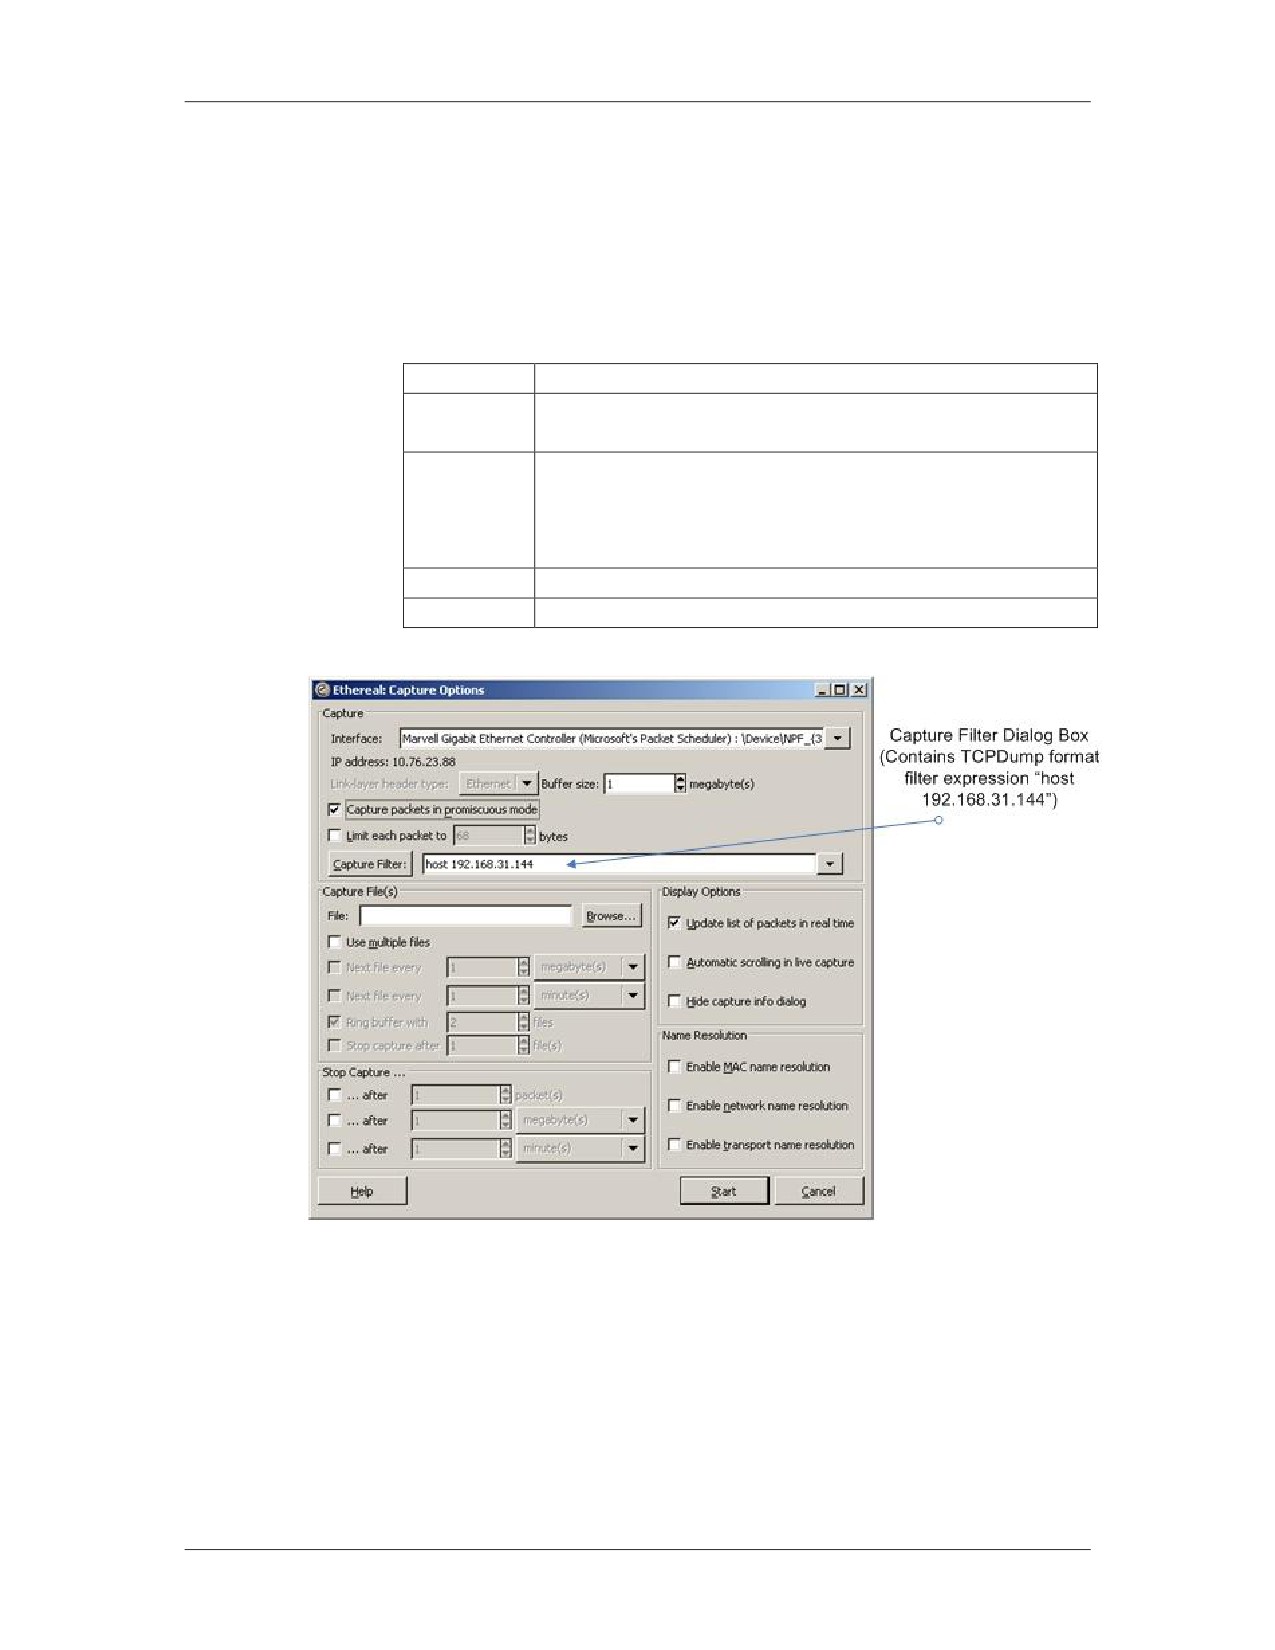
Wireshark can filter data while it is being captured. This filter
Setting Up a
menu uses standard tcpdump syntax. Data filtered out through this
Capture Filter
method never gets stored.
Step
Action
1
Select Capture from the menu bar and select
“Options” from the drop-down menu.
2
A window will appear titled “Wireshark: Capture
Options.” Enter the desired expression into the dialog
box next to the “Capture Filter” button. Make sure
that the expression is in tcpdump format.
3
Modify other capture options as necessary.
4
Click the Start button to begin capturing.
01/09
For Official Use Only - Law Enforcement Sensitive
11-7
Network Intrusion Responder Program
Log Analysis
Filtering Displayed Data in Wireshark
Procedure:
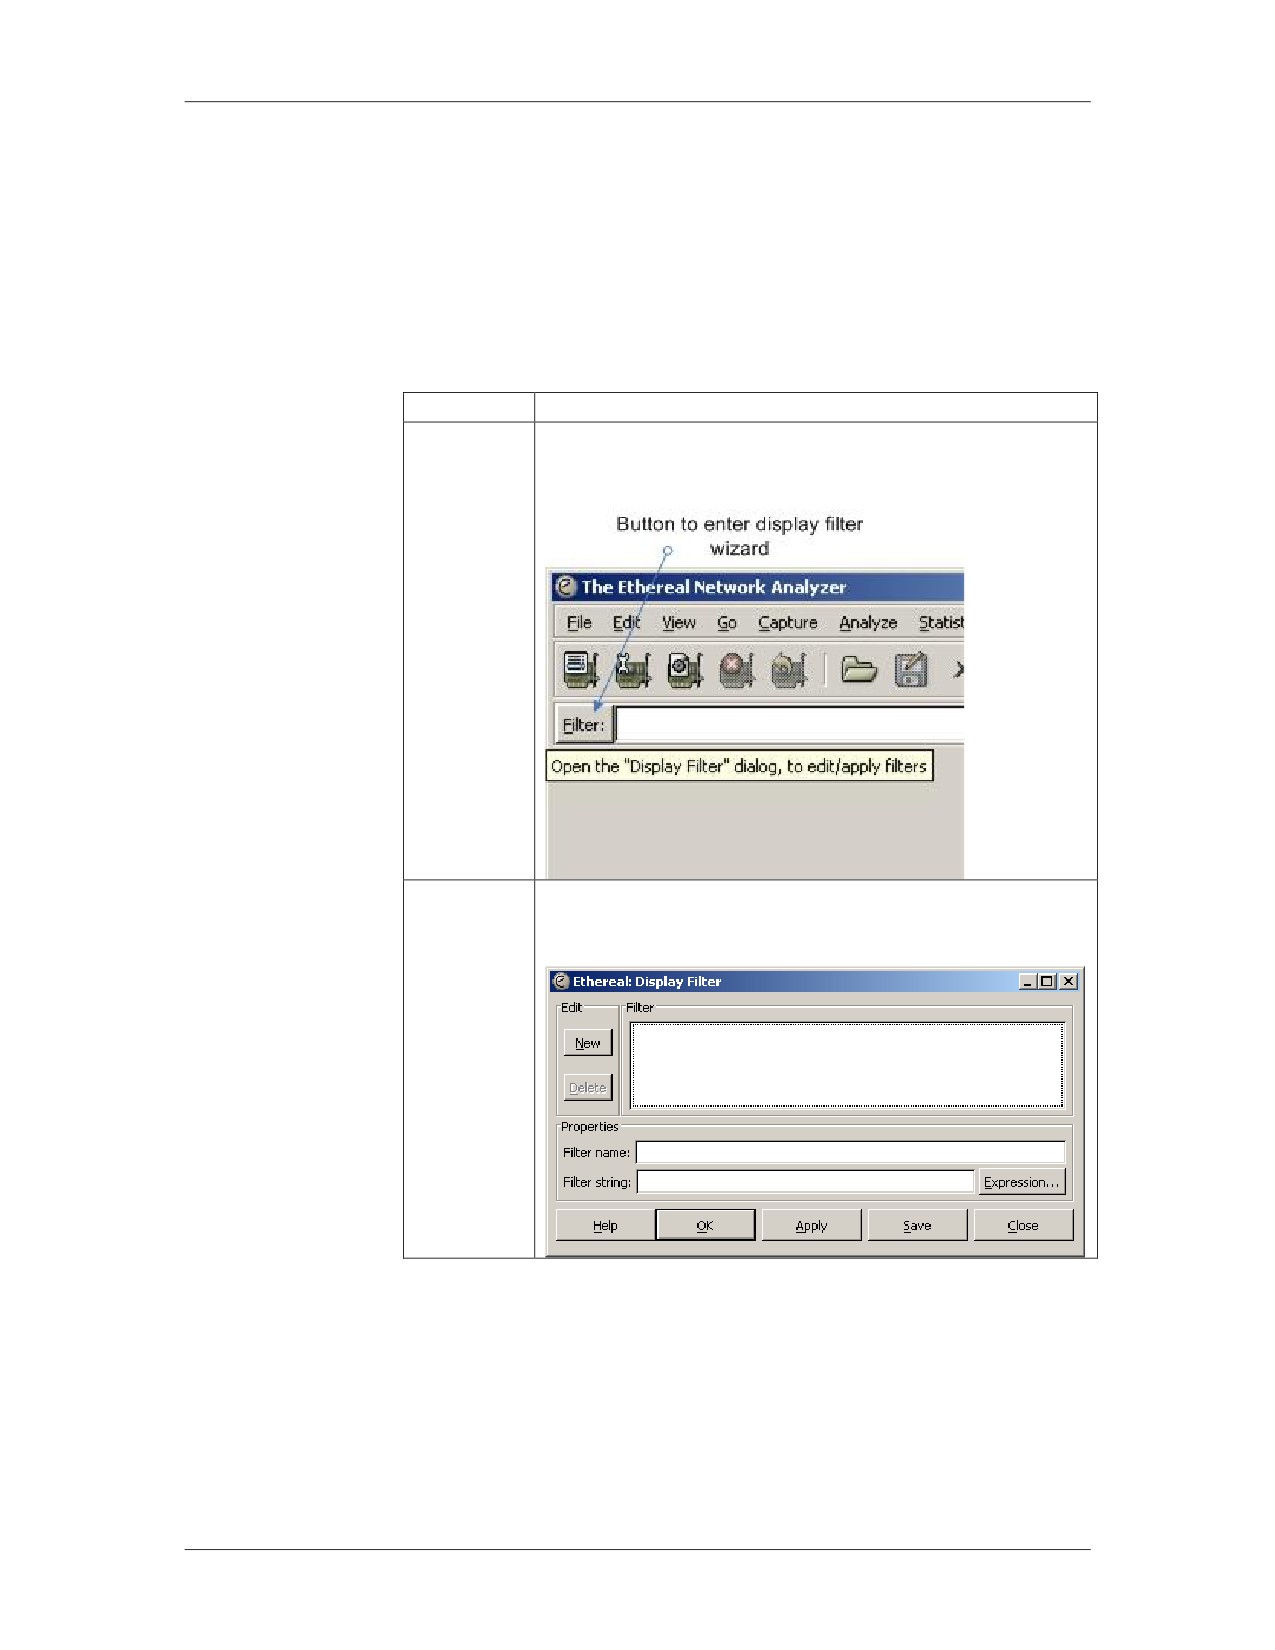
Follow these steps to create and apply a display filter in
Creating a Display
Wireshark. This filter is used for data that is being displayed in
Filter in
Wireshark. Only the displayed data is changed, not the contents of
Wireshark
the log.
Step
Action
1
Click on the Filter button, towards the upper left
corner of the Wireshark window.
2
A new window will appear titled “Wireshark:
Display Filter.” Click the Expression button.
11-8
For Official Use Only - Law Enforcement Sensitive
01/09
Log Analysis
Network Intrusion Responder Program
Filtering Displayed Data in Wireshark, continued
Procedure: Creating a Display Filter in Wireshark, continued
Step
Action
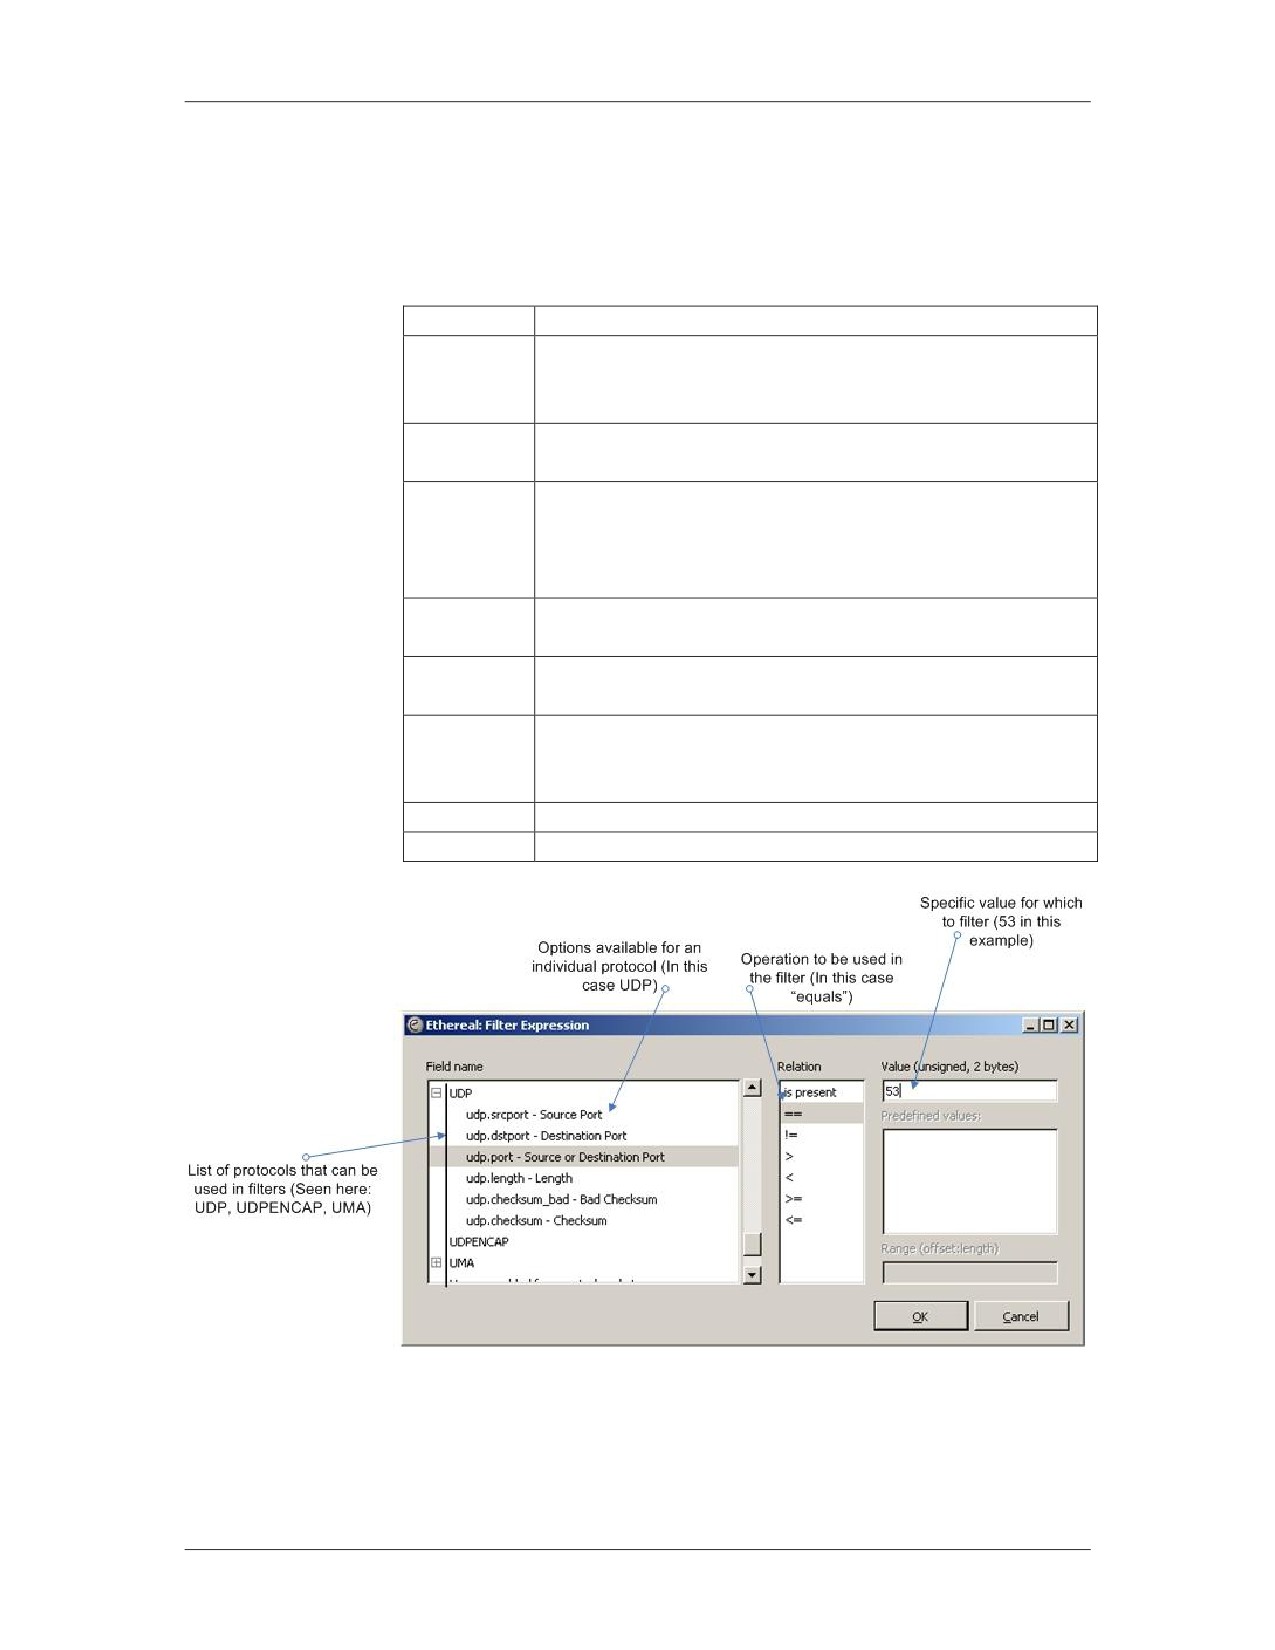
3
A window will appear titled “Wireshark: Filter
Expression.” Scroll down in the “Field Name” pane
until you see the protocol that is targeted for filtering.
4
Left click the arrow beside the protocol name one
time to expand the menu of options.
5
Scroll down further and locate the protocol option on
which a filter is desired and left click on it. The
middle and right panes may change to reflect options
available for that protocol option.
6
In the Relation pane of this window, select the
desired option by left clicking on it one time.
7
If needed, enter a value into the “Value” dialog box.
Click OK.
8
You will be returned to the Display Filter window
shown in Step 2. Enter a name for the new filter in
the Filter Name dialog box.
9
Click the New button.
10
Click OK to complete the procedure.
01/09
For Official Use Only - Law Enforcement Sensitive
11-9
Network Intrusion Responder Program
Log Analysis
Filtering Displayed Data in Wireshark, continued
Creating a Display
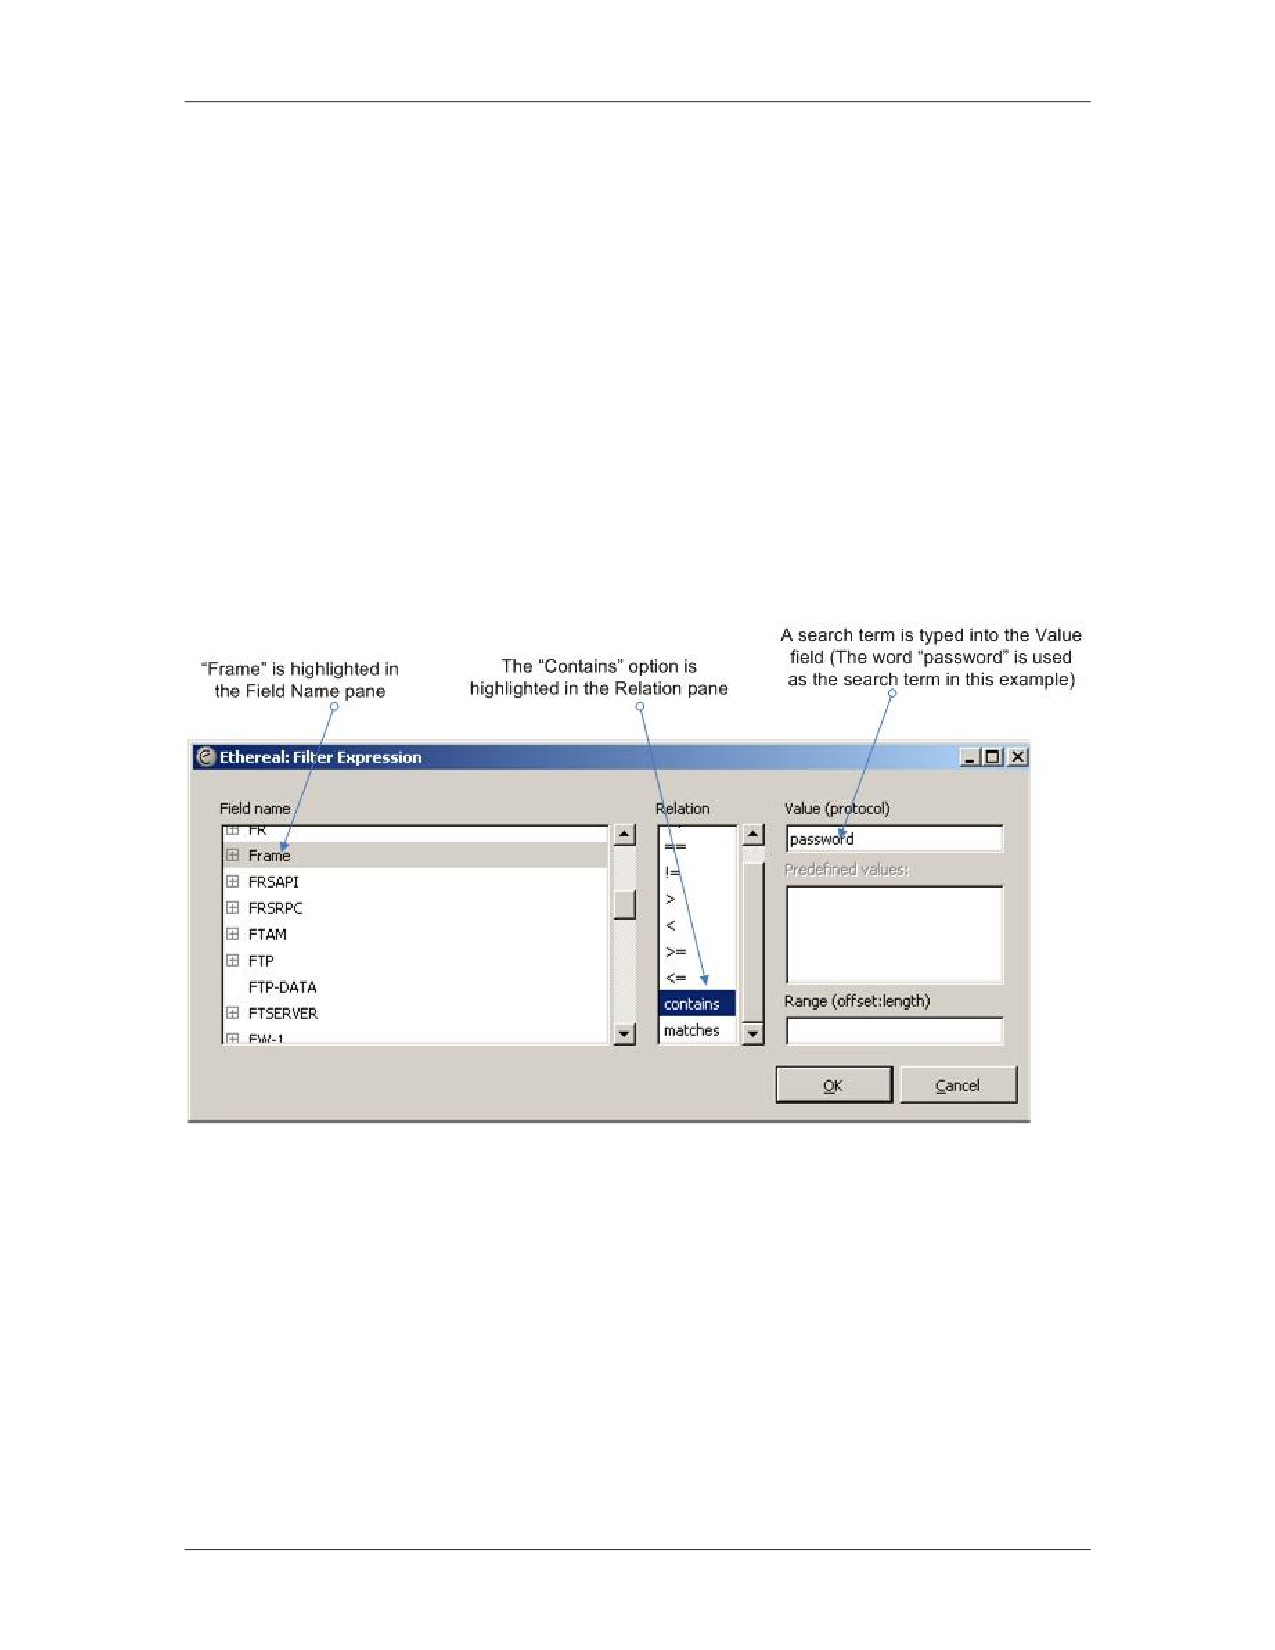
A display filter can be created for a keyword. Unlike a keyword
Filter for a
search shown later in this lesson, a keyword filter will change the
Keyword
display so that it only shows packets that contain the search term.
This is done with the “frame contains” display filter, which can be
used to filter for the presence of a keyword anywhere in a packet.
The “frame contains” filter can be found through the normal
display filter wizard. An example of the Filter Expression window
from the wizard is shown below. It displays the creation of the
“frame contains” filter by choosing “Frame” in the left pane and
“contains” in the center pane. The target keyword is placed in the
“Value” field.
Creating a Display
The “frame contains” expression syntax can also be used to filter
Filter for a Hex
for hexadecimal values. For instance, the following expression
Value
could be used to display packets containing the hex value
0x6d73646f.
frame contains 6d:73:64:6f
The hex value is entered in place of a keyword, with colons used
to separate the value into pairs.
11-10
For Official Use Only - Law Enforcement Sensitive
01/09
Log Analysis
Network Intrusion Responder Program
Filtering Displayed Data in Wireshark, continued
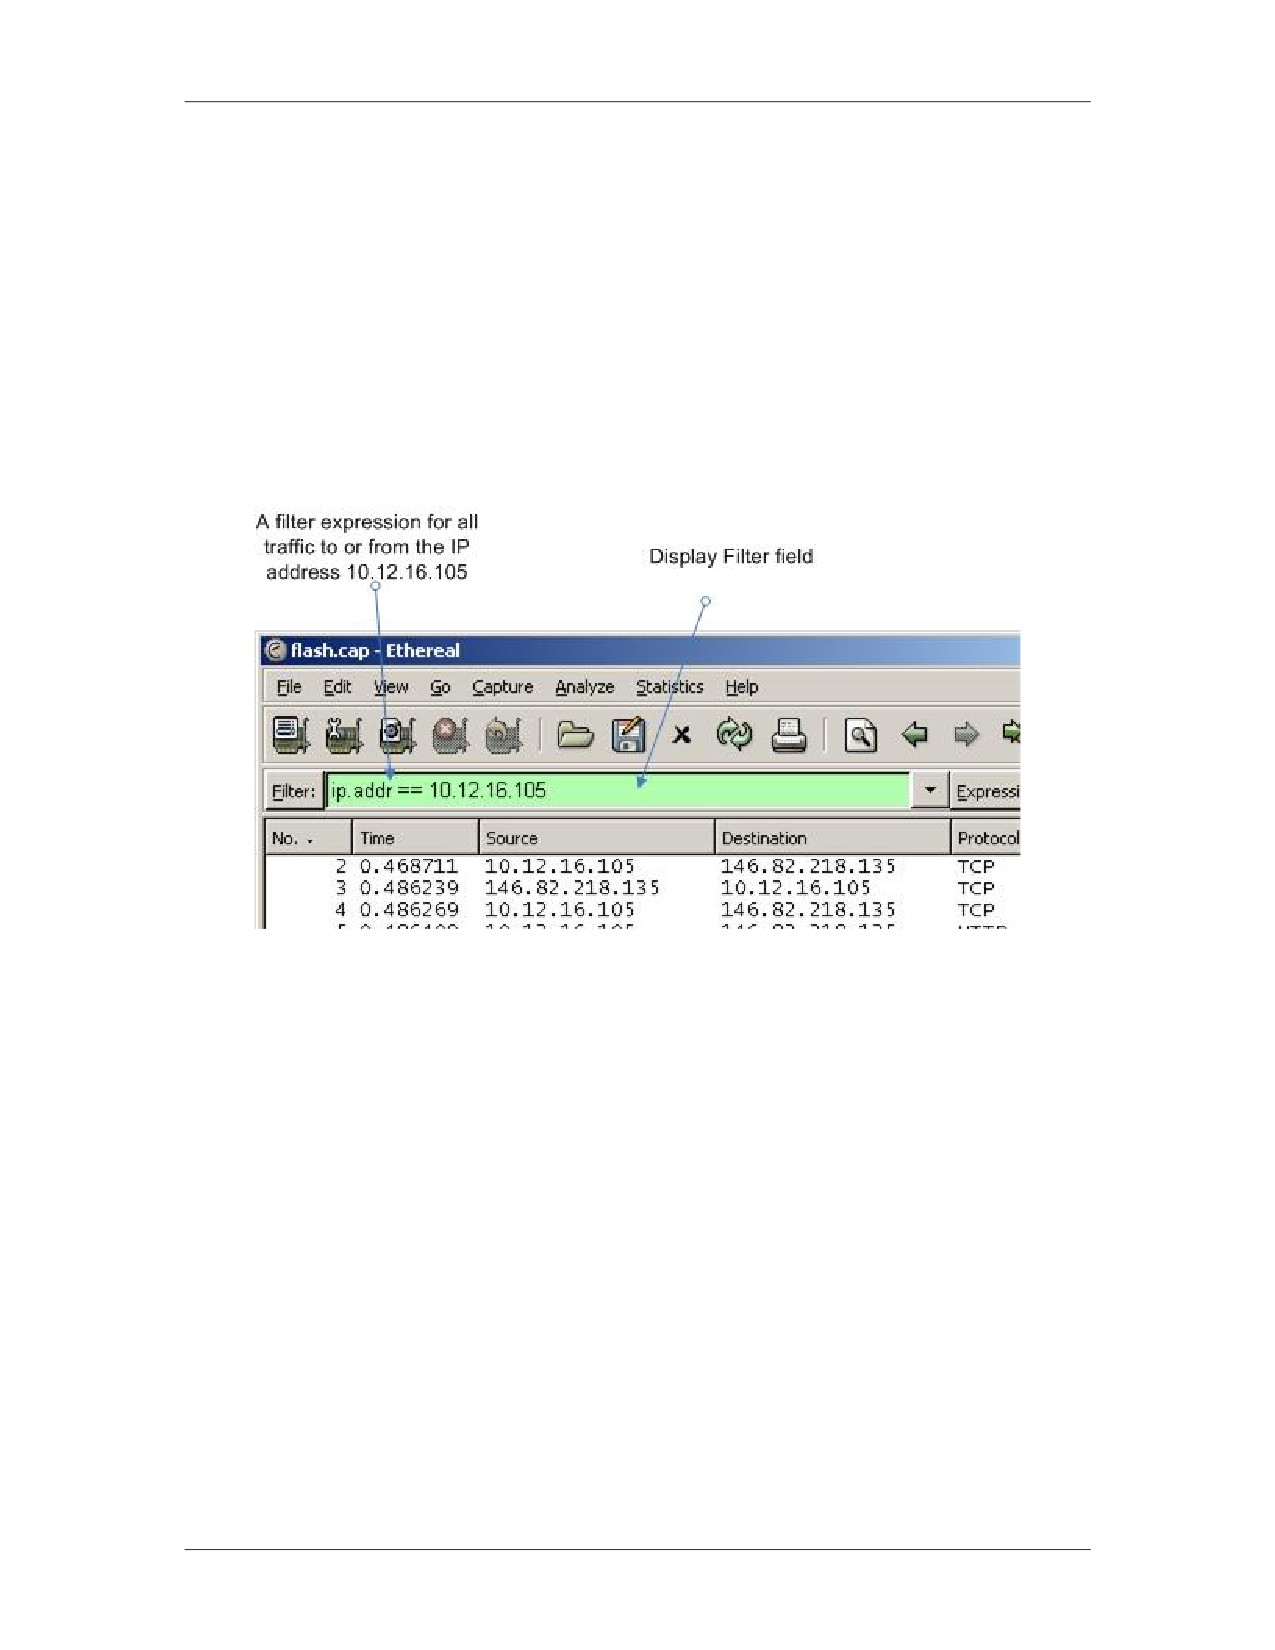
Directly Entering
When a filter expression is created using the Display Filter wizard,
Display Filter
the text for the filter is entered into the Display Filter field in the
Expressions
main window of Wireshark. Filter expressions can also be entered
as text into that field instead of using the wizard. The screen below
shows the Display Filter field with a single filter expression
displayed. When entering a display filter, if the filter has a valid
syntax, the backg0round color of the display filter field will be
green, otherwise it will be red.
01/09
For Official Use Only - Law Enforcement Sensitive
11-11
Network Intrusion Responder Program
Log Analysis
Filtering Displayed Data in Wireshark, continued
Syntax of Display Wireshark display filters use a different syntax than tcpdump. The
Filters
available protocols and filtering options are extensive and cannot
all be listed in this text. Here are some common examples.
Operation
Syntax
Example
ip.addr == 192.168.0.1
Source or Destination
ip.addr == <address>
ip.addr ==
IP Address
20ab:5183:4383:::2ff:fee2:759
6
Source IP
ip.src == <address>
ip.src == 192.168.0.1
ip.src ==
20ab:5183:4383:::2ff:fee2:759
6
ip.dst == 192.168.0.1
Destination IP
ip.dst == <address>
ip.dst ==
20ab:5183:4383:::2ff:fee2:759
6
Source or Destination
tcp.port == <number>
tcp.port == 80
udp.port == 53
Port Number
udp.port == <number>
Source Port
tcp.srcport == <number>
tcp.srcport == 80
udp.srcport == 53
udp.srcport == <number>
tcp.dstport == 80
Destination Port
tcp.dstport == <number>
udp.dstport == 53
udp.dstport == <number>
Protocol
<protocol>
icmp
11-12
For Official Use Only - Law Enforcement Sensitive
01/09
Log Analysis
Network Intrusion Responder Program
Filtering Displayed Data in Wireshark, continued
Altering and
Expressions can be combined in the Display Filter Field and
Combining
logical operations can be performed on them. Allowed grouping
Expressions
and logic operators include the following.
Operation
Syntax
Example
ip.addr == 192.168.0.1
Combine Two
<Filter 1> and <Filter 2>
and tcp
Expressions
Negate an Expression
! <Filter 1>
! ip.addr == 10.0.0.4
Alternate Expressions
<Filter 1> or <Filter 2>
ip.addr == 10.0.0.4 or
ip.addr ==
10.0.0.5
Compare to Value
<Filter 1> < <Value>
tcp.port < 1024
with “Lesser Than”
Compare to Value
<Filter 1> <= <Value>
tcp.port <= 1024
with “Lesser Than or
Equal To”
Compare to Value
<Filter 1> > <Value>
tcp.port > 1024
with “Greater Than”
Compare to Value
<Filter 1> >= <Value>
tcp.port >= 1024
with “Greater Than
or Equal To”
Compare to Value
<Filter 1> = <Value>
tcp.port == 1024
with “Equal To”
Group Expressions
(<Filter 1> <Operator> <Filter 2>)
tcp.port 80 or (icmp
or arp)
with Parenthesis
01/09
For Official Use Only - Law Enforcement Sensitive
11-13
Network Intrusion Responder Program
Log Analysis
Colorizing Data Using Filters in Wireshark
Procedure:
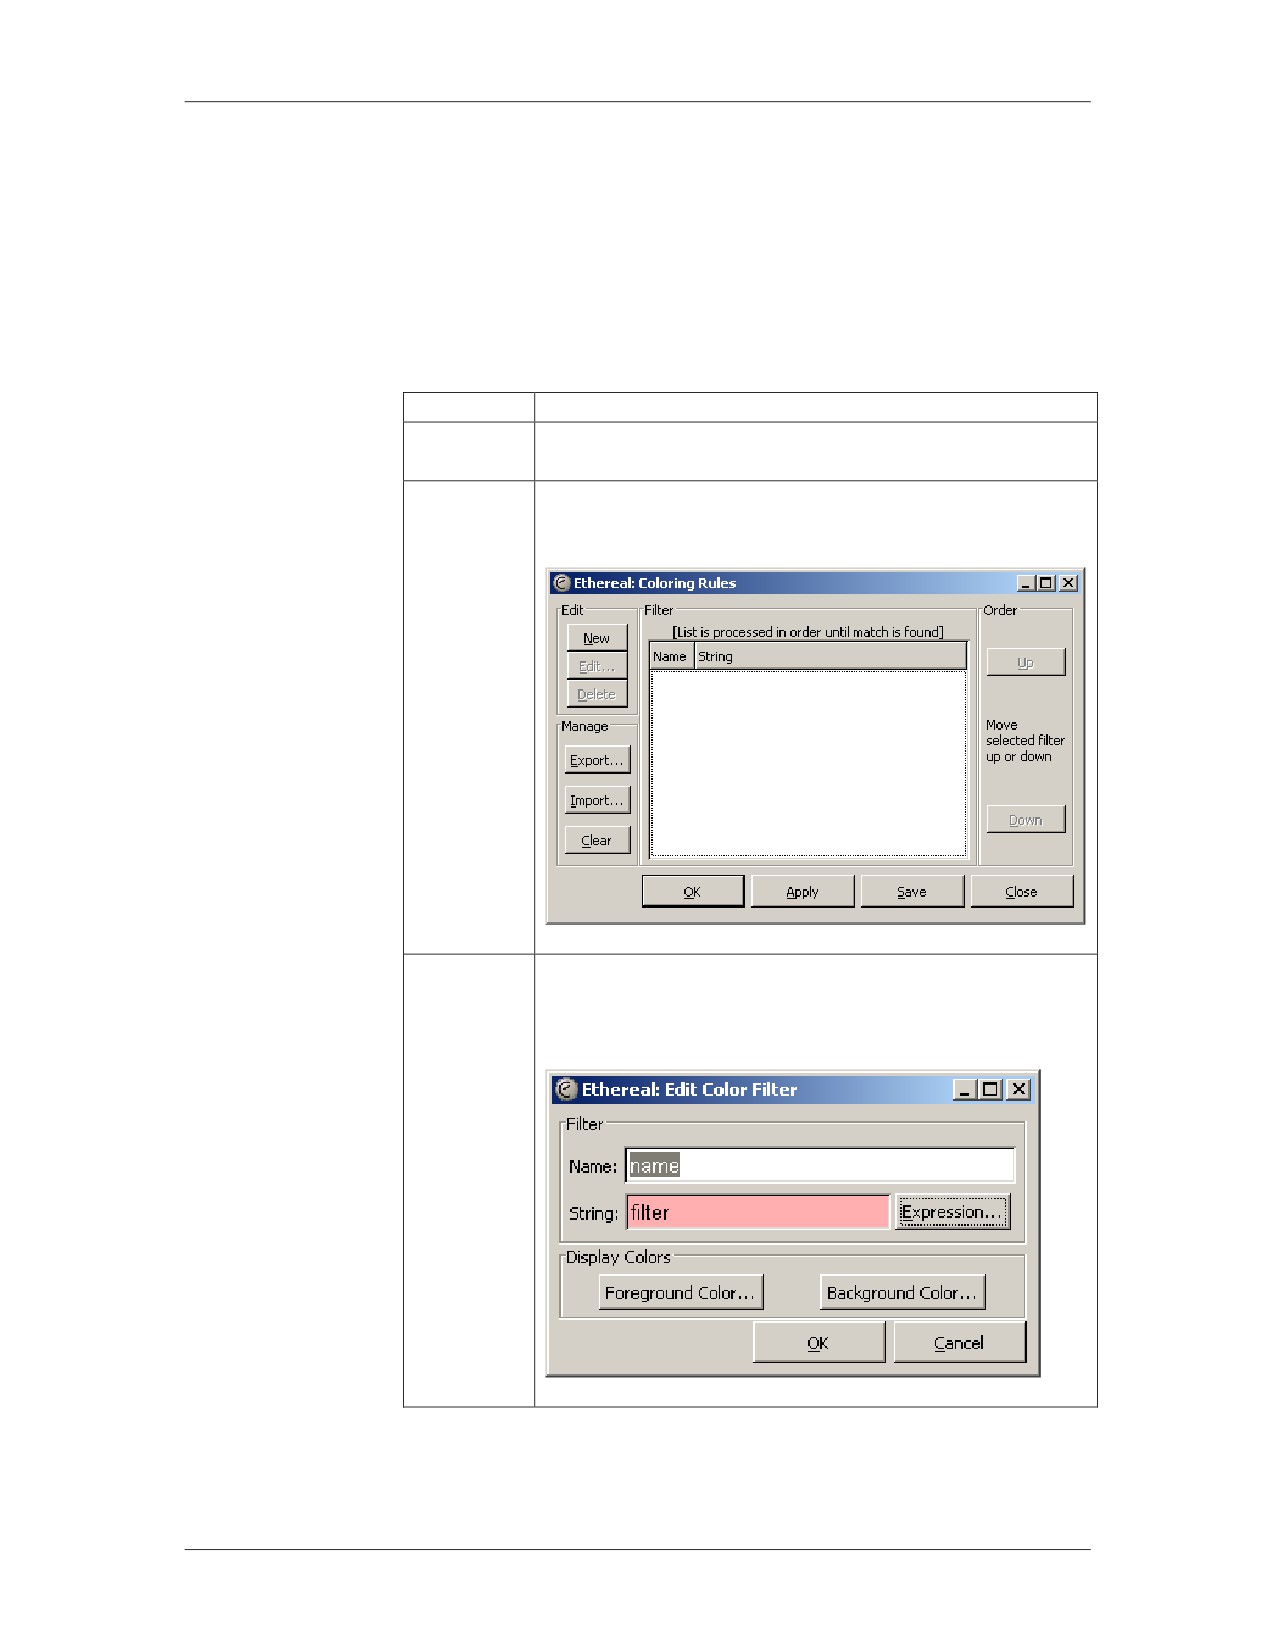
Wireshark can create a filter that does not remove data from the
Creating a Color
log display, but instead colorizes frames based on the selected
Filter with
criteria.
Wireshark
Step
Action
1
Select View on the menu bar, and then select
Coloring Rules.
2
When a new window appears titled Coloring Rules,
click New.
3
When a new window displays titled Edit Color Filter,
click on Expression and the Filtering Expression
window displays.
11-14
For Official Use Only - Law Enforcement Sensitive
01/09
Log Analysis
Network Intrusion Responder Program
Colorizing Data Using Filters in Wireshark, continued
Procedure: Creating a Color Filter with Wireshark, continued
Step
Action
4
This Filtering Expression window is the same one
used when creating a display filter (see the previous
procedure). Create the necessary filter here in the
same way and then click OK.
5
You will be returned to the Edit Color Filter window.
Enter a name for the new filter in the Name dialog
box.
6
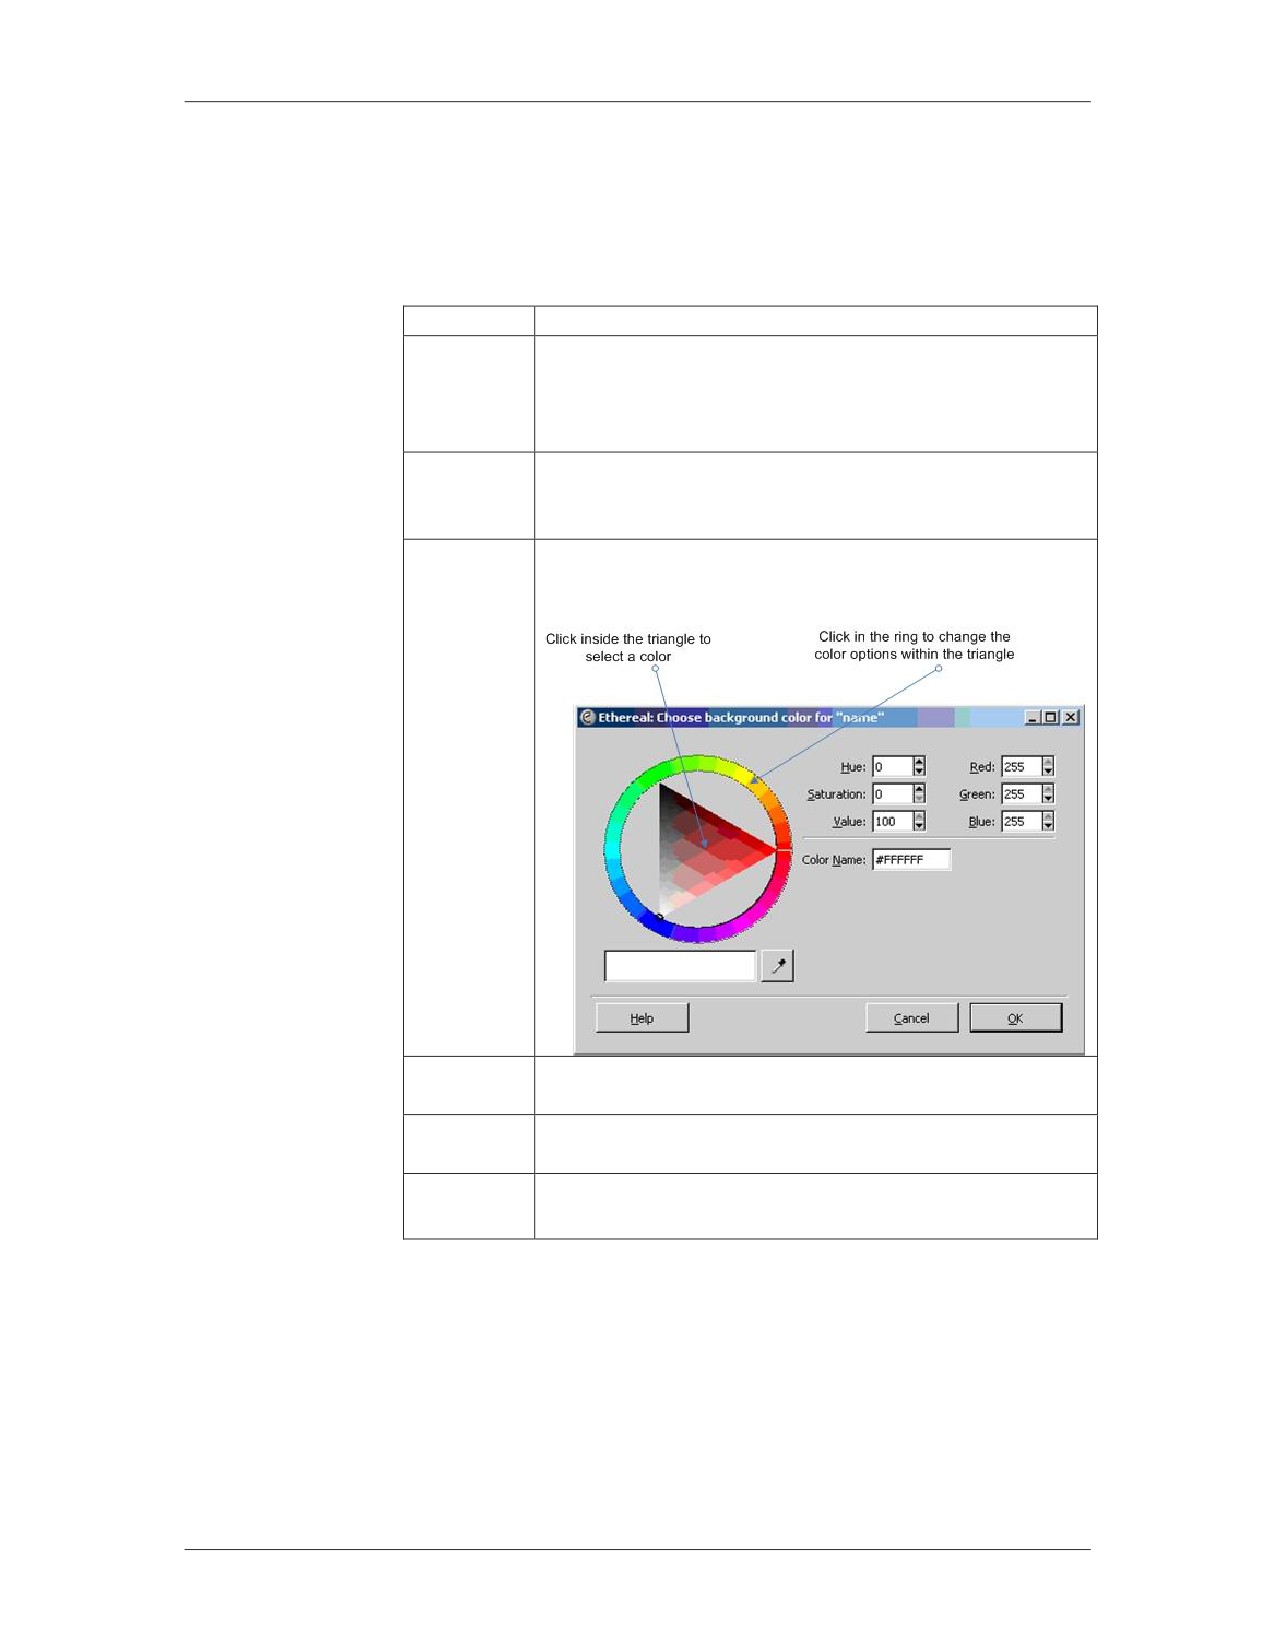
Click Background Color. A new window displays
titled “Wireshark: Choose backg0round color.”
7
Choose a color by left clicking on the color palette
and click OK.
8
You will be returned to the Edit Color Filter window
shown in Step 3. Click OK.
9
You will be returned to the Coloring Rules window
shown in Step 2. Click OK.
01/09
For Official Use Only - Law Enforcement Sensitive
11-15
Network Intrusion Responder Program
Log Analysis
Searching in Wireshark
Procedure:
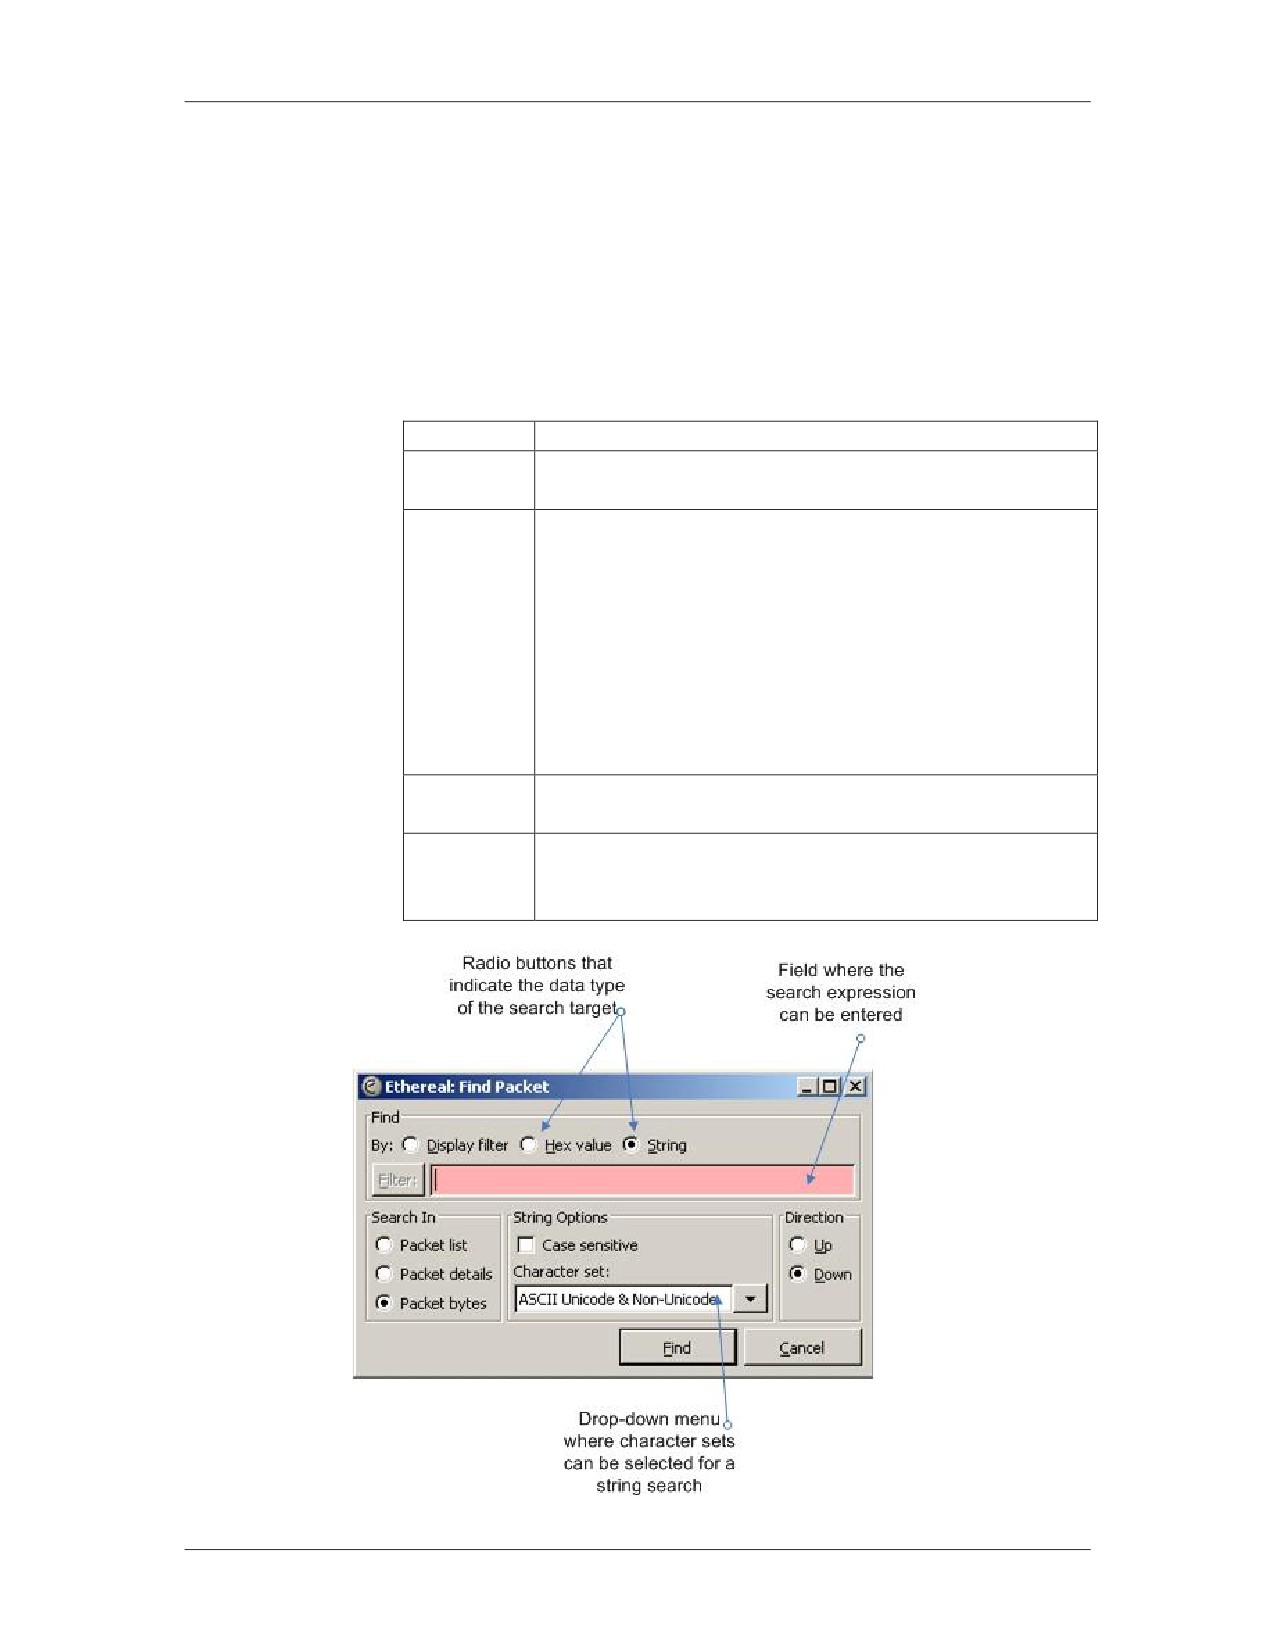
A standard search for text or hex data can be conducted within
Searching in
Wireshark. This function will not remove frames from the display
Wireshark
in Wireshark like display filters do. Instead, the search will scan
through the frames and highlight the first frame that matches the
search criteria.
Step
Action
1
Select Edit in the menu bar and then select Find
Packet from the drop-down menu.
2
A new window will appear titled Wireshark: Find
Packet. Select the data type for the search from the
radio buttons along the top of the window. Options
include:
Display filter: Enter a standard display filter
Hex value: Enter a hex value as the search target
String value: Enter a string value as the search
target
3
Enter a target value in the field next to the Filter
button.
4
Click the Find button and the display will change
back to the main Wireshark window. The first
matching frame will be highlighted.
11-16
For Official Use Only - Law Enforcement Sensitive
01/09
Log Analysis
Network Intrusion Responder Program
Generating Statistics with Wireshark
Wireshark
Wireshark has a “Statistics” menu in the menu bar for generating
Statistics Menu
various statistics about log data. Some useful statistics options are
described in the following sections.
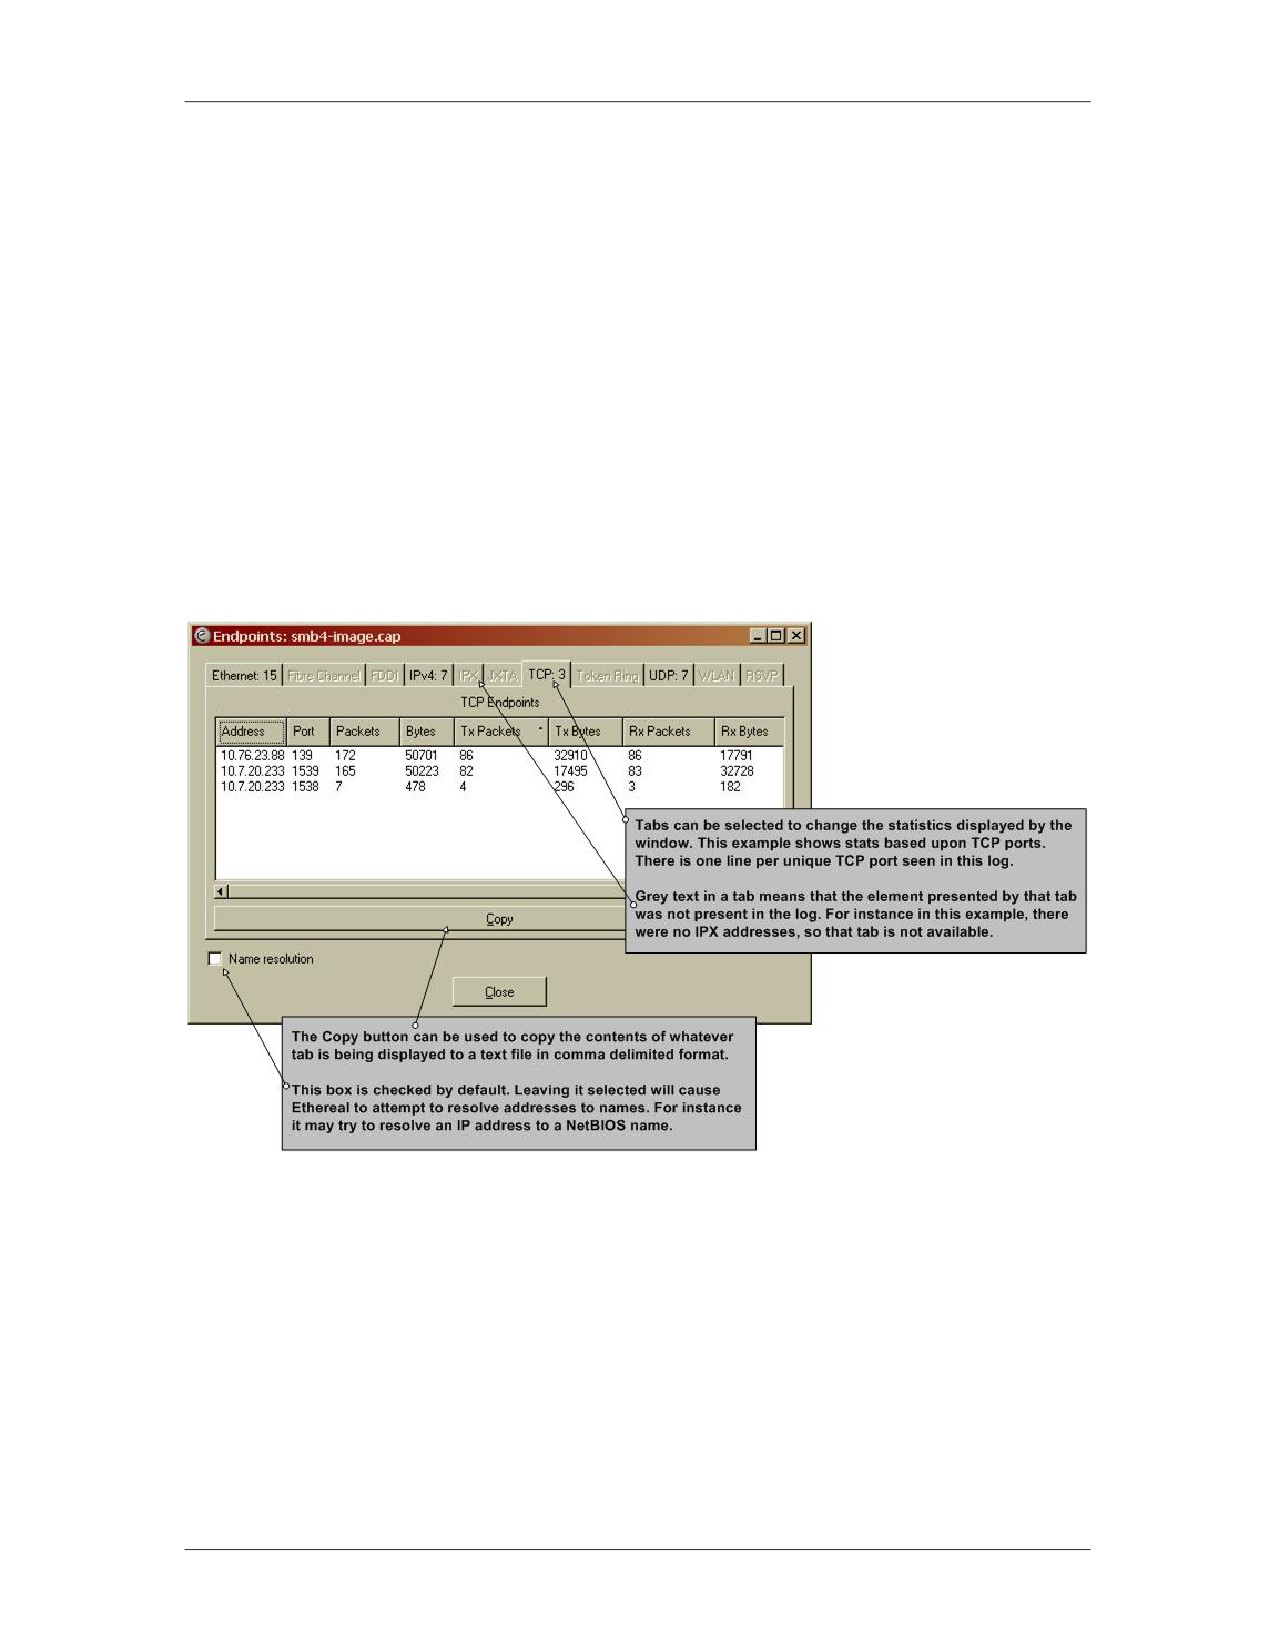
Endpoints List
The “Endpoints” option in the Statistics menu provides lists of
statistics that revolve around addresses and TCP/UDP ports. By
selecting the Endpoints option, a separate window will appear to
display the statistics. This window is useful to see what IP
addresses and ports are seen in a given binary capture. An example
is shown below with an explanation of some of the features.
01/09
For Official Use Only - Law Enforcement Sensitive
11-17
Network Intrusion Responder Program
Log Analysis
Generating Statistics with Wireshark, continued
Protocol
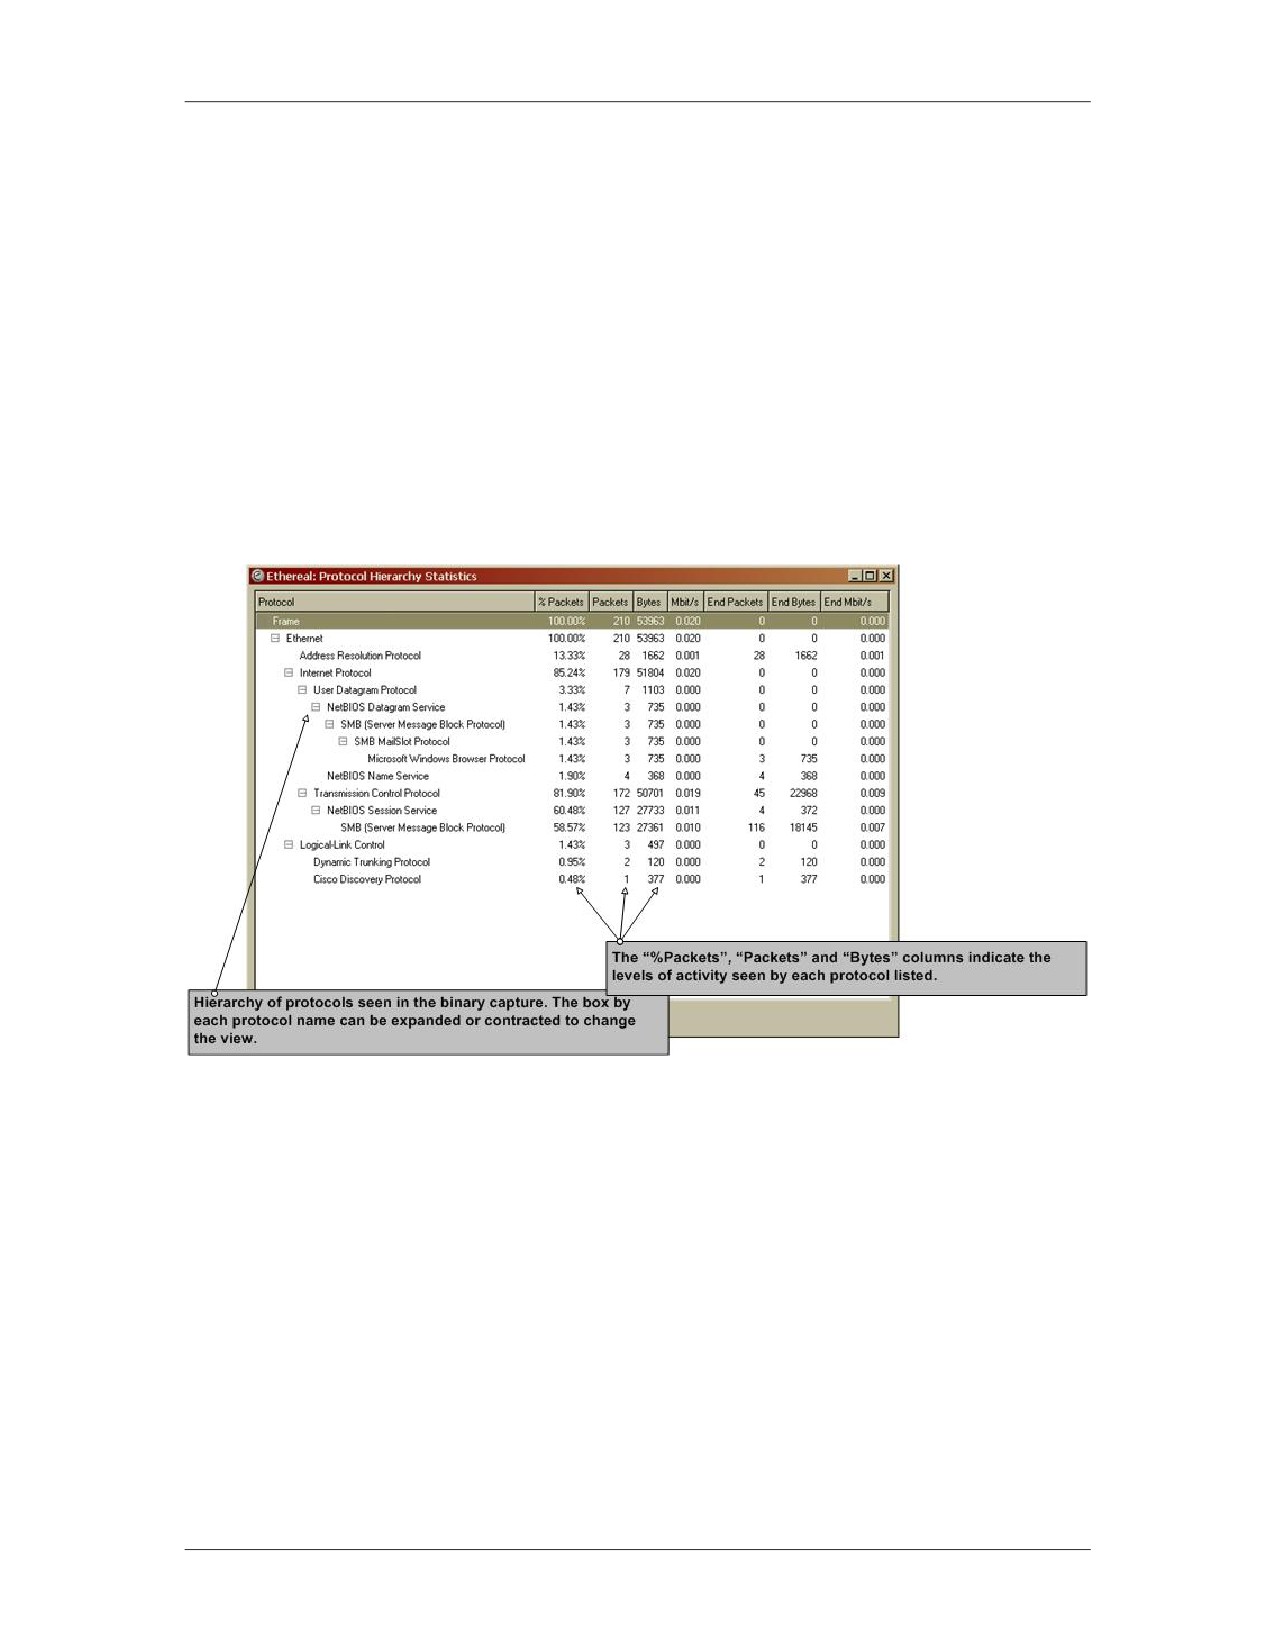
The “Protocol Hierarchy Statistics” option in the Statistics menu
Hierarchy
provides a list of protocols that were seen in a given capture and
Statistics
the volume of protocol activity by each one.
The applications being used on the network can be quickly derived
from this information and provide a good snapshot of activity.
However, remember that Wireshark does not recognize all
protocols. It may miss a protocol that is used over a non-standard
port. An example of this window is shown below.
11-18
For Official Use Only - Law Enforcement Sensitive
01/09
Log Analysis
Network Intrusion Responder Program
Generating Statistics with Wireshark, continued
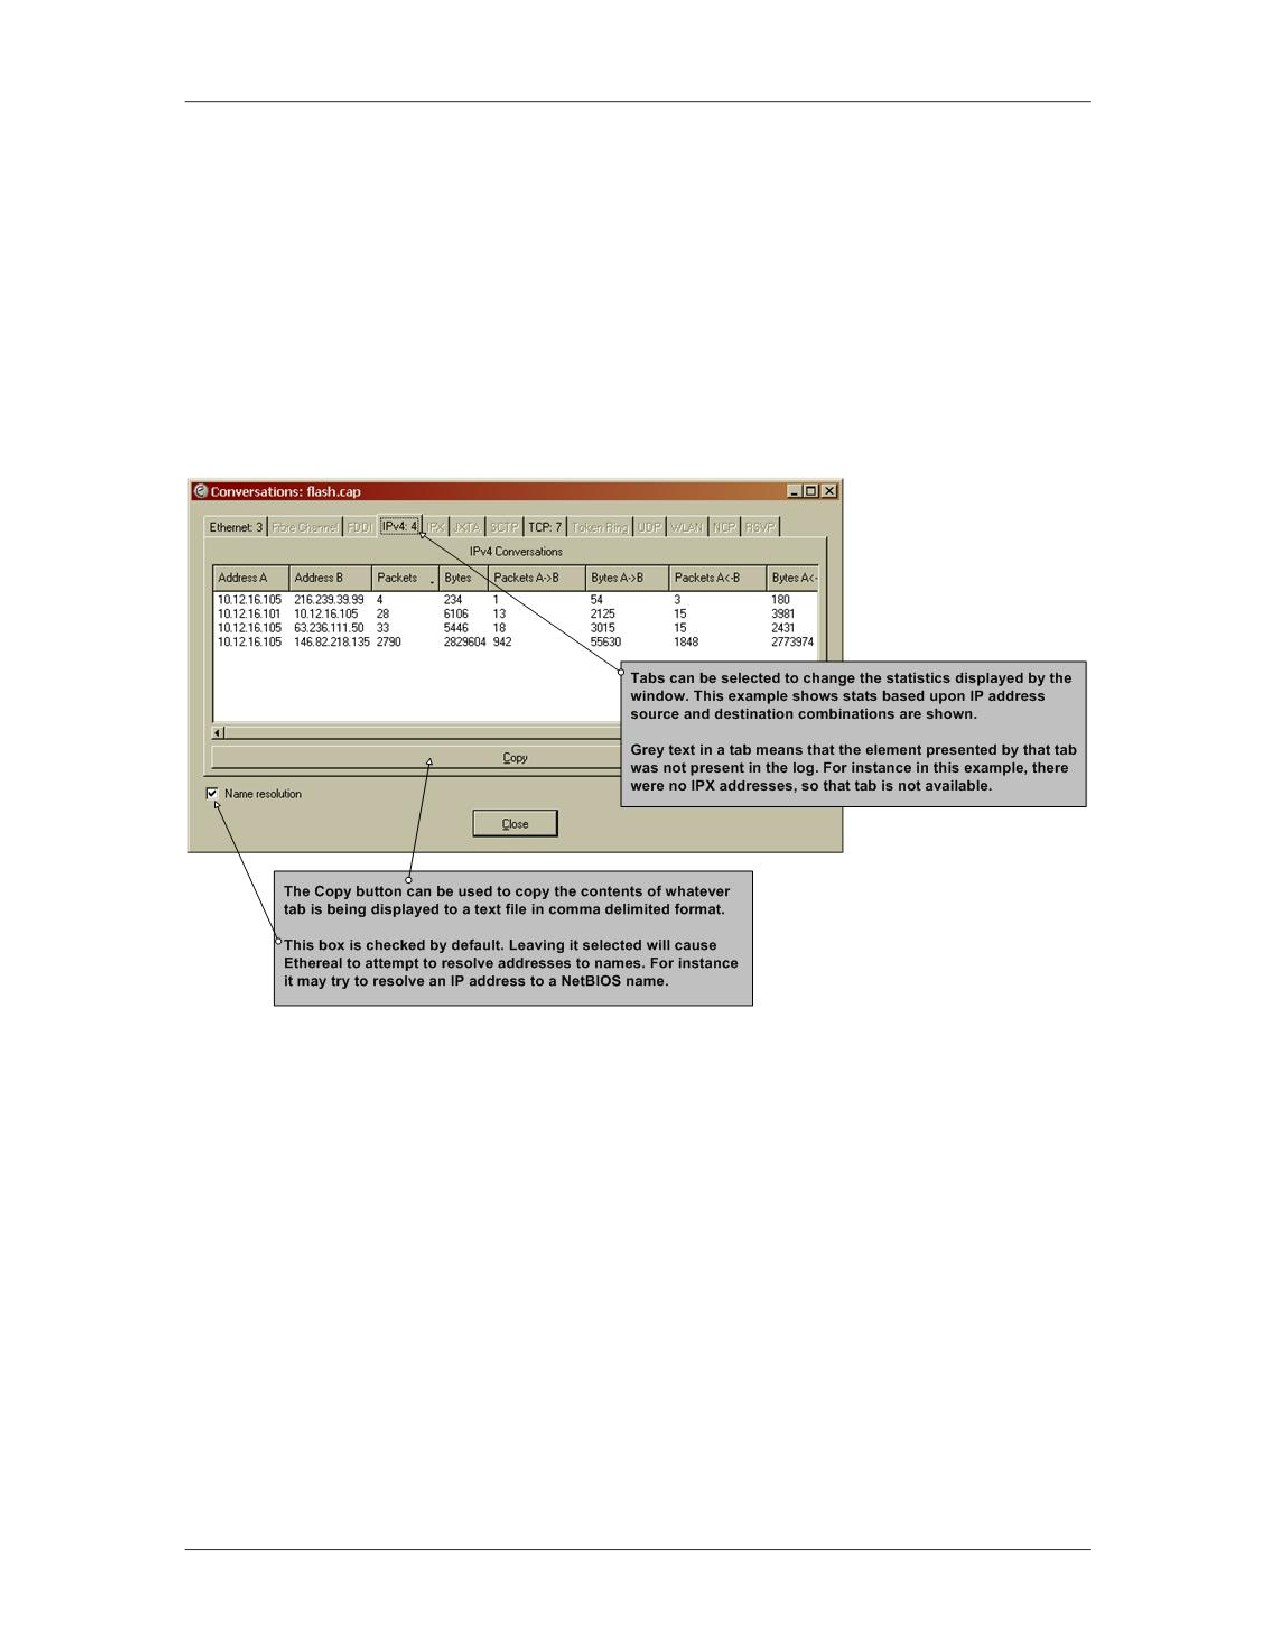
Conversations List The “Conversations” option in the Statistics menu offers lists of
source/destination address combinations. Wireshark presents
source and destination address combinations that were seen
communicating in the capture and the number of packets seen
between each pair. Packet volume is even shown for each direction
of communication between the pair.
01/09
For Official Use Only - Law Enforcement Sensitive
11-19
Network Intrusion Responder Program
Log Analysis
Generating Statistics with Wireshark, continued
HTTP Requests
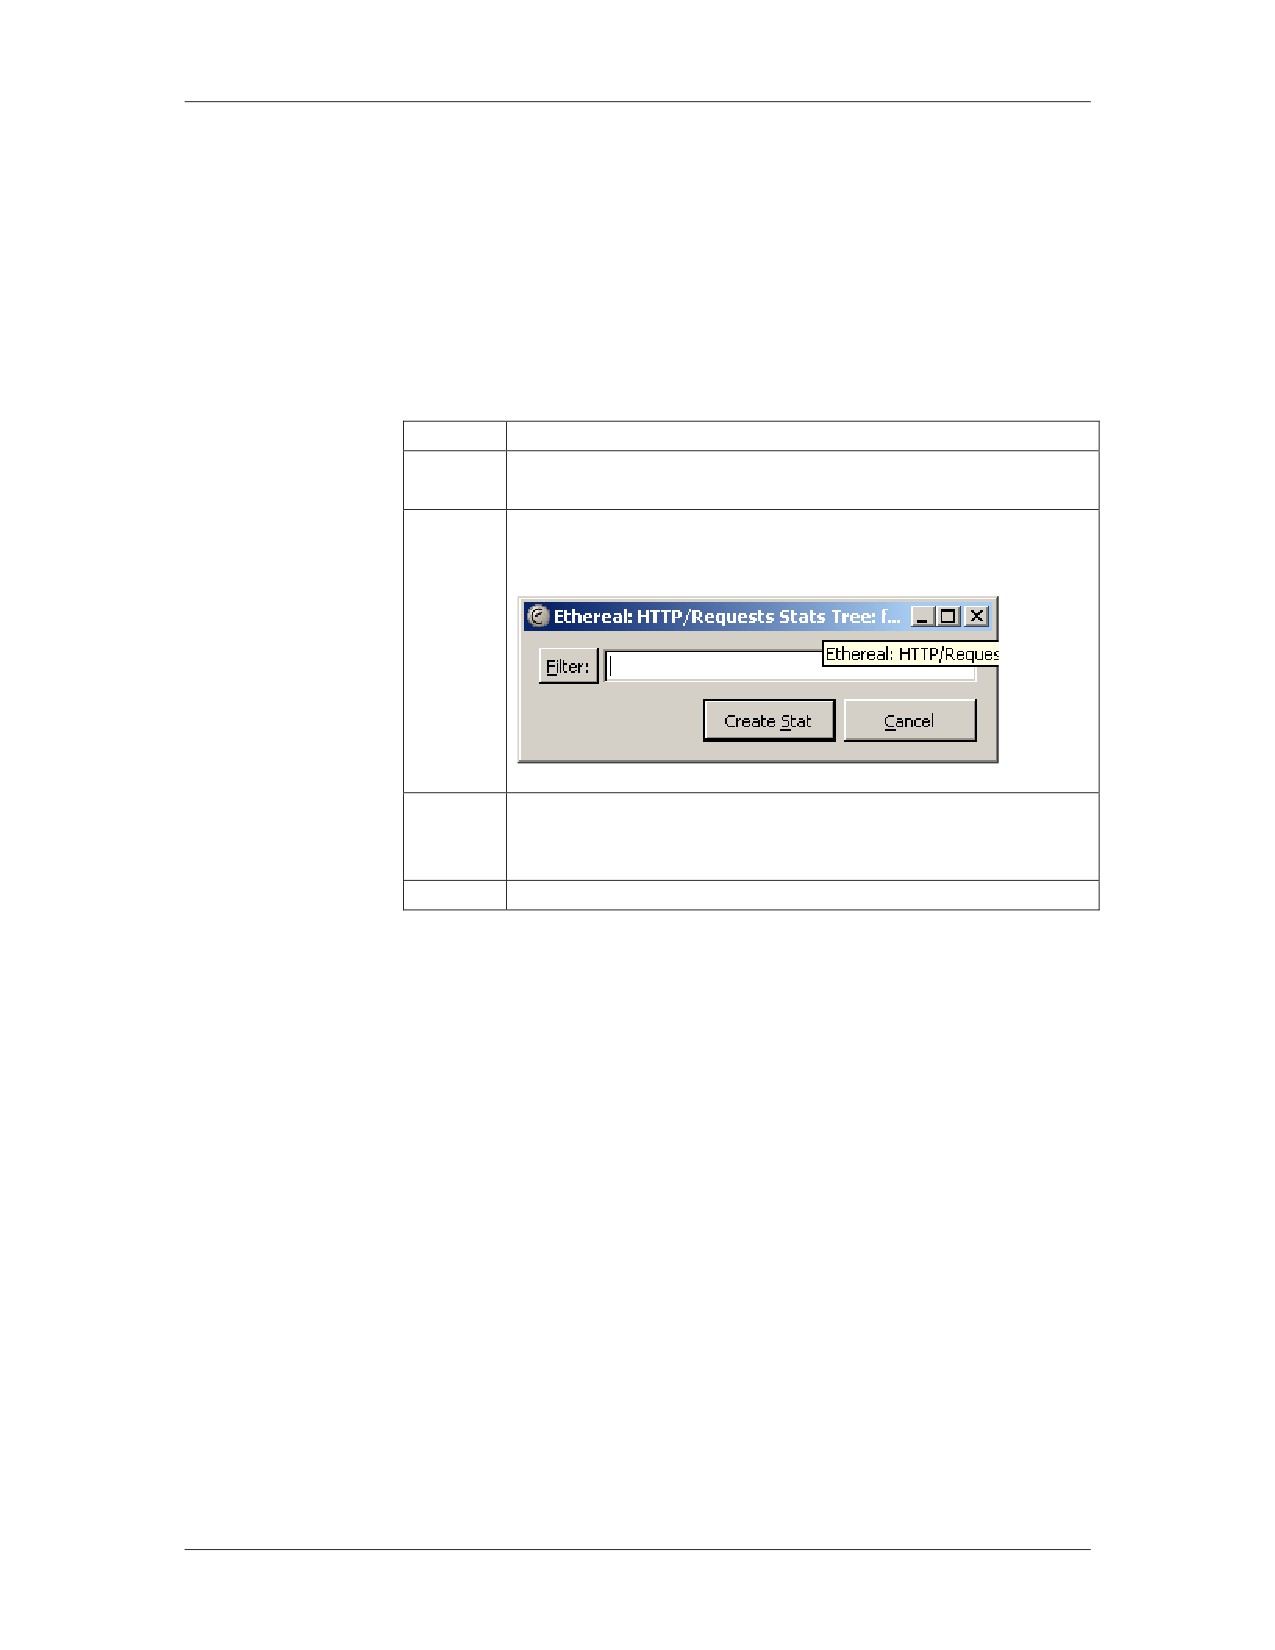
Wireshark can create a custom list of HTTP get requests based
Stats Tree
upon a specified display filter. For example, if you supply a
display filter for a specific IP address, Wireshark shows all get
requests for that IP. Creating this statistic requires several steps.
Here is the procedure:
Step
Action
1
Select “HTTP” from the “Statistics” menu in the menu
bar.
2
When a menu displays, select “Requests…” A new
window will appear:
3
Enter a display filter in the only field. The Filter button
can be selected to access Wireshark’s display filter
wizard if the desired filter is unknown.
4
Click Create Stat. The statistics window will display.
11-20
For Official Use Only - Law Enforcement Sensitive
01/09
Log Analysis
Network Intrusion Responder Program
Generating Statistics with Wireshark, continued
HTTP Requests
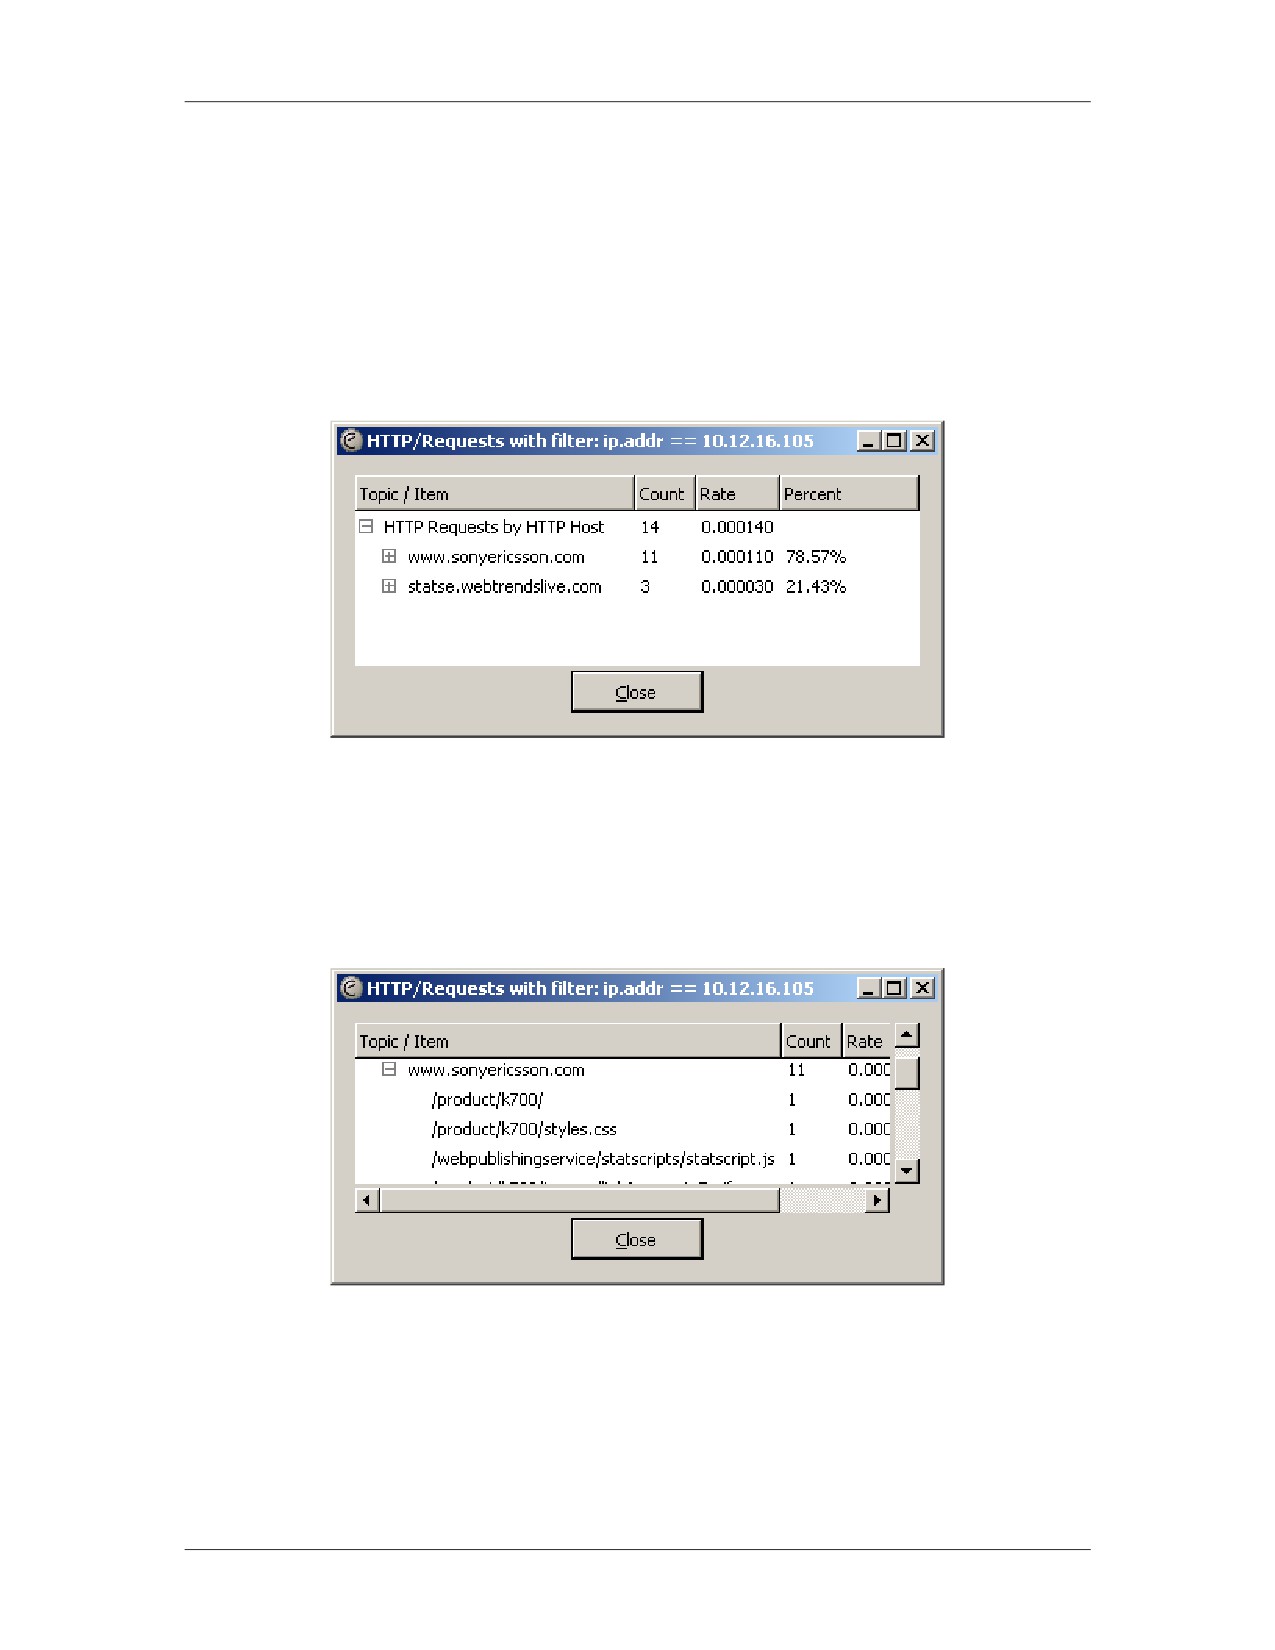
Here is an example of an HTTP Requests Statistics list. The list
Statistics Example
includes domain names which were found in the traffic. You can
also see the percentage of traffic going to each domain name. The
example is the result of filtering for all traffic from a single IP
address.
HTTP Requests
You can click the plus sign by each domain name to expand a full
Stats Tree
list of resources accessed from that domain name. In the following
Example
example, the plus sign by www.sonyericsson.com was clicked.
Expanded
You can see that multiple URLs at that domain name were
accessed by the computer that was the subject of the filter.
01/09
For Official Use Only - Law Enforcement Sensitive
11-21
Network Intrusion Responder Program
Log Analysis
Exporting Data from Wireshark
Exporting
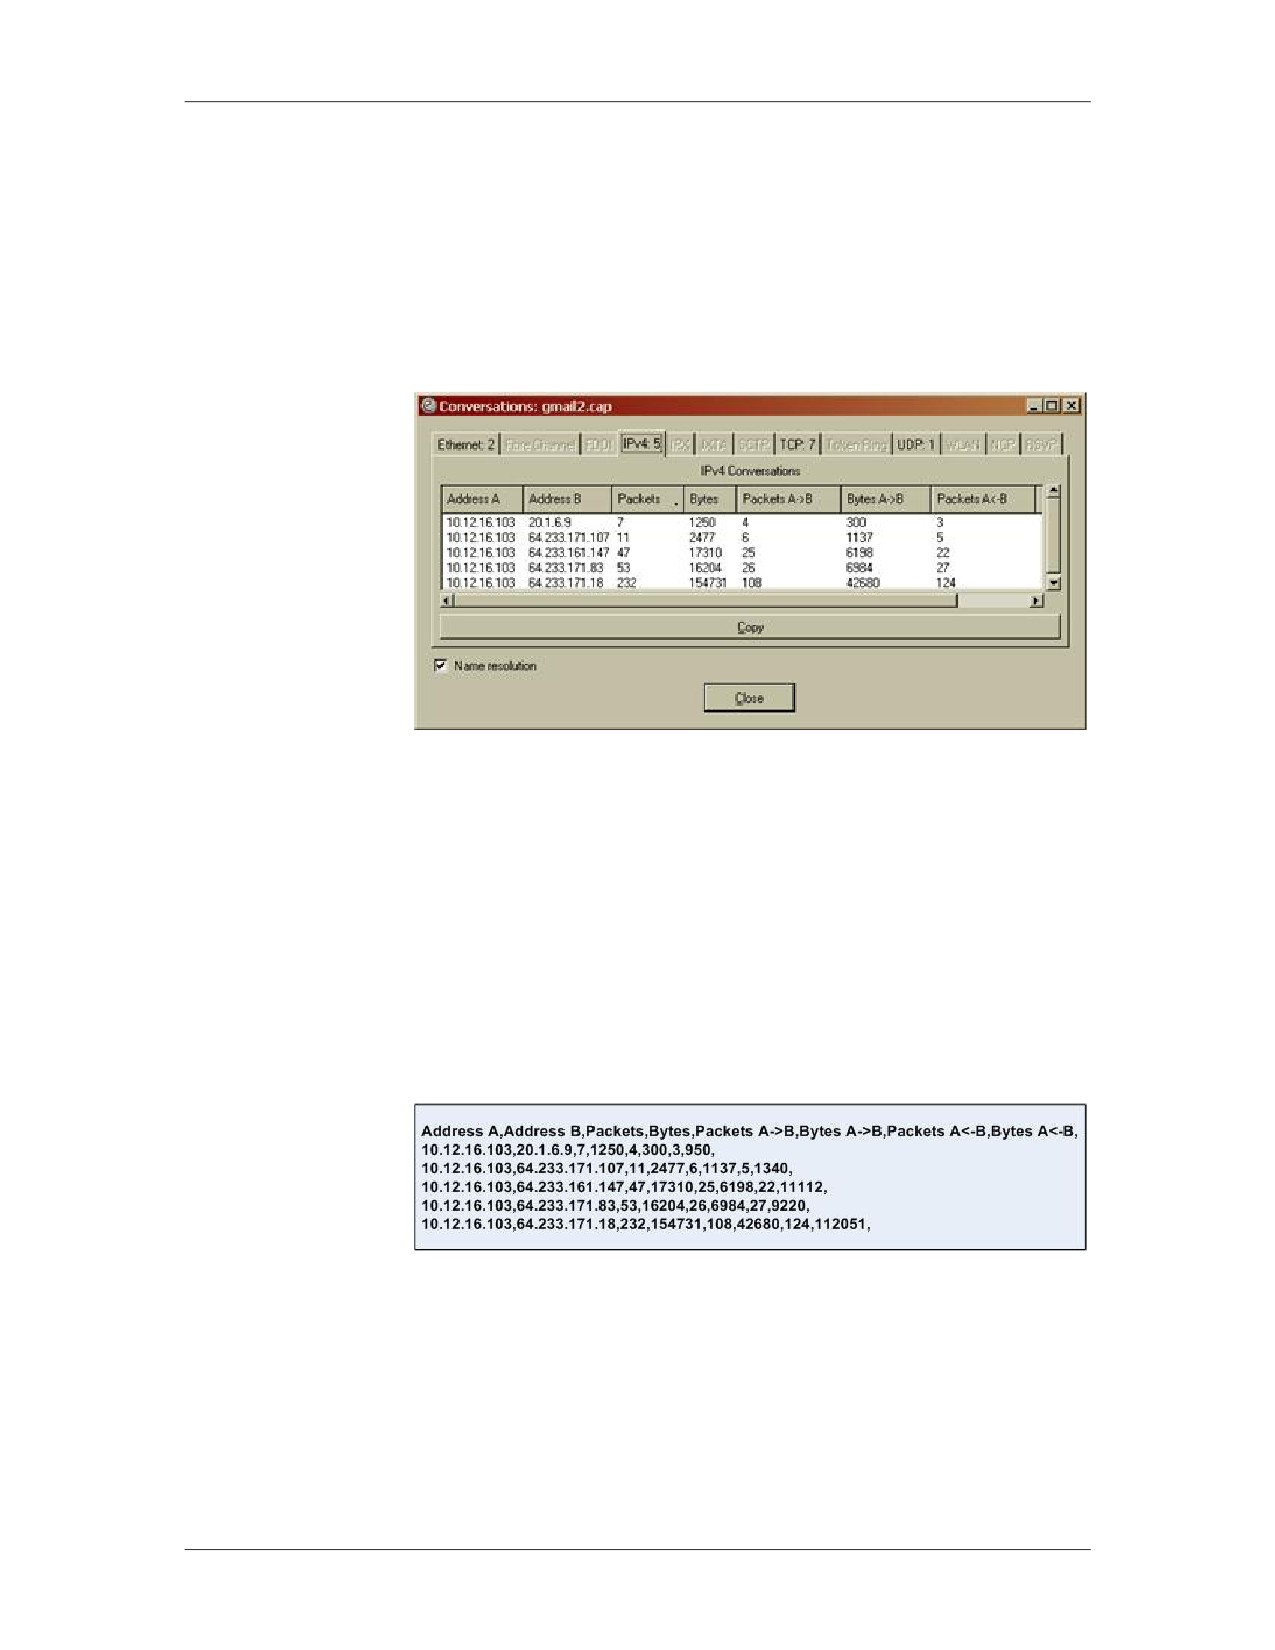
You have the option within some Wireshark statistics windows to
Statistics from
send a copy of any generated statistics to a file. Statistics windows
Wireshark
that are capable of exporting data will have a “Copy” button on the
window, as illustrated in the following screen.
Pressing the copy button only puts the data into the copy buffer of
the computer with Wireshark. To save the data, it has to be pasted
into a file. Use a typical text file application such as Notepad. The
data should not be pasted directly into a spreadsheet, because it
will all be placed into a single cell.
When pasted into a text file, the data is in comma-delimited
format, and includes column headings. However, only the tab
currently displayed in the statistic window is actually copied.
For example, the statistic window above is output as:
11-22
For Official Use Only - Law Enforcement Sensitive
01/09
Log Analysis
Network Intrusion Responder Program
Lesson 2 - Manual Log Analysis
Introduction
When automated tools for log analysis are not readily available,
this lesson explains how to manually examine and search log files
for evidentiary information.
Purpose of this
The purpose of this lesson is to introduce you to ways in which
Lesson
you can search log files manually.
Objectives
After successfully completing this lesson, you will be able to:
Explain how to build keyword lists for searching
Execute simple searches using EGREP
Discuss the basic concept of correlation of data
In this Lesson
The following table shows the contents of this lesson.
Topic
See Page
Filtering and Searching Text Logs
11-24
Deciding What to Search For
11-25
Example Log
11-26
01/09
For Official Use Only - Law Enforcement Sensitive
11-23
Network Intrusion Responder Program
Log Analysis
Filtering and Searching Text Logs
Filtering and
Filtering and searching text logs requires the following
Searching Text
capabilities:
Logs
Identify all log entries with a specific value or range of values
Modify the view of one or more log files based upon the
existence of an arbitrarily defined parameter
Filtering and
Flexibility is the most important feature for any tool used to
Searching Toolset
perform filtering and searching. This is because over time you will
encounter a wide variety of log files that will require you to search
for different types of values. Your tools and techniques must be
usable regardless of the log type and the value for which you are
searching.
The primary application used in this course for searching and
filtering text logs is GREP (Global Regular Expressions Print), and
its newer version EGREP (Extended Global Regular Expressions
Print). These applications use regular expressions to define search
parameters. Regular expressions are the most common method for
defining search parameters, and are used in many other popular
applications, such as PERL, Snort, and EnCase.
11-24
For Official Use Only - Law Enforcement Sensitive
01/09
Log Analysis
Network Intrusion Responder Program
Deciding What to Search For
Keywords
Before searching for data in a log file, you first need to have is a
clear understanding of what you are searching for. Rarely will a
“shotgun” or broad focused search turn up useable data. If you
decide on keywords that might be available in the log and would
be a possible artifact of the intrusion you are investigating.
Sample Keywords If you are investigating a person that has attacked a Web server
and gained access to the administration area, some of the things
you might search for in the Microsoft Internet Information System
(IIS) log files might include;
“Error” or “err”
“Overflow”
“Password” or “Pass”
“Admin”
“Unauthorized”
IP addresses of interest
Knowing how Microsoft structures error messages in IIS logs will
be a help in deciding the keywords to look for.
WordPad is not
A tool like WordPad or Notepad can be used for these types of
Your Friend
searches; however, you will find that the data returned is not easily
useable and does not allow you to filter the information for clarity
or further use.
You can obtain different versions of the Grep command for
Windows operating systems from several sites. One GUI version
of Grep, WinGrep, is available at http://www.wingrep.com.
In the following examples we will be using the Unix version of the
Grep command.
01/09
For Official Use Only - Law Enforcement Sensitive
11-25
Network Intrusion Responder Program
Log Analysis
Example Log
First Look
In this example, you review logs from a Web server that was
exploited. The logs are from the IIS server on the day of the attack.
Looking at the first few lines of the log file, you can determine the
program and version that created the file and the start and end
dates of the file. This can be helpful if we know the approximate
time that the attack occurred.
If we know the attack happened on a Monday and the log is from
the previous Wednesday, it may have little if any evidence value.
IP Search
Since this log is from the server that was attacked, searching for
the server’s IP address would not be useful since each entry should
have that IP address in it.
If you know the IP address of the attacker, search for that, but in a
NAT environment the IP could have been used or reused by
another user in this same log.
It would be better to save IP searches to the end so that you can
search for specific IP and times together.
11-26
For Official Use Only - Law Enforcement Sensitive
01/09
Log Analysis
Network Intrusion Responder Program
Example Log, continued
String Search
We know that the attacker used an administrative account to log
into the server. In order to do this, they would have entered a
username and password. Let’s start there.
Searching for
Thinking about our keywords, we will start with the possibility that
Password
Password is a good clue. We can perform a search by typing
grep ‘pass’ IIS5211_6.txt
This will search for the string of characters pass in every line of the
log file IIS5211_6.txt. This query should return approximately 73
lines of found text.
At the top of the return you should see something like the image
below. You may have to widen your command window to get the
lines to look the same.
01/09
For Official Use Only - Law Enforcement Sensitive
11-27
Network Intrusion Responder Program
Log Analysis
Example Log, continued
Searching for
What we notice when looking at this view is a series of attempts to
Password,
guess the password file for the system. This is not normal network
continued
traffic and is the first clue of one of the methods attempted by an
attacker.
Farther down the list we find an attempt on the login page in the
admin directory.
The attacker is trying different account names and password
combinations.
Suspicious Text
As you look through some of the next lines that were returned, you
may find a line with this information in the line:
2006-05-31 20:49:52 W3SVC508294276 10.8.1.39 GET
/admin/login.asp username=testFUZZCRTL&password=testpass
80
The text FUZZCTRL should be suspicious to you. It might be a
legitimate username or password or it might not. If you search the
Internet for FUZZCTRL you can find reference to a vulnerability
scanning Web proxy called Suru. The manual for Suru is a free
PDF download and, if viewed, you will see examples of a server
attack that match the lines shown in this log.
Response
You can now correlate a known tool with an IP address and a time
frame, allowing you to now proceed with a plan to contact the ISP
for the domain that the attacker is coming from. You can then
follow your agencies policy for contacting, serving preservation
letters and obtaining warrants for information on the attacker if
needed.
11-28
For Official Use Only - Law Enforcement Sensitive
01/09
Log Analysis
Network Intrusion Responder Program
Lesson 3 - Automated Log Analysis Tools
Introduction
There are not many automated tools that allow you to search log
files. Most require complex programming and setup prior to use
with every case. We will now look at Sawmill which is one of the
better tools on the market.
Purpose of this
The purpose of this lesson is to introduce the automated log
Lesson
analysis tool Sawmill.
Objectives
After completing this lesson, you will be able to:
Install and configure the Sawmill program
Describe the function and use of the Sawmill program
In this Lesson
The following table shows the contents of this lesson.
Topic
See Page
What is Sawmill?
14-30
Installing Sawmill
14-31
Network Log Analysis Using Sawmill
14-38
01/09
For Official Use Only - Law Enforcement Sensitive
11-29
Network Intrusion Responder Program
Log Analysis
What is Sawmill?
Introduction
When analyzing network text logs for signs of an intrusion, a
network intrusion analyst must quickly parse those logs to locate
the data that correlates to the intrusion. Sawmill is a tool that will
assist the analyst in parsing network text logs and organizing the
logs into an easy-to-read report.
Capabilities of
Sawmill can process various text logs generated by a variety of
Sawmill
network security devices. Sawmill also converts the text log to a
cross-linked report that allows an analyst to customize the report
according to the output requirements.
Download
Sawmill can be purchased and downloaded from the following
Information
website:
The initial download and installation comes with a 30 day,
unlimited profile license.
11-30
For Official Use Only - Law Enforcement Sensitive
01/09
Log Analysis
Network Intrusion Responder Program
Installing Sawmill
Procedure:
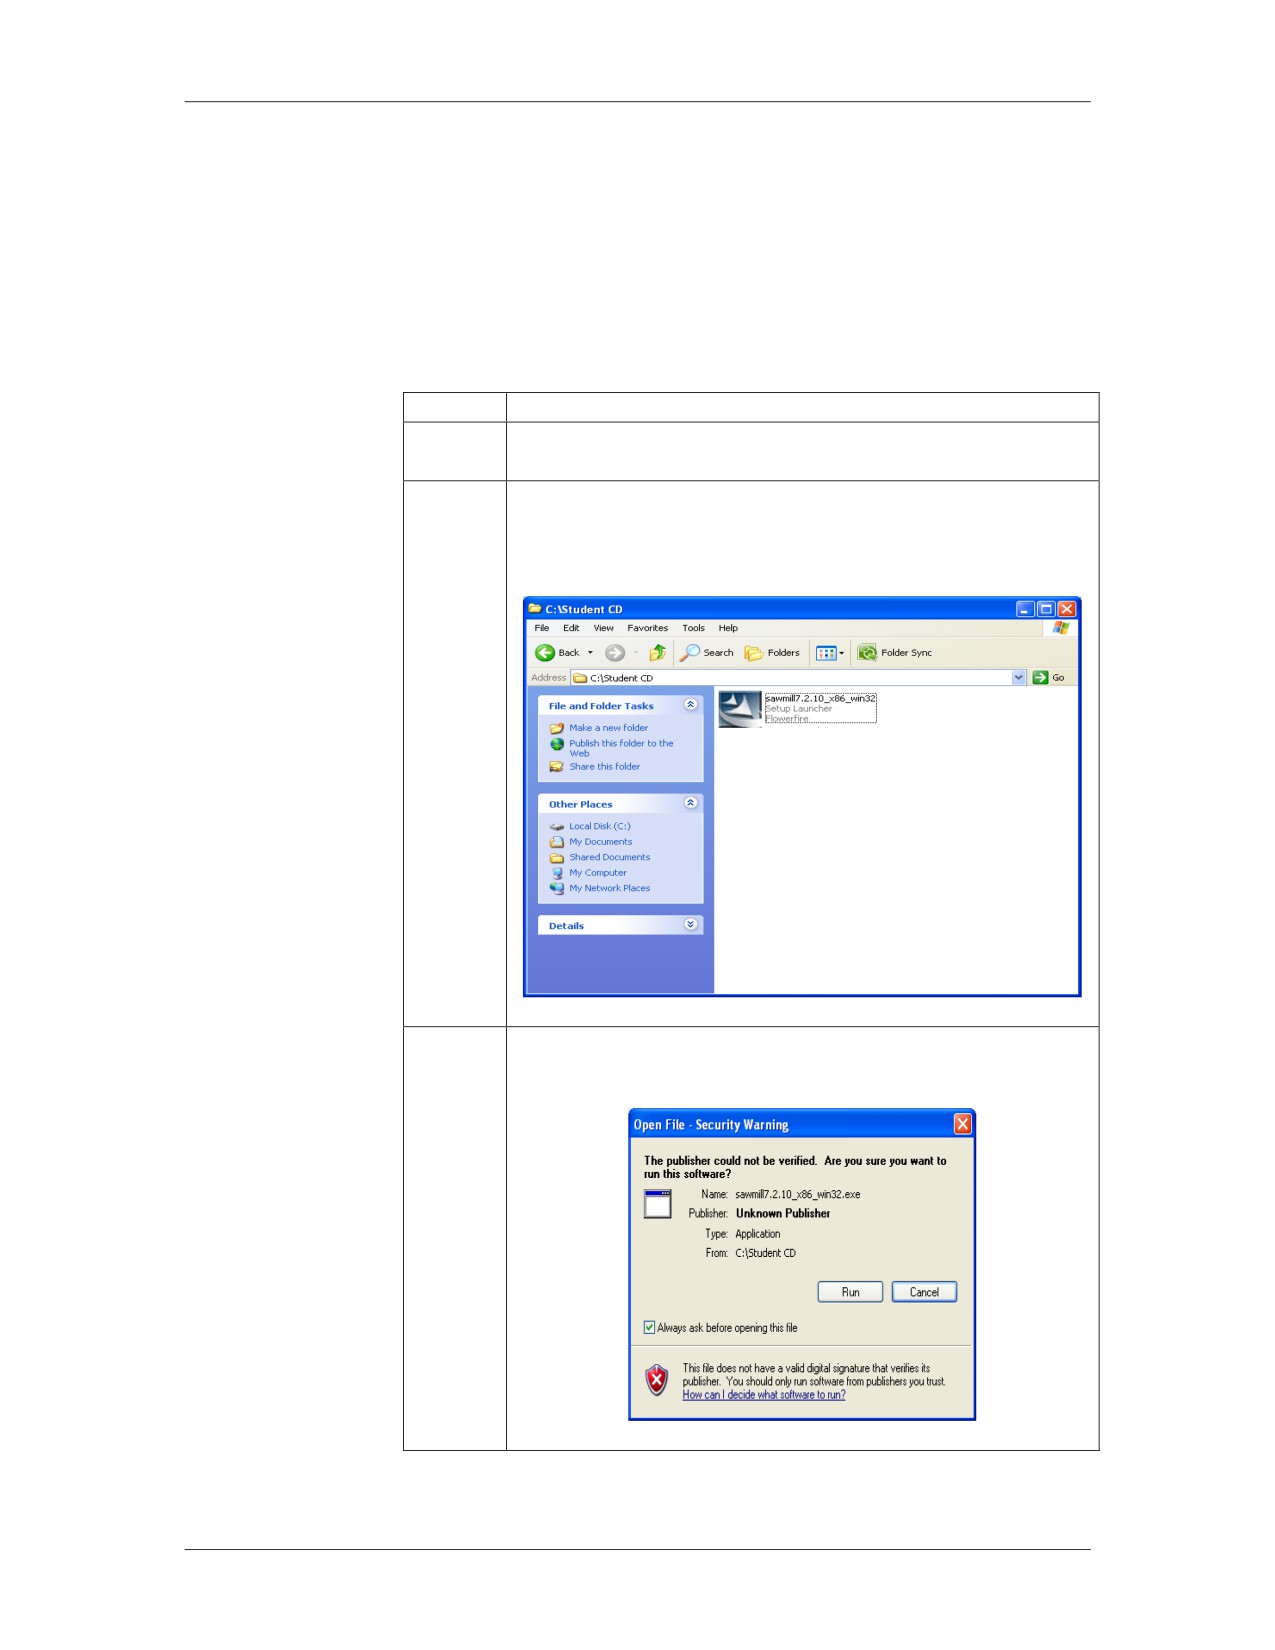
Use the following procedure to install and configure Sawmill in a
Installing and
Windows environment.
Configuring
Sawmill
Step
Action
1
From the system desktop, double-click on the My
Computer icon.
2
In the My Computer window, navigate to the location of
the sawmill setup executable and double click on the
Sawmill (7.2.11_x86_win32) icon.
3
If you receive the Unknown Publisher warning, click on
Run.
01/09
For Official Use Only - Law Enforcement Sensitive
11-31
Network Intrusion Responder Program
Log Analysis
Installing and Configuring Sawmill, continued
Procedure: Installing and Configuring Sawmill, continued
Step
Action
4
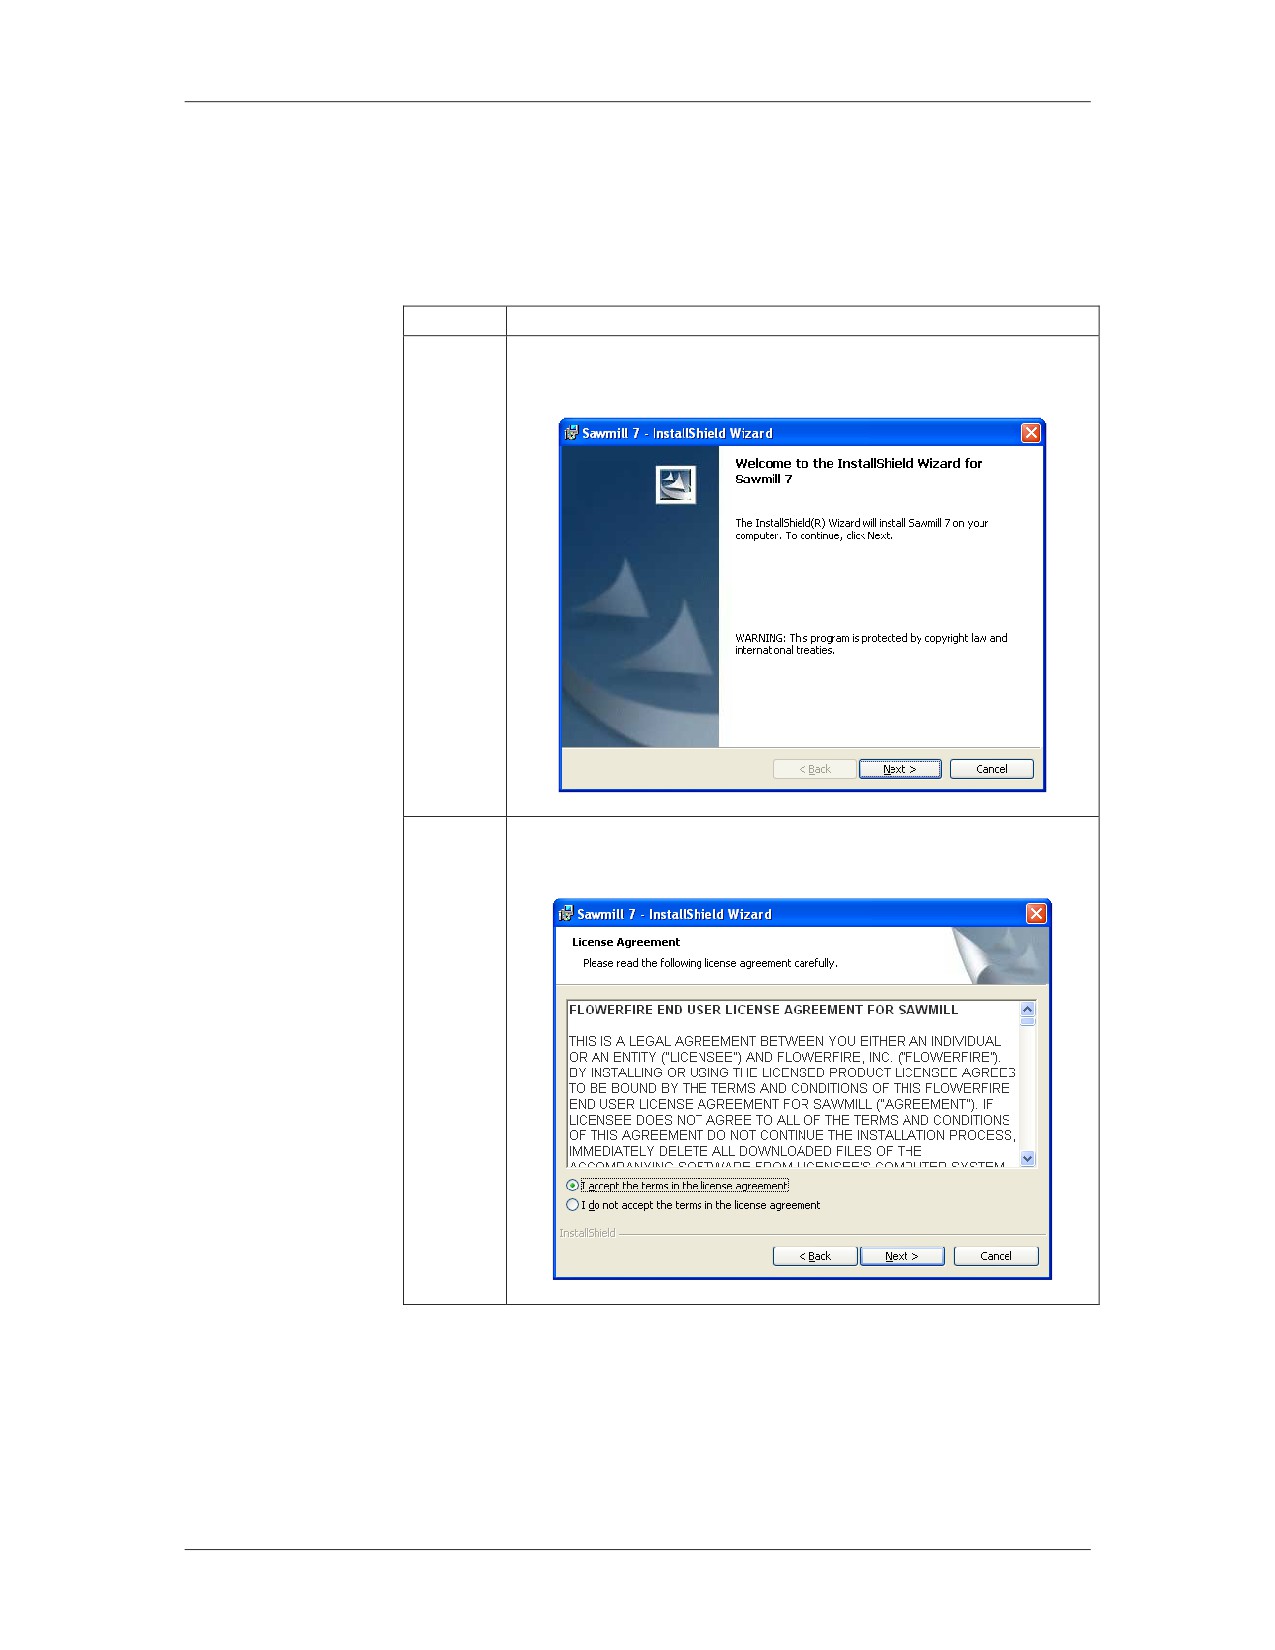
At the InstallShield Wizard, click Next to install
Sawmill.
5
Read the End User License Agreement and accept the
license. Click Next.
11-32
For Official Use Only - Law Enforcement Sensitive
01/09
Log Analysis
Network Intrusion Responder Program
Installing and Configuring Sawmill, continued
Procedure: Installing and Configuring Sawmill, continued
Step
Action
6
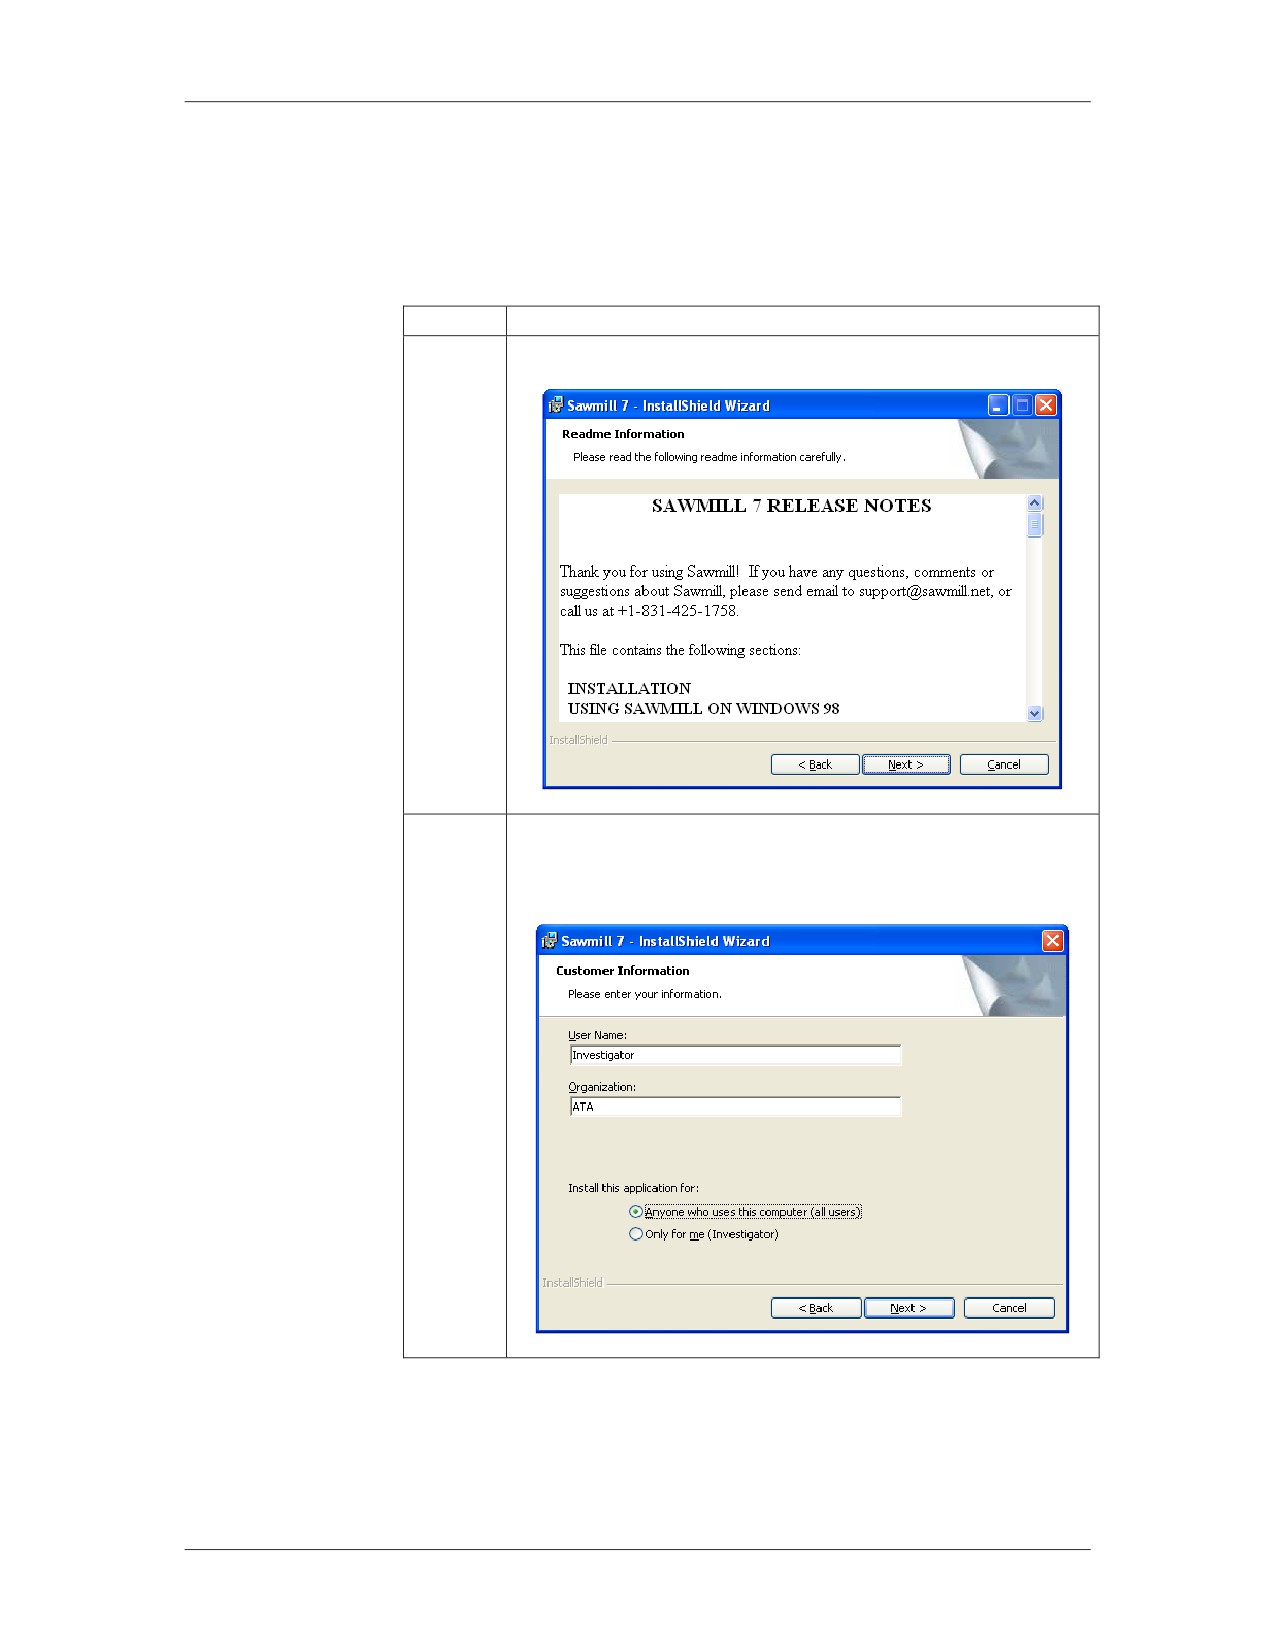
At the Release Notes window, click Next.
7
At the Customer Information window, enter your
personal details, ensure “Anyone who uses this
computer (all users)” is selected, and then click Next.
01/09
For Official Use Only - Law Enforcement Sensitive
11-33
Network Intrusion Responder Program
Log Analysis
Installing Sawmill, continued
Procedure: Installing and Configuring Sawmill, continued
Step
Action
8
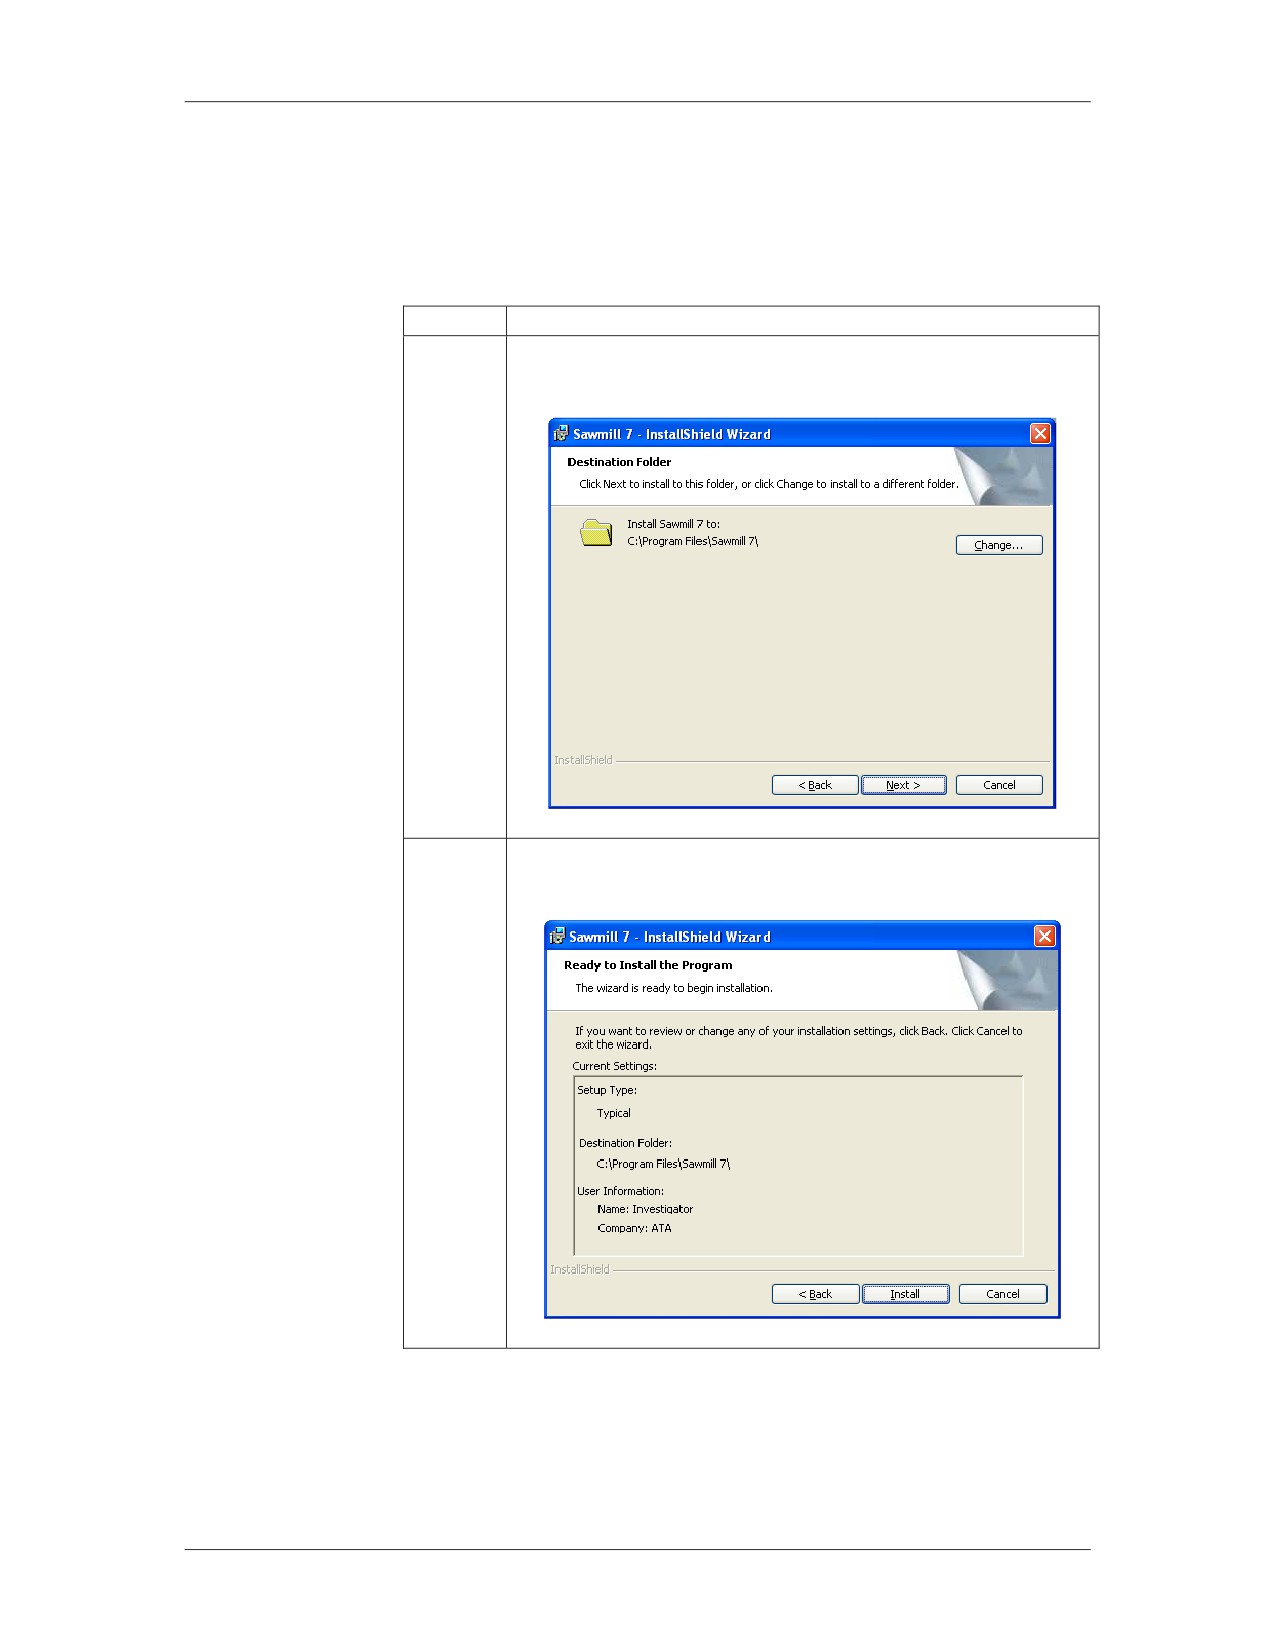
At the Destination Folder window, click Next to install
Sawmill in the C:\Program Files\Sawmill 7 folder.
9
At the Ready to Install the Program window, click
Install to install Sawmill.
11-34
For Official Use Only - Law Enforcement Sensitive
01/09
Log Analysis
Network Intrusion Responder Program
Installing Sawmill, continued
Procedure: Installing and Configuring Sawmill, continued
Step
Action
10
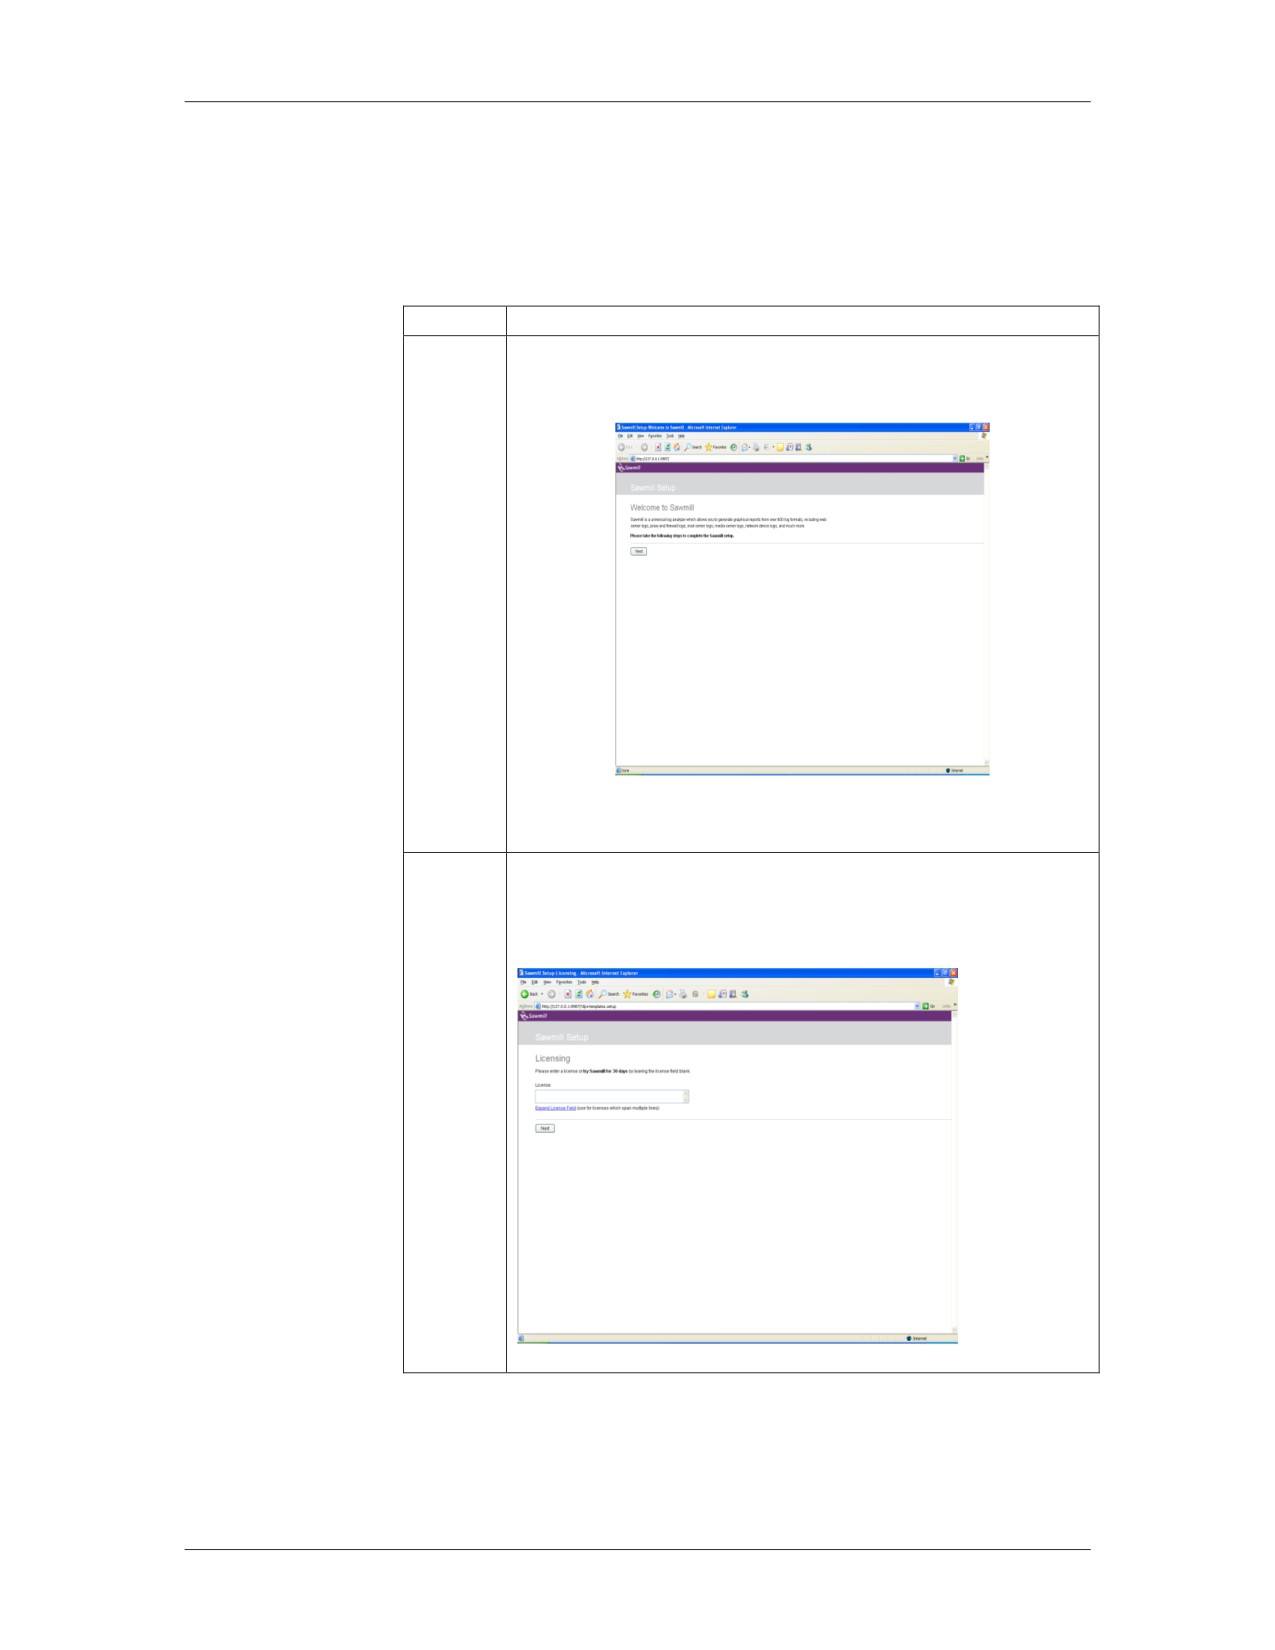
The Sawmill setup Web interface will appear. Click
Next to proceed.
11
On the Sawmill Licensing setup screen, click Next. Use
the 30 day trial license or enter your purchased license
number.
01/09
For Official Use Only - Law Enforcement Sensitive
11-35
Network Intrusion Responder Program
Log Analysis
Installing Sawmill continued
Procedure: Installing and Configuring Sawmill, continued
Step
Action
12
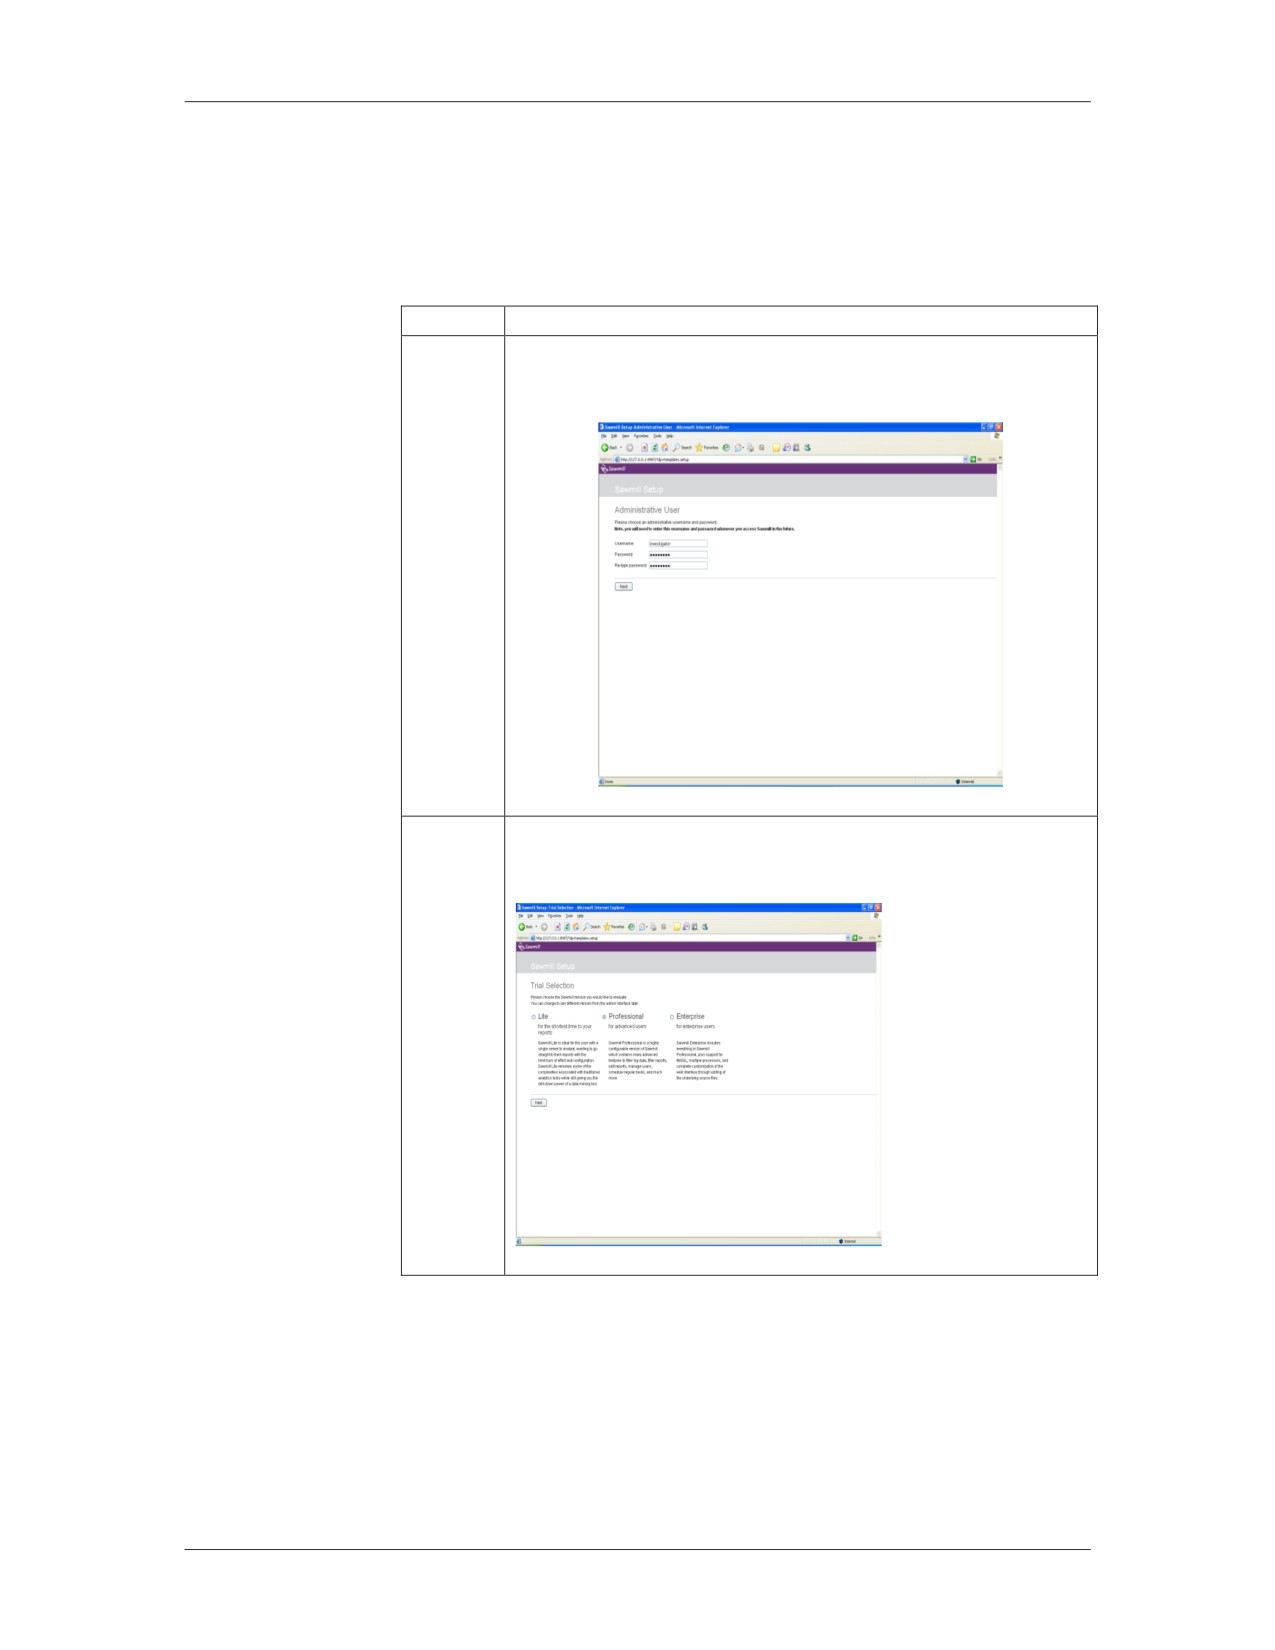
On the Administrative User setup screen, type the
Username and Password and then click Next.
13
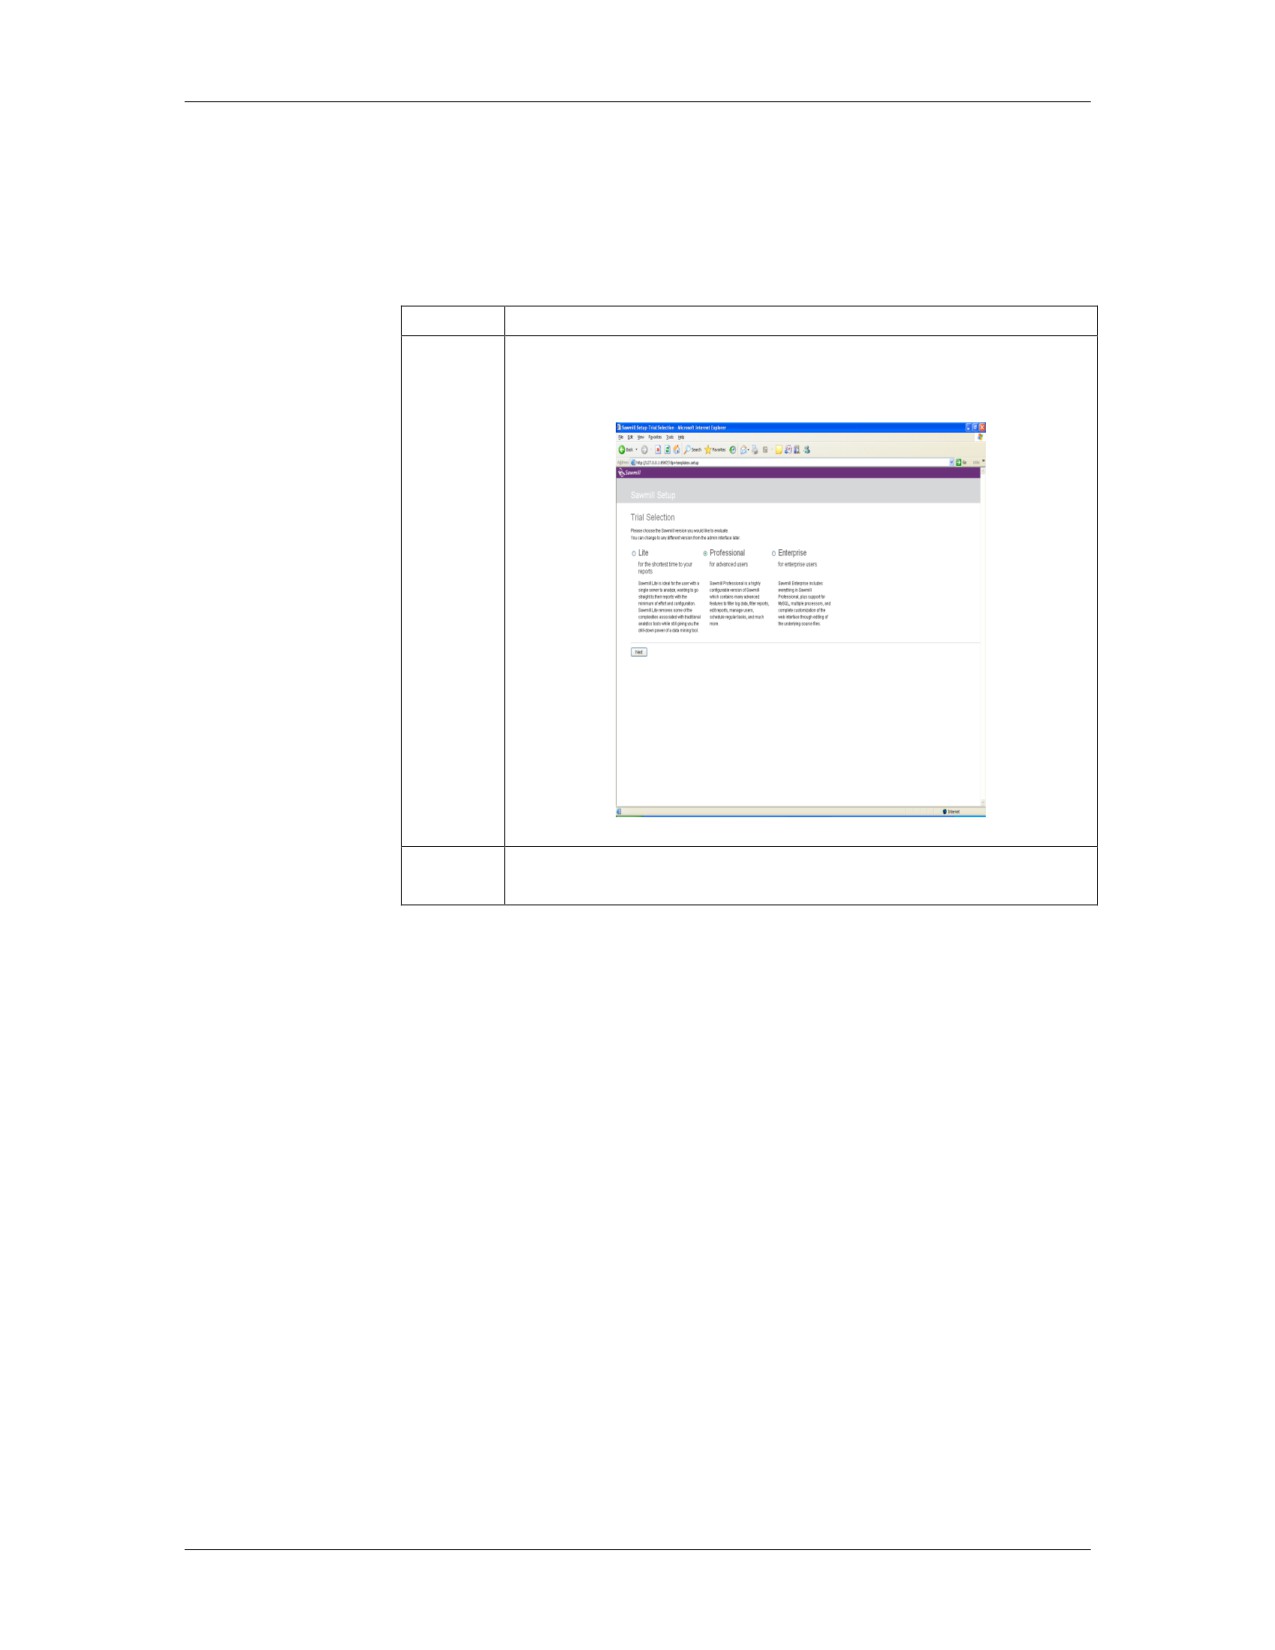
On the Trial Selection Screen, select Professional and
then click Next.
11-36
For Official Use Only - Law Enforcement Sensitive
01/09
Log Analysis
Network Intrusion Responder Program
Installing Sawmill, continued
Procedure: Installing and Configuring Sawmill, continued
Step
Action
14
On the Automated Feedback Agent screen, un-check the
checkbox and then click Next.
15
On the Complete Setup screen, click Finish to complete
the setup.
01/09
For Official Use Only - Law Enforcement Sensitive
11-37
Network Intrusion Responder Program
Log Analysis
Network Log Analysis using Sawmill
The
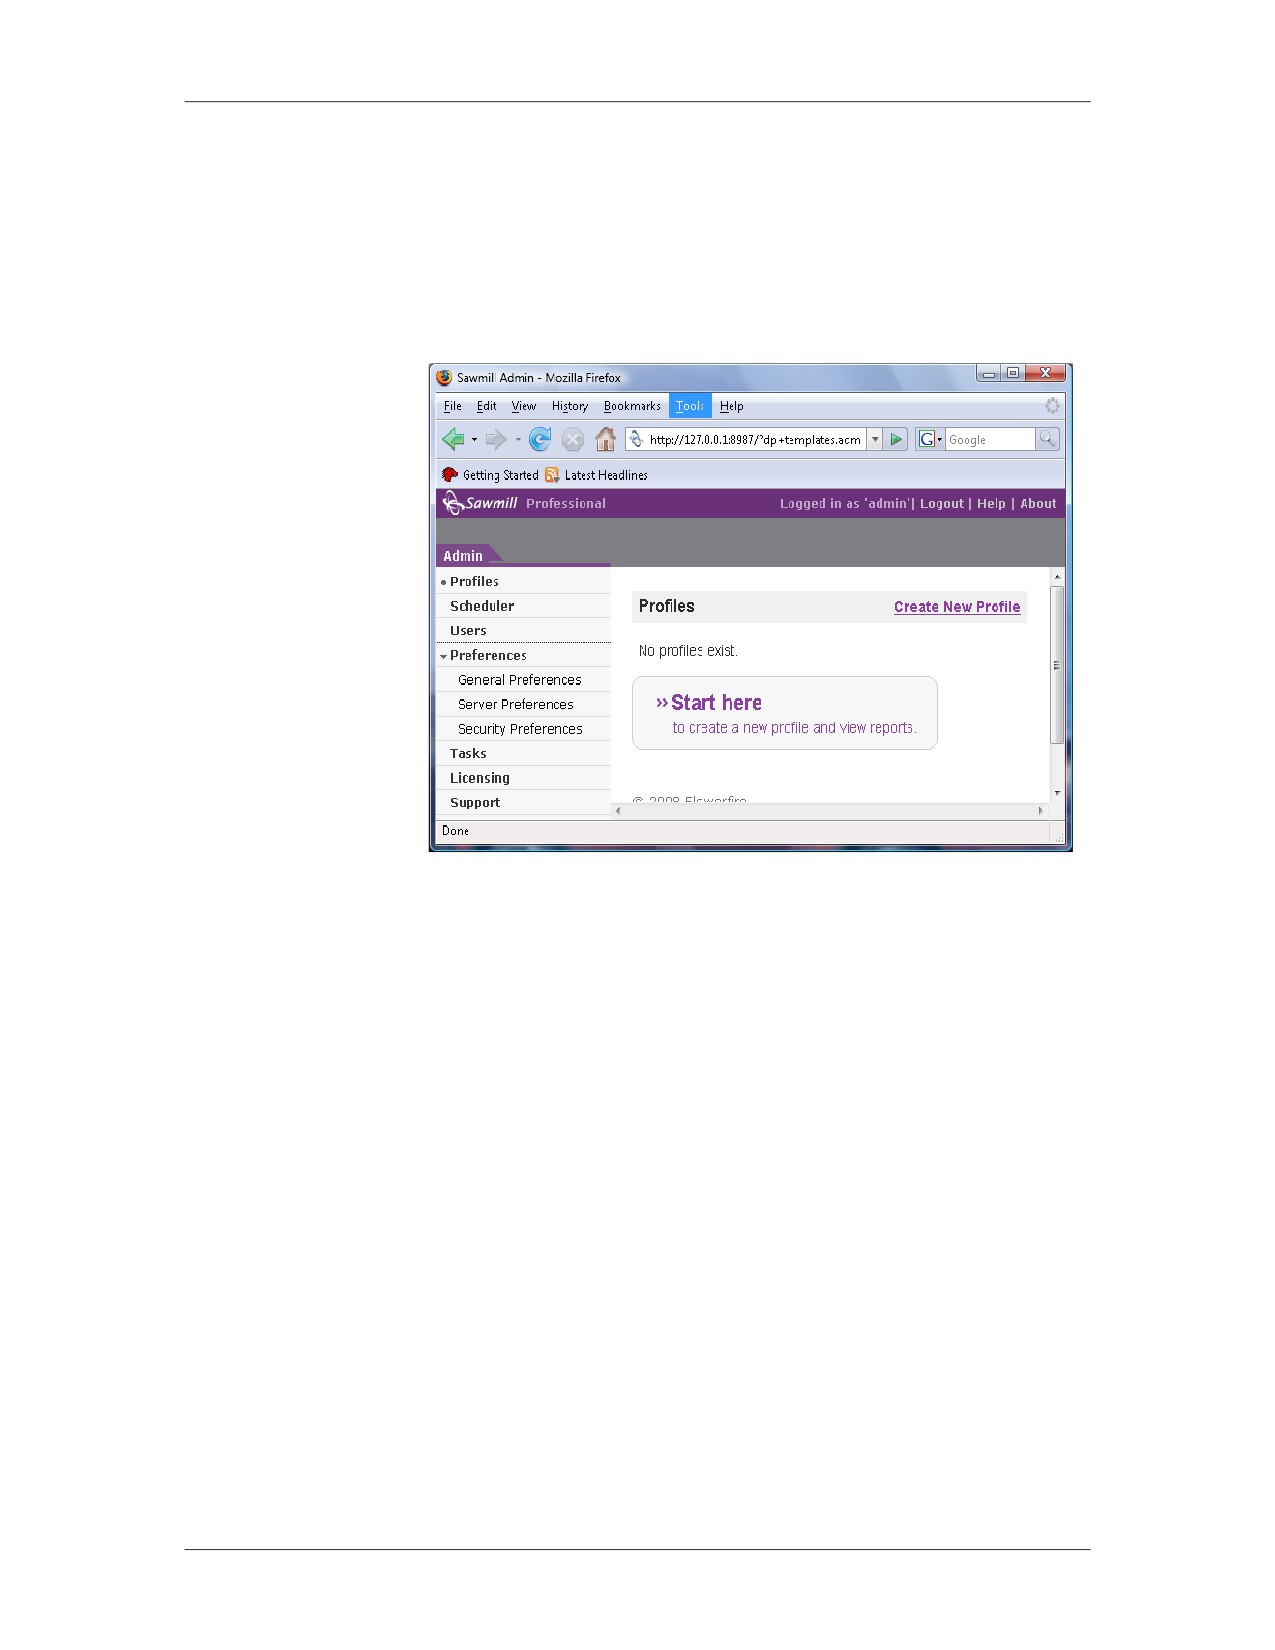
Below is a screenshot of Sawmill’s Administrative interface.
Administrative
Interface
11-38
For Official Use Only - Law Enforcement Sensitive
01/09
Log Analysis
Network Intrusion Responder Program
Network Log Analysis using Sawmill, continued
Procedure:
In this procedure, you create a report profile and use it to parse and
Creating a Report
sort the selected text log for requested information:
Profile
Step
Action
1
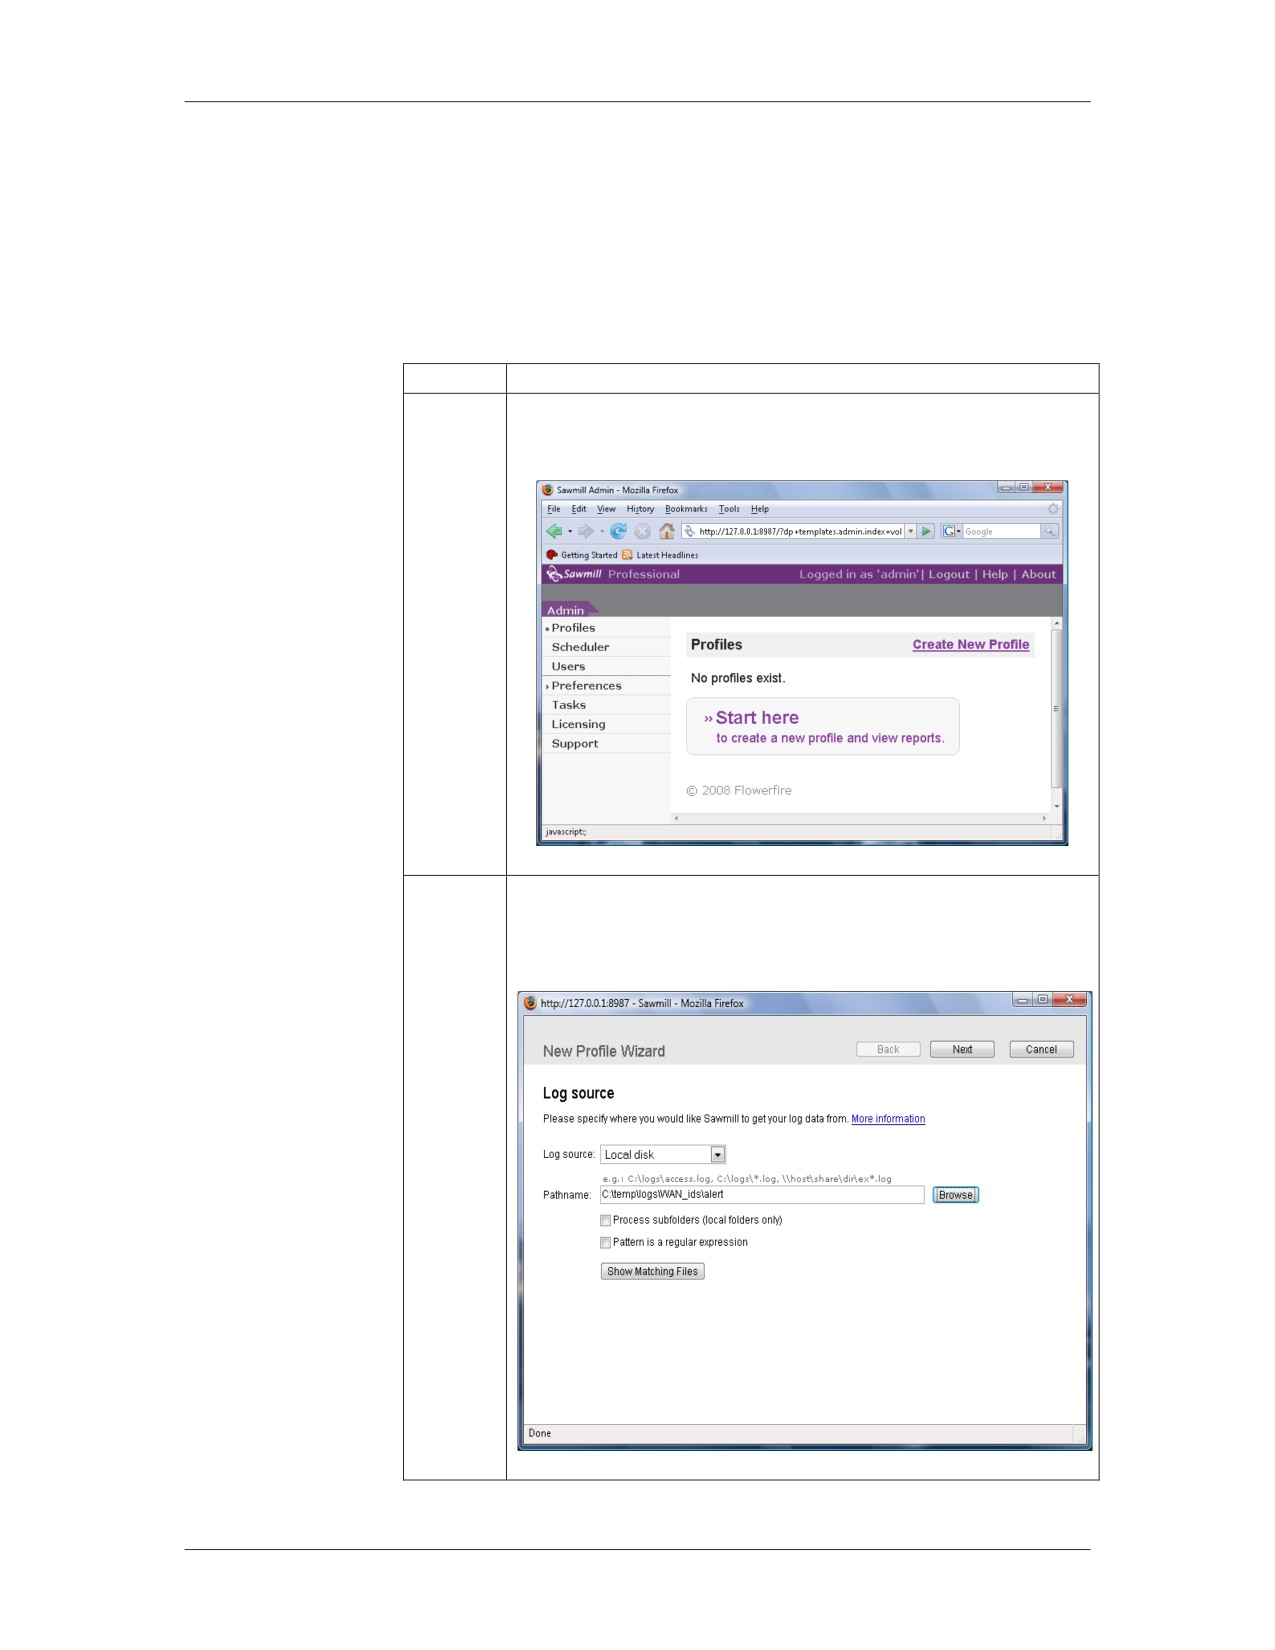
From the Administrative screen, select “Create New
Profile.”
2
In the New Profile Wizard, select Log Source: Local
Disk. For Pathname, click Browse. Navigate to the log
file location and select the log file. Click Next.
01/09
For Official Use Only - Law Enforcement Sensitive
11-39
Network Intrusion Responder Program
Log Analysis
Network Log Analysis using Sawmill, continued
Procedure: Creating a Report Profile continued
Step
Action
3
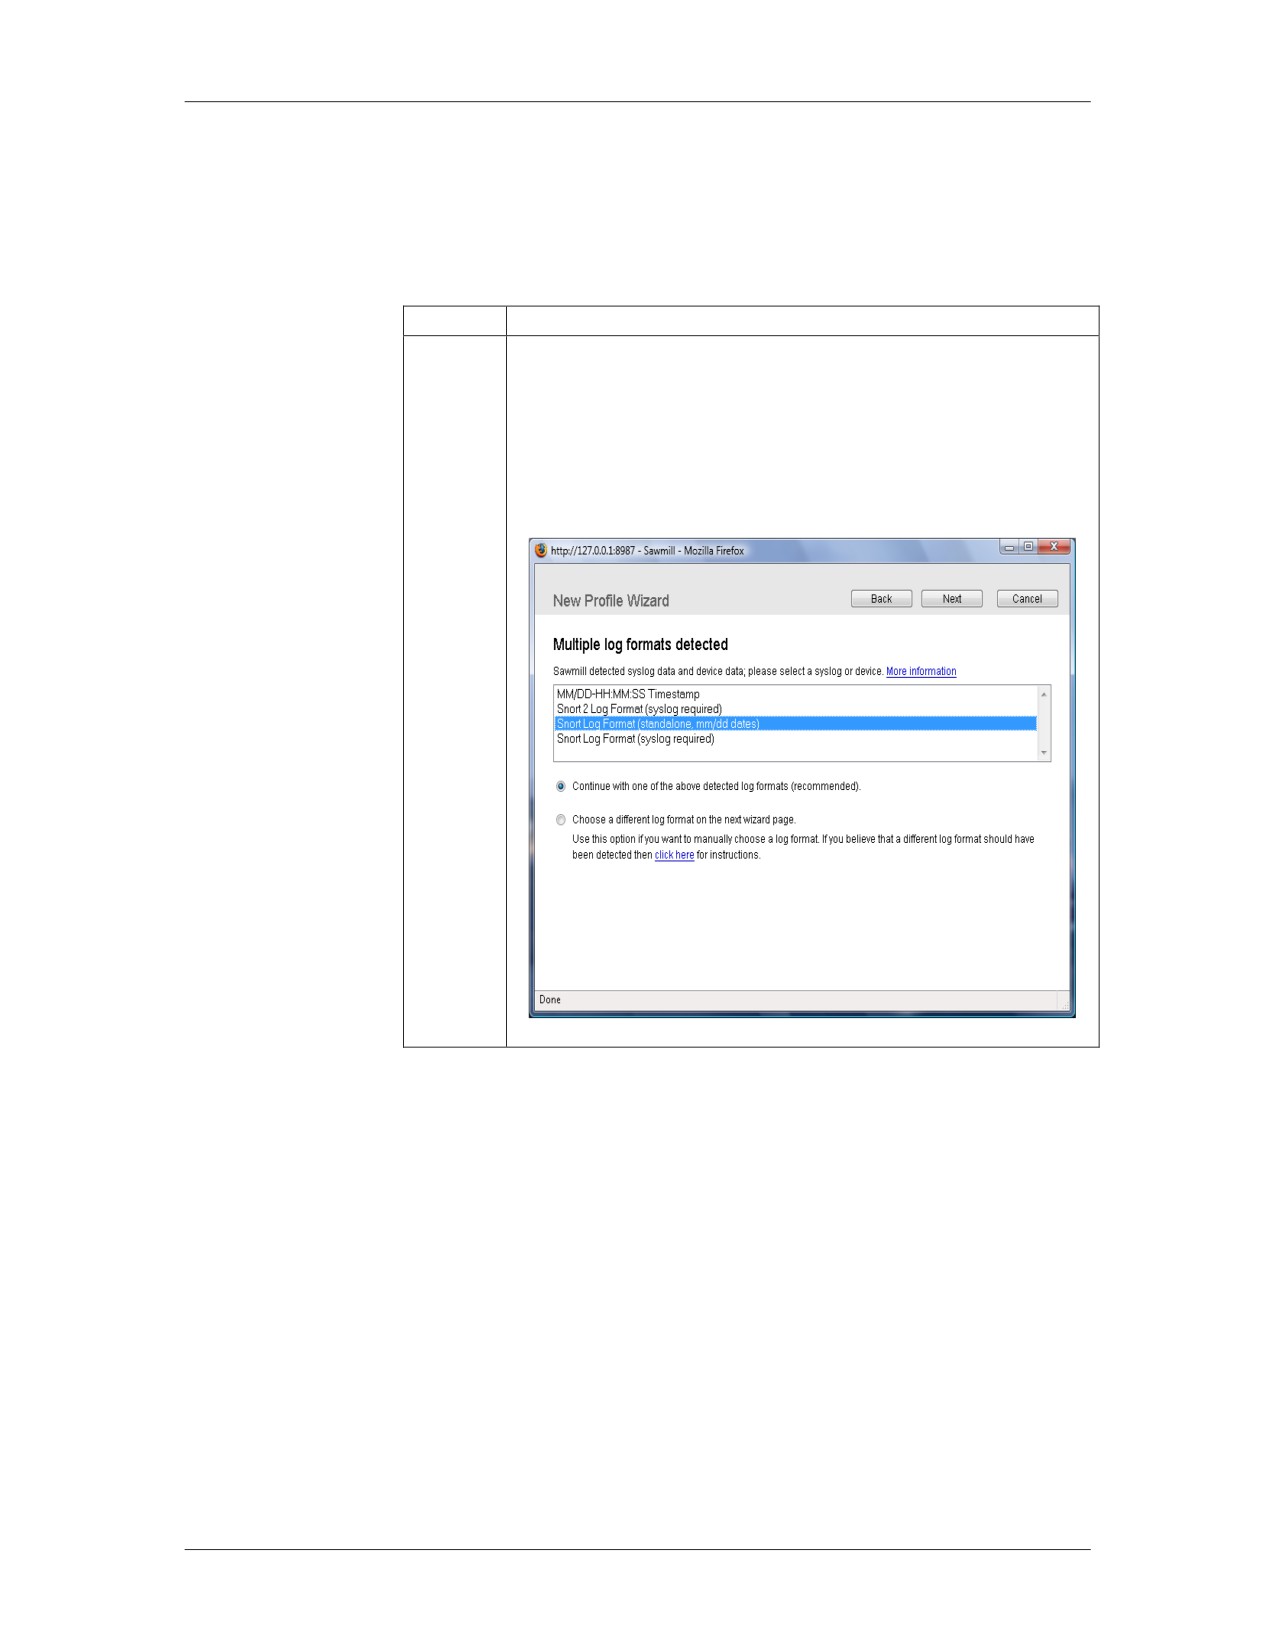
Sawmill automatically attempts to detect the log format
and display the results for user selection. Select the log
format. At the bottom of the display ensure that
“Continue with the above detected log formats” is
selected. Click Next.
11-40
For Official Use Only - Law Enforcement Sensitive
01/09
Log Analysis
Network Intrusion Responder Program
Network Log Analysis using Sawmill, continued
Procedure: Creating a Report Profile continued
Step
Action
4
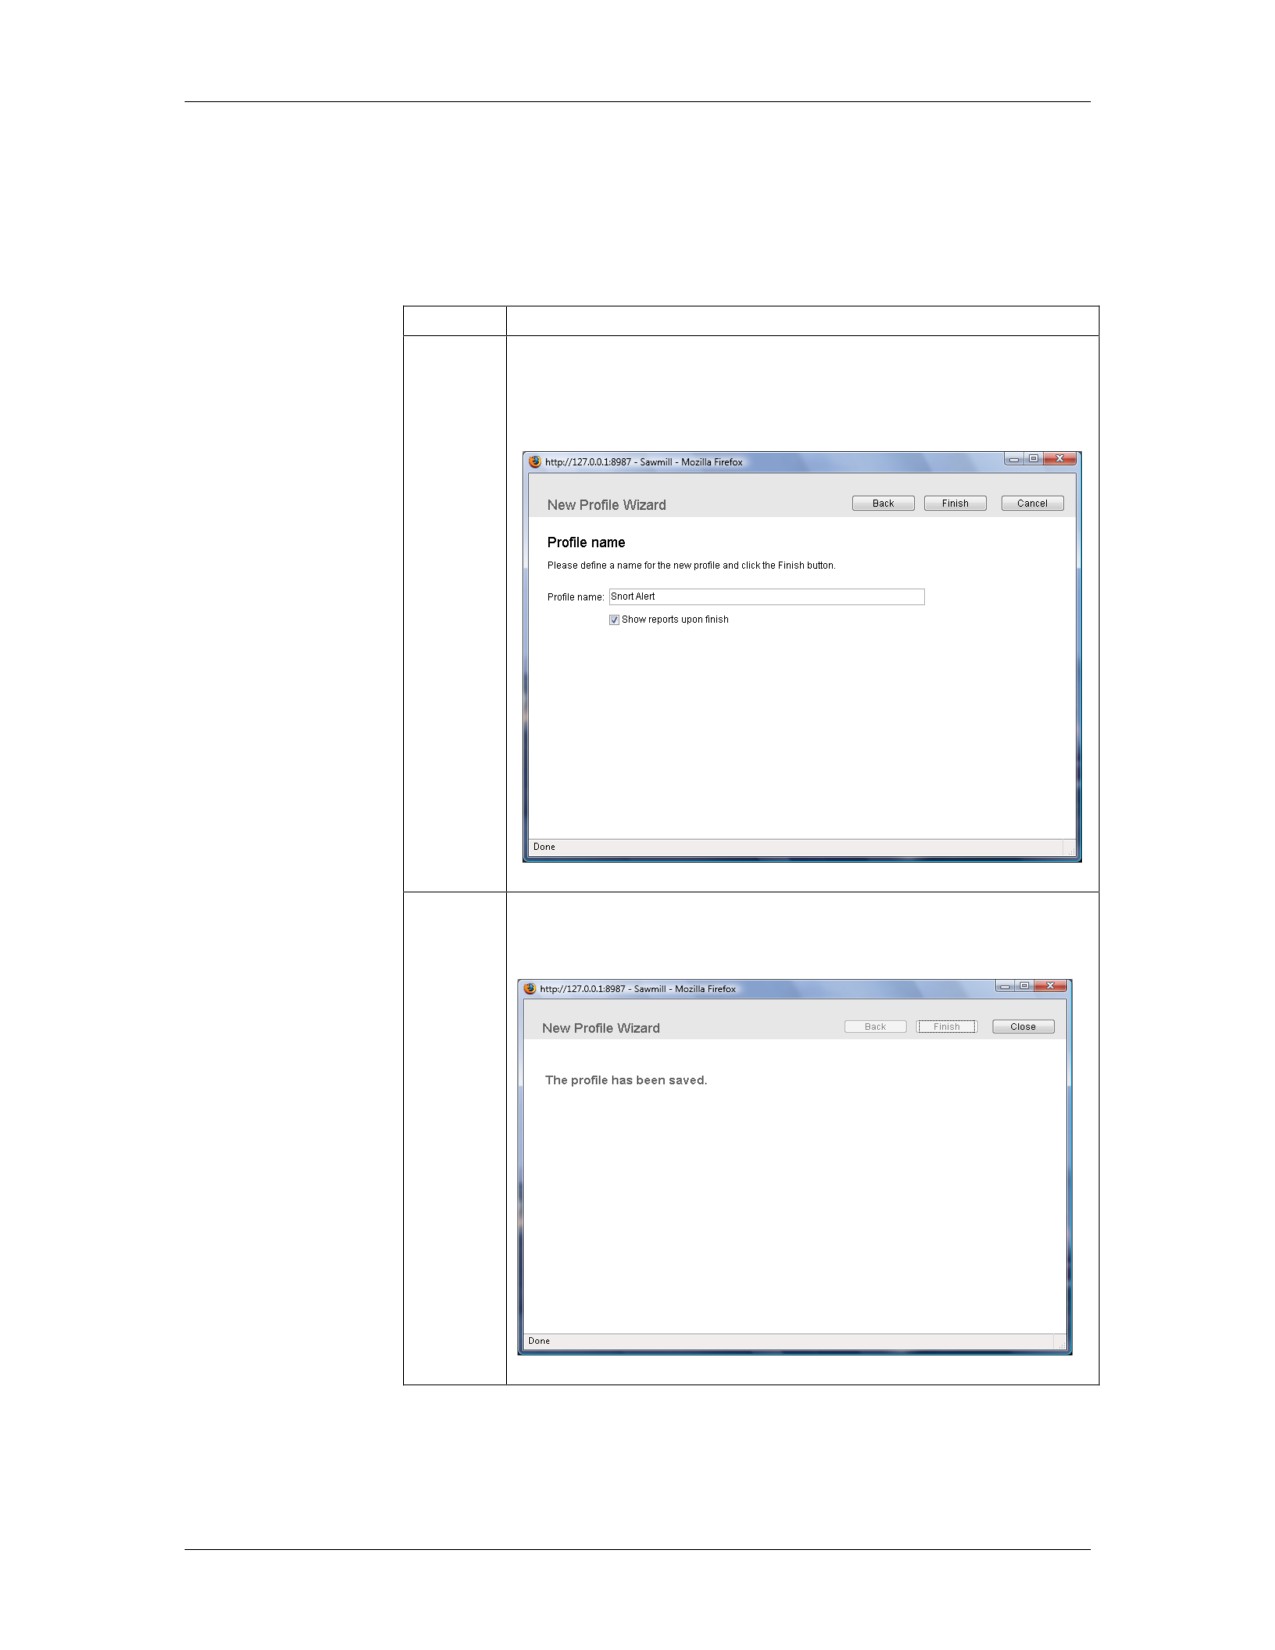
In the “Profile name” type the desired name of the
profile. Ensure the “Show reports upon finish” checkbox
is selected. Click Finish.
5
The profile is saved in the final screen of the New
Profile wizard. Select Close.
01/09
For Official Use Only - Law Enforcement Sensitive
11-41