FLUKE 45 Dual Display Multimeter. Service Manual (For IEC 1010 Meters Only) - page 2
General Maintenance
Fuse Test and Replacement
3
3. Insert the test lead probe into the 100 mA input terminal. If the fuse is good, the
meter will read between 11 and 15 Ω. If the fuse is blown, the meter will
read >10 MΩ to OL.
4. Remove the test lead probe from the 100 mA input terminal, and insert it into
the 10 A input terminal.
If the fuse is good, the meter will read between .04 and 1.0Ω. If the fuse is blown, the
meter will read >10 MΩ to OL.
3-12. Replacing the 500 mA and 440 mA Input Fuses (F1 and F5)
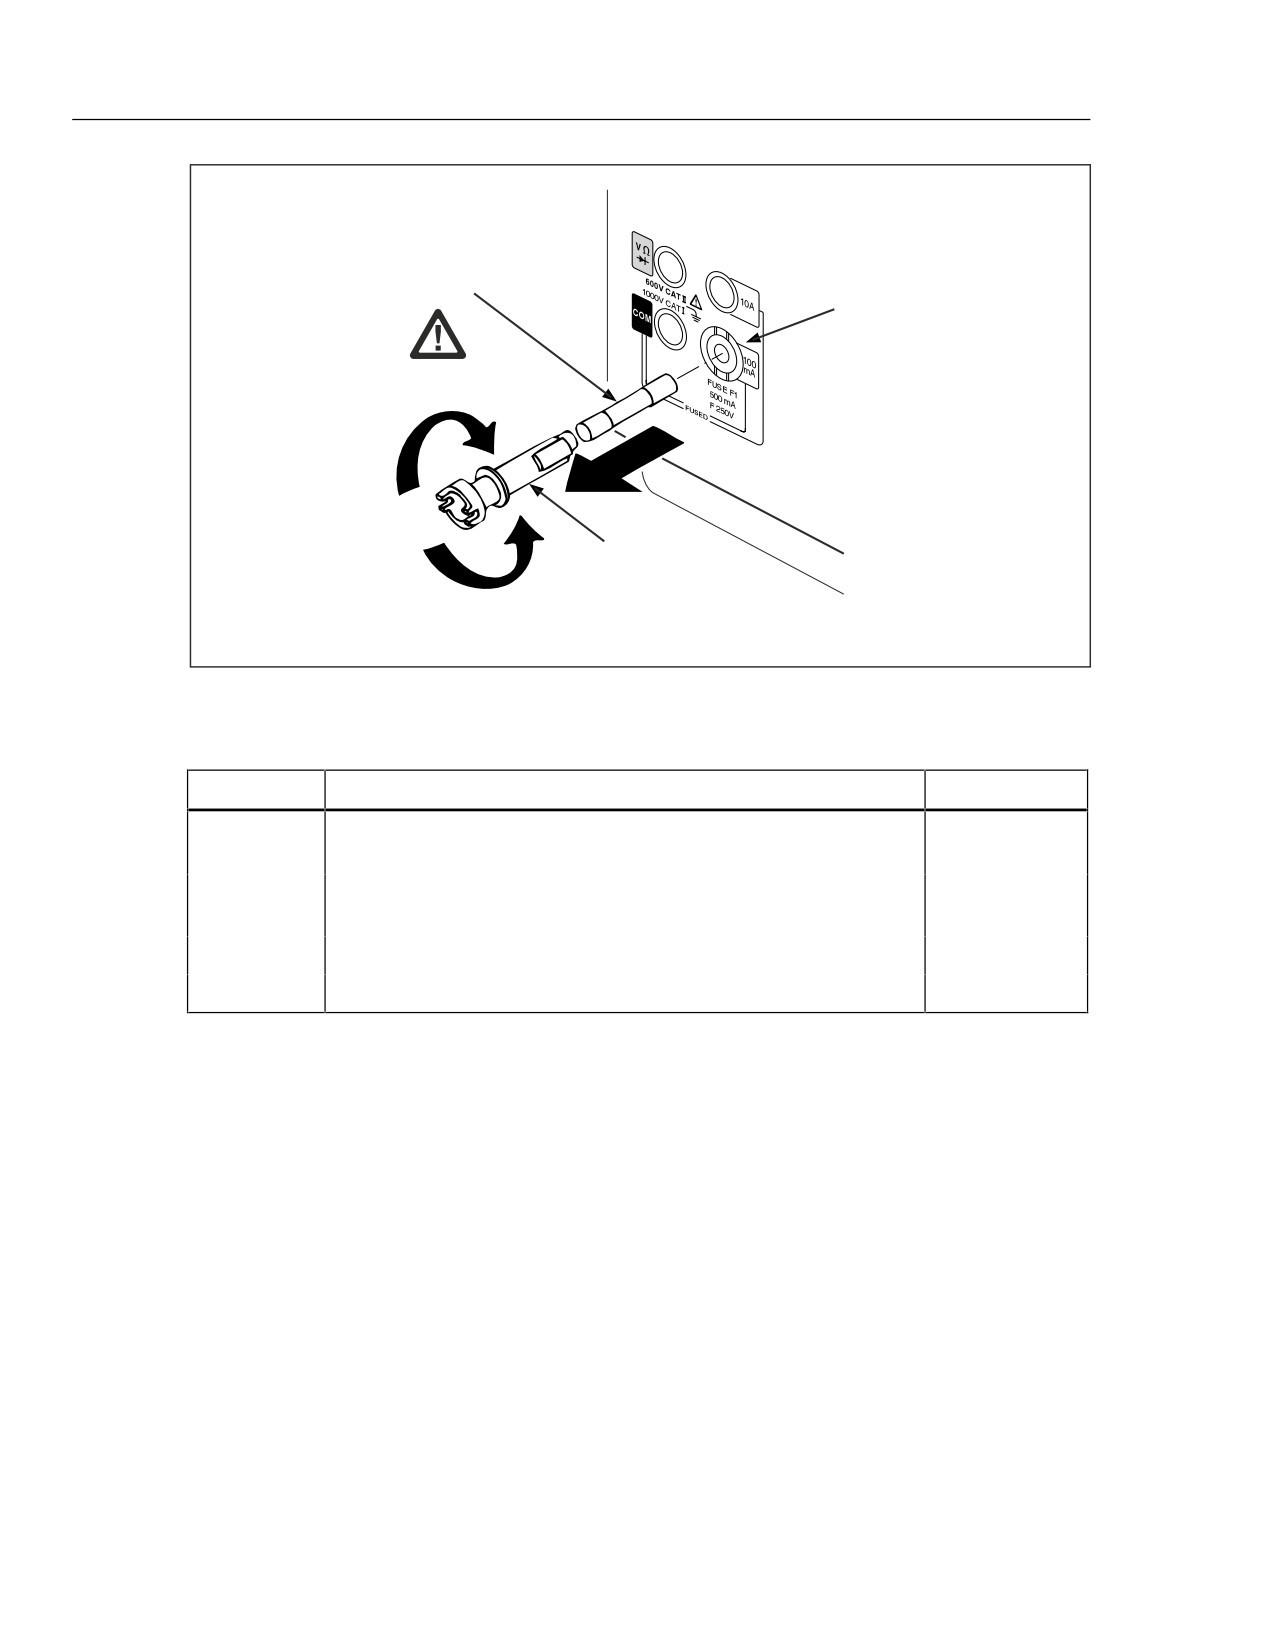
The 100 mA jack is protected by 2 fuses, F1 and F5. F1 is mounted in the front panel
100 mA input jack (Figure 3-2) and F5 is located inside the meter.
To replace F1, first unplug the line cord. Then press in on the input jack and turn it 90
degrees counterclockwise. Slide out the fuse holder and fuse.
Replace a blown fuse with one of identical rating (see Table 3-1), and reinsert the fuse
and holder into the input terminal socket. Secure the fuse holder by pressing in and
turning the holder 90 degrees clockwise.
To change the internal F5 fuse, see “Replacing the 10 A Input Fuse” later in this section.
Rear Panel
Power-Line Cord Connector
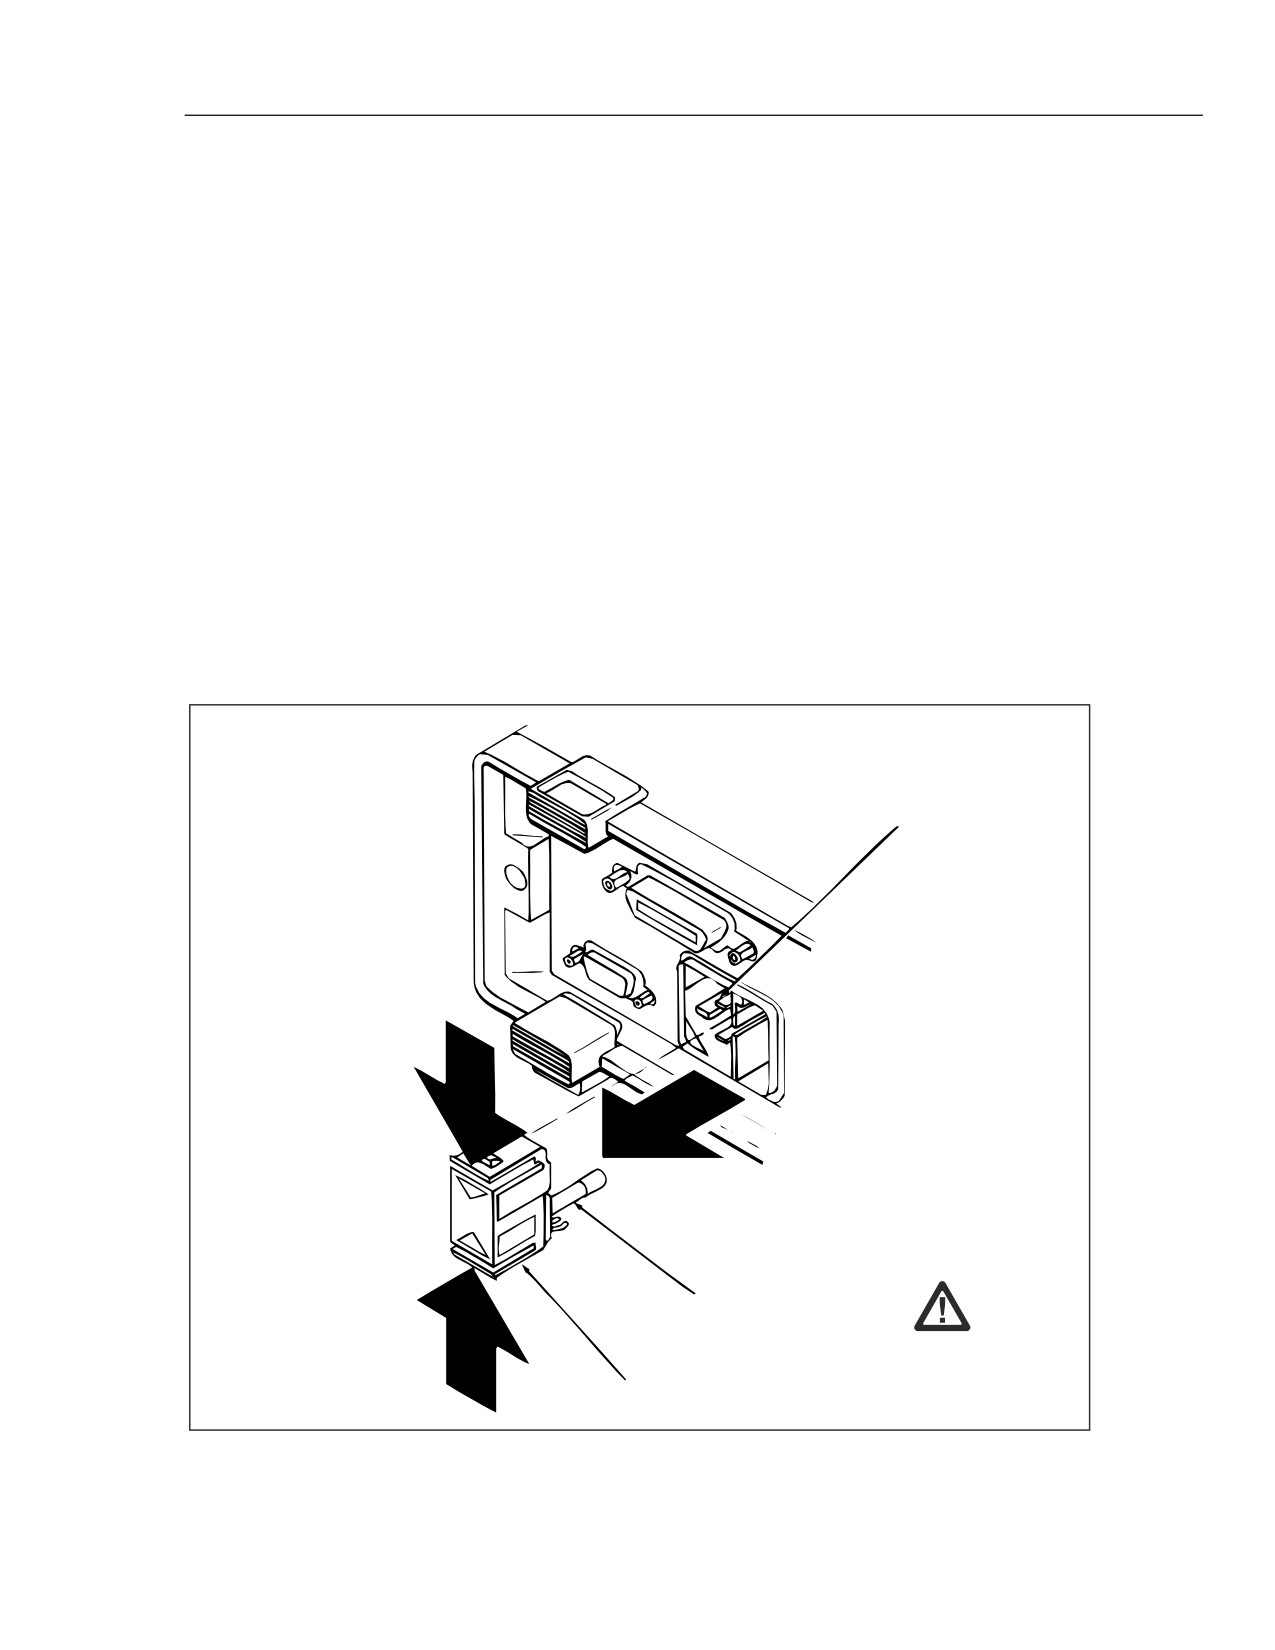
To remove,
Squeeze and slide out
F3 Line Fuse
(T 125 mA, 250 V, Slow Blow)
Fuse Holder
(Spare fuse provided)
qb12f.eps
Figure 3-1. Replacing the Line Fuse (F3)
3-5
45
Service Manual
Front Panel Input Terminal
F1 Fuse (500 mA, 250V, Fast Blow)
1500 A Minimum Breaking Capacity
100 mA Input Socket
Fuse Holder
To remove, push in and turn counter clockwise.
To insert, reverse this procedure.
qb13f.eps
Figure 3-2. Replacing the External 100 mA Input Fuse (F1)
Table 3-1. Fuses
Item
Description
Fluke Part No.
F1
100 mA Input Fuse. F 500 mA, 250 V, (fast blow), 1500 A breaking
838151
capacity.
F2
10 A Input Fuse. F 11 A, 1000 V, (fast blow), 17,000 breaking
943118
capacity.
F3
Line Fuse. T 125 mA, 250 V, (slow blow)
822254
F5
100 mA Input Fuse. F440 mA, 1000 V, 10,000 A minimum interrupt.
943121
3-13. Replacing the 10 A Input Jack Fuse (F2)
The 10 A input jack is protected by an 11 A fuse (F2), located inside the meter. The
following procedure explains how to access and change this fuse. This procedure can
also be used to change F5.
1. Remove the single Phillips-head screw on the bottom of the case and the Phillips-
head screw on each side of the rear bezel.
Warning
Opening the case may expose hazardous voltages. Always
disconnect the power cord and measuring inputs before
opening the case.
2. Remove the bezel and slip the case back from the front of the meter. The fuse and
fuse clip are visible at the front of the main printed circuit assembly (pca) near the
input terminals.
3. Carefully remove the fuse and install a properly-rated replacement.
3-6
General Maintenance
Disassembly Procedures
3
3-14. Disassembly Procedures
The following paragraphs describe disassembly of the Fluke 45 in sequence (from the
fully assembled meter to the chassis level.) Start and end your disassembly at the
appropriate heading levels.
3-15. Remove the Meter Case
Use the following procedure to remove the meter case.
1. Make sure the meter is turned off and unplugged from the power outlet.
2. Discharge the power supply capacitor by turning on the meter (with the meter
unplugged from the power line). After five seconds, turn the meter off.
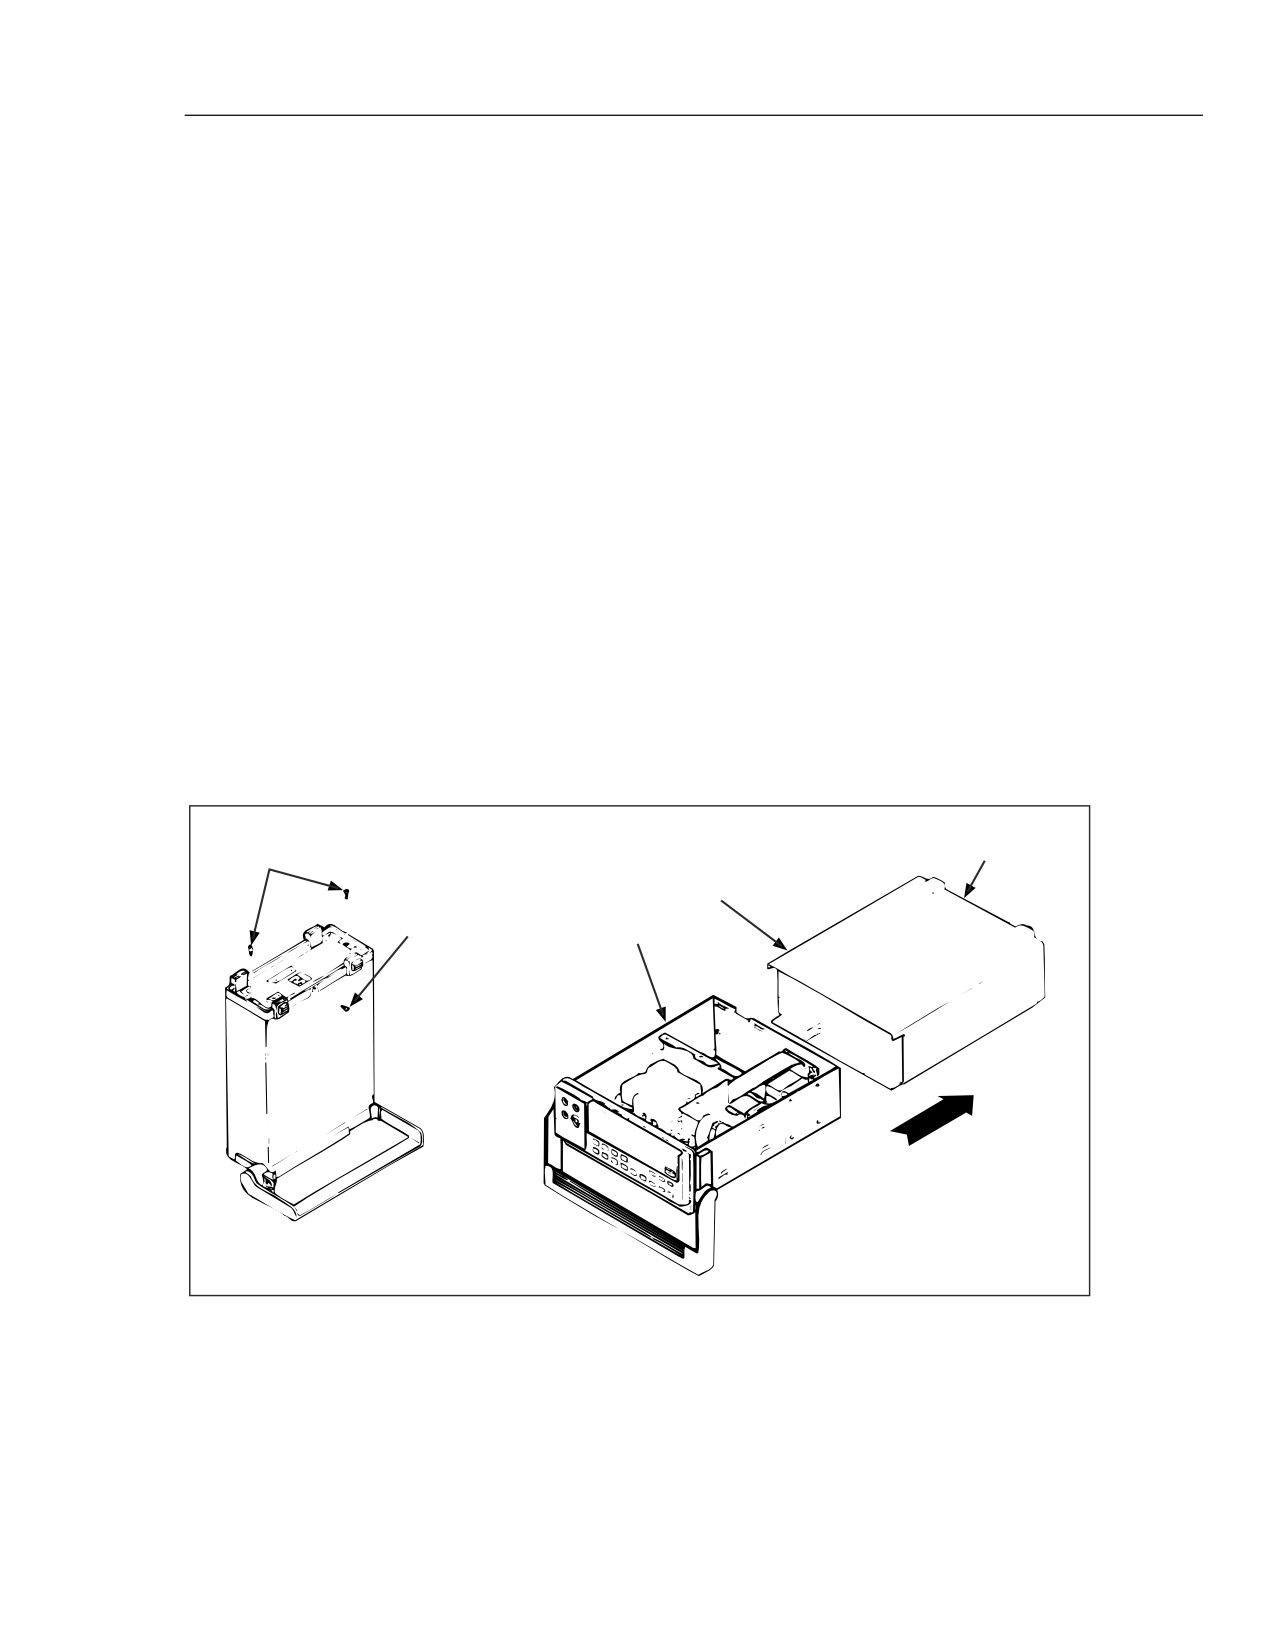
3. Remove the screw from the bottom of the case, and remove the two screws from the
rear bezel as shown in Figure 3-3 section A. While holding the front panel, slide the
case and rear bezel off the chassis. (See Figure 3-3 section B.) (At this point, the rear
bezel is not secured to the case.)
Caution
If the Main PCA is to be serviced and the Battery Option is
installed, first unplug the battery ribbon cable from the Main
PCA, or disconnect the wires to the battery. This measure
prevents damage to the meter when you are servicing the Fluke
45 Main PCA.
Rear Bezel
Mounting Screw (2)
Case
Grounding Screw (2)
Chassis
B.
A.
qb14f.eps
Figure 3-3. Removing the Case
3-16. Remove Handle and Mounting Brackets
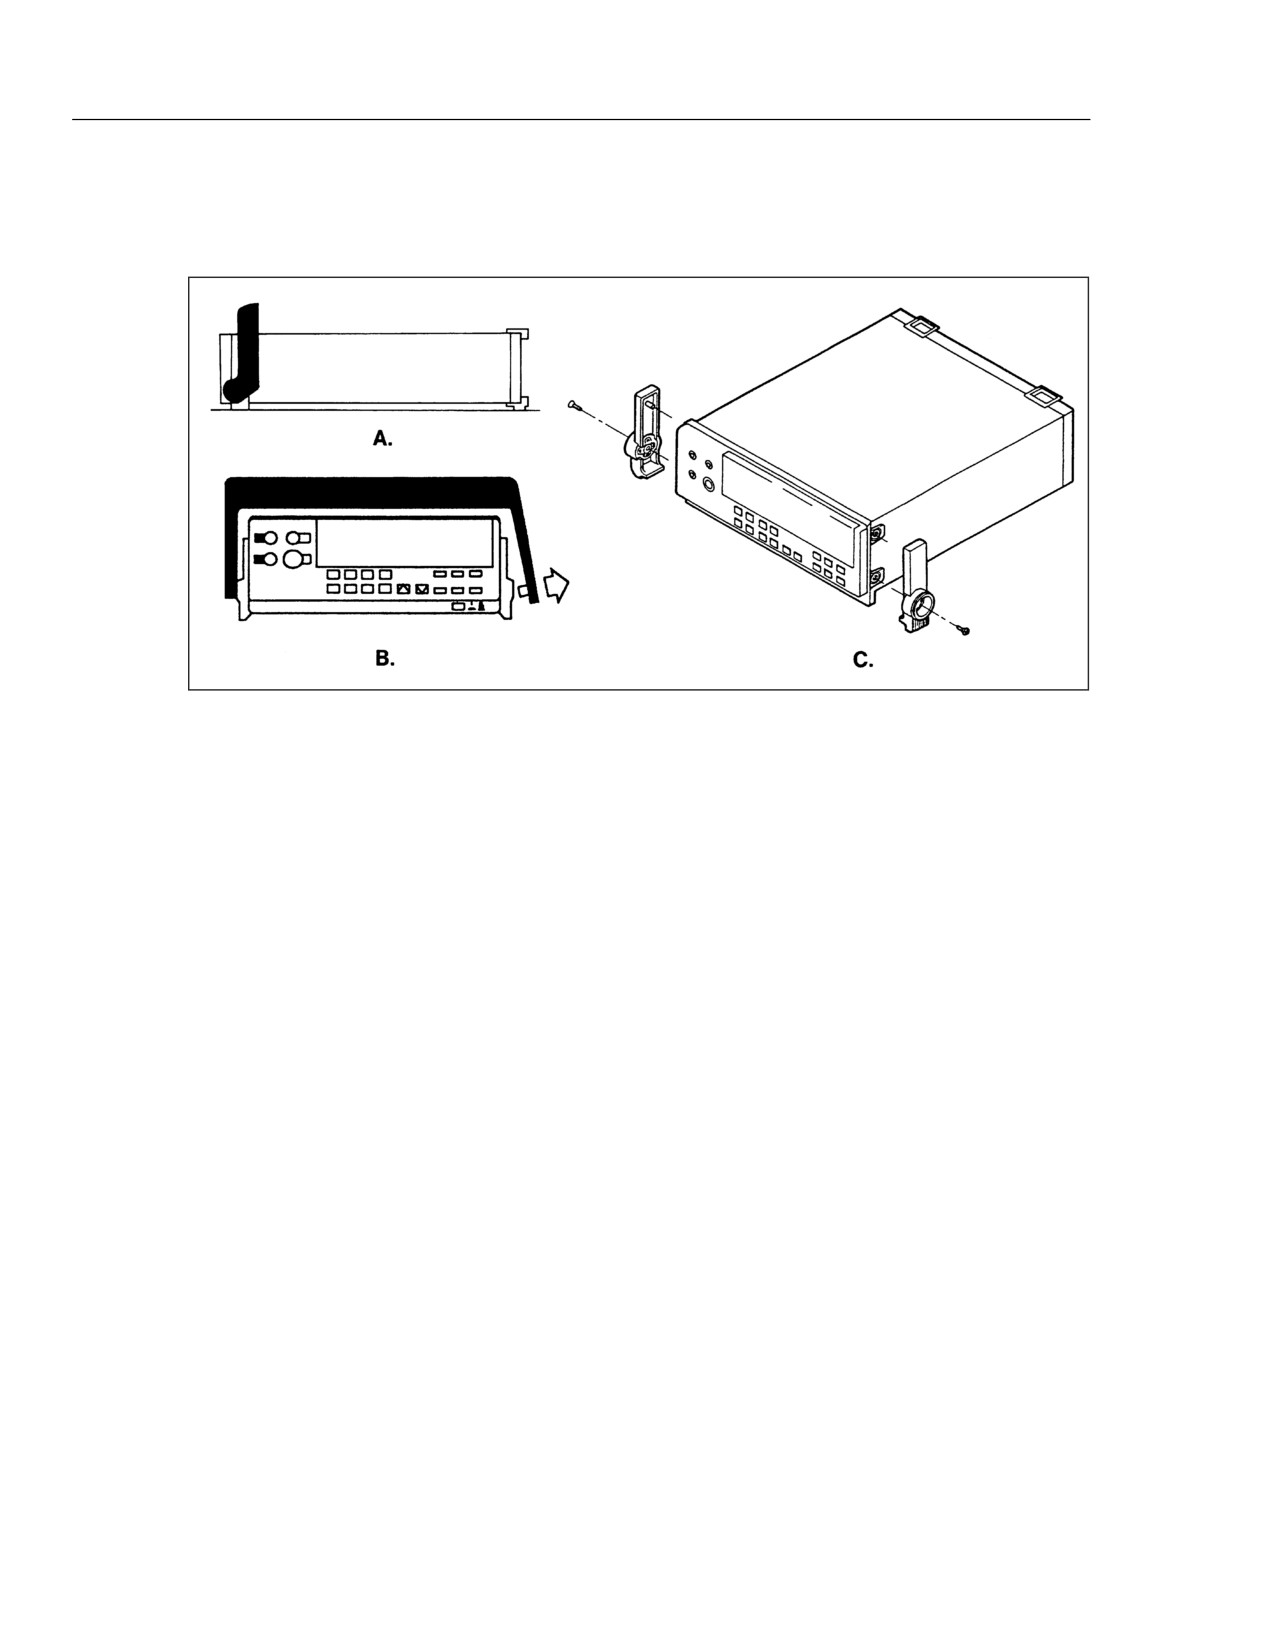
Refer to Figure 3-4 during this procedure. Pull each handle pivot out slightly at the
handle mounting brackets, then rotate the handle up over the display. With the handle
pointing straight up, pull out and disengage one pivot at a time.
3-7
45
Service Manual
Use a Phillips head screwdriver to remove the two handle mounting brackets. Note that
these brackets must be reinstalled in their original positions. Therefore, the inside of
each bracket is labeled with an "R" or an "L", referenced to the front view of the meter.
qb15c.eps
Figure 3-4. Removing the Handle and Handle Mounting Brackets
3-17.
Remove the Front Panel Assembly
Remove all leads connected to the input terminals. Then remove the front panel 100 mA
fuse. Using needle nose pliers, disconnect the wires at the rear of the
, [COM],
and [10 A] input terminals. At the rear of the [100 mA] terminal, carefully dislodge and
withdraw the spring (attached to the white wire) from the fuse holder.
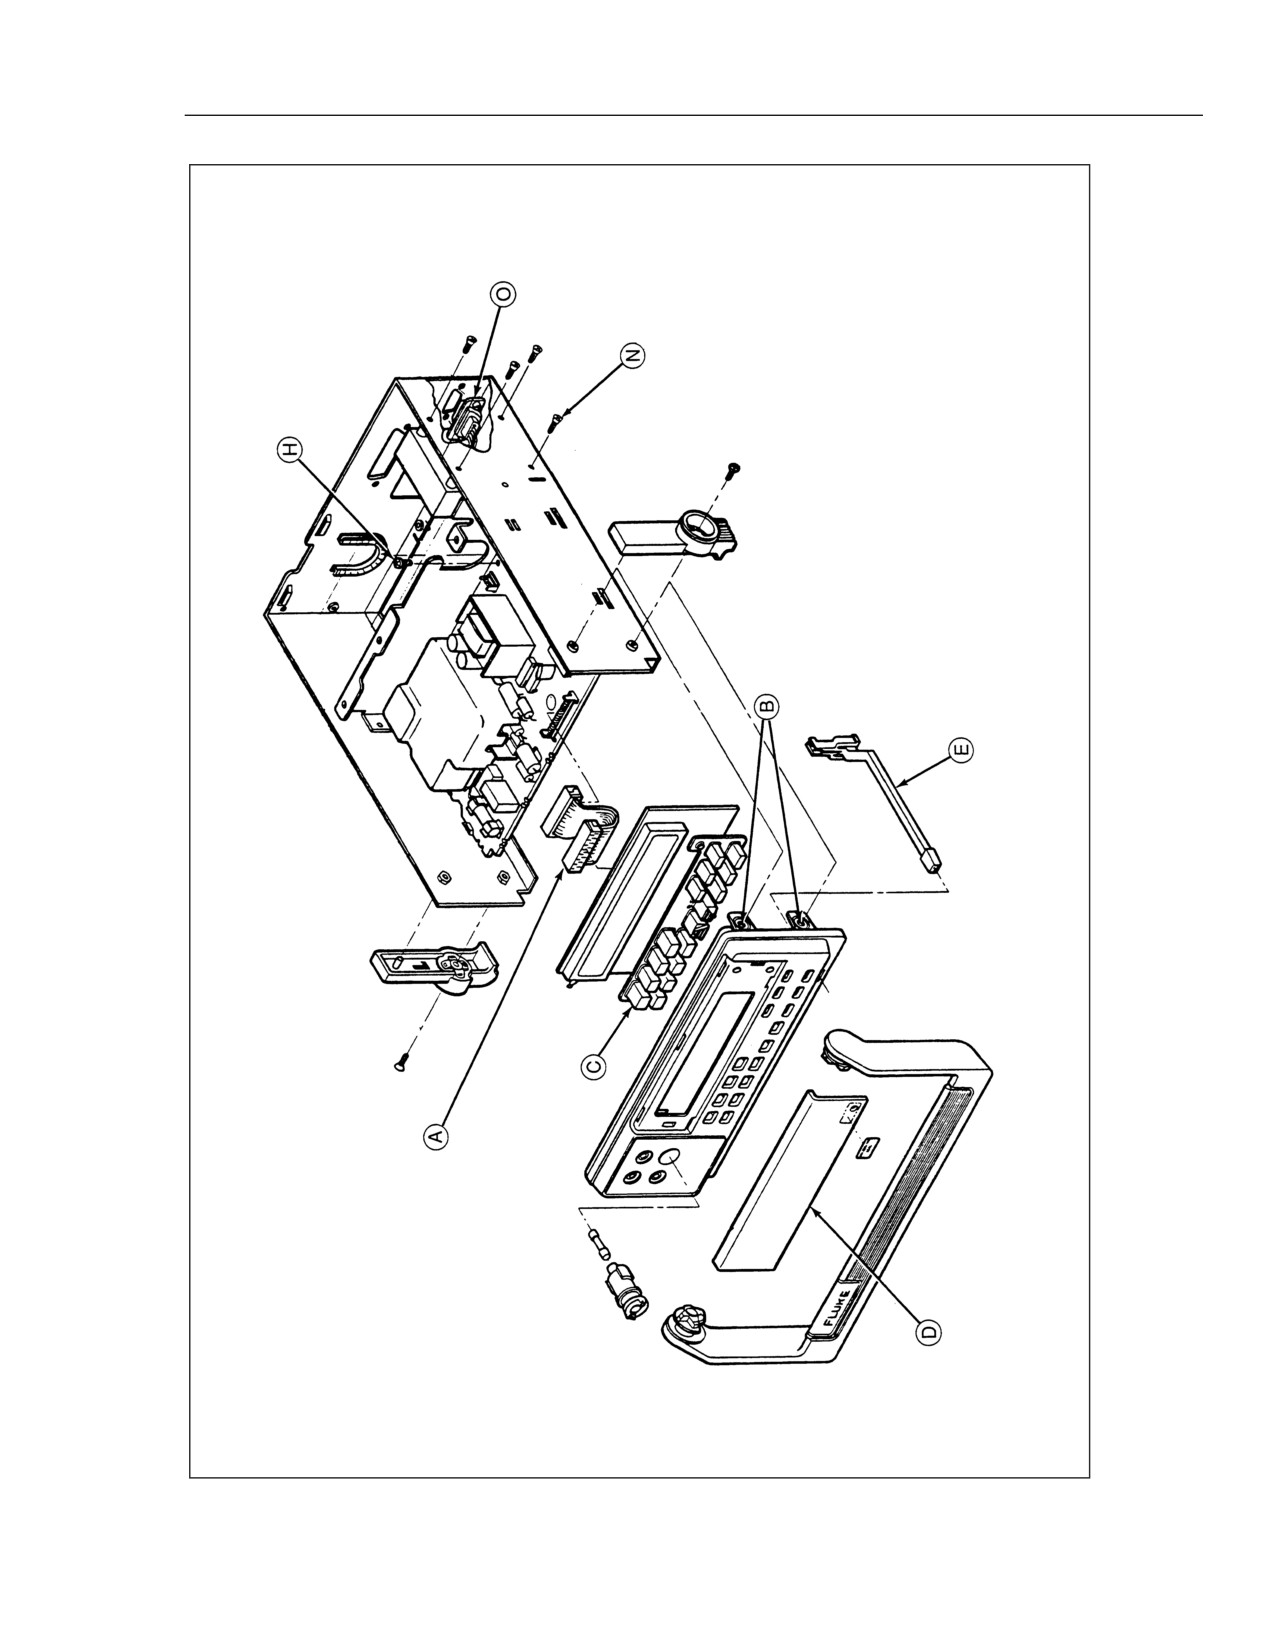
Locate the display ribbon cable connector on the Main PCA ("A" in Figure 3-5.) Using
needle nose pliers, disconnect this cable by alternately pulling up on each end of its
connector. Avoid breaking the alignment tabs on the Main PCA half of this connection.
Now remove the Front Panel Assembly by releasing the four snap retainers ("B" in
Figure 3-5) securing it to the chassis.
3-18.
Remove the Display PCA
The Display PCA is held in place with a set of tabs around its periphery. In sequence,
release the tabs along the top, left side, and right side. Then slide the pca up and out,
away from the bottom tabs.
Note
The Display PCA provides a space for a center securing screw. If the
peripheral tabs are intact, this screw is not necessary. If some of the tabs
are broken, the screw can be used as an additional securing device.
The elastomeric Keypad Assembly ("C" on Figure 3-5) can now be lifted away from the
Front Panel Assembly.
Remove the display window ("D" on Figure 3-5) by releasing the two snaps along its
inside, bottom edge. Use a gentle levering action between each snap and an adjacent
edge on the Display Assembly.
3-8
General Maintenance
Disassembly Procedures
3
Caution
Avoid using ammonia or methyl-alcohol cleaning agents on
either the Front Panel of the display window. These types of
cleaners can damage surface features and markings. Use an
isopropyl-based cleaning agent or water to clean the Front
Panel and the display window.
3-19.
Remove the IEEE-488 Option
Chapter 8 of this manual provides a detailed removal procedure for the IEEE-488 option.
The following removal instructions provide the essentials of this procedure. If necessary,
refer to the complete procedure in Chapter 8, paying particular attention to Figures 8-2
and 8-3.
1. Use needle nose pliers to disconnect the 24-line cable assembly at the IEEE-488
PCA. Alternately pull on each end of the cable connector.
2. Remove the panhead Phillips screw at the rear of the IEEE-488 PCA.
3. Use needle nose pliers to detach the two ribbon cables at the front of the IEEE-488
PCA. Alternately pull on each end of the cable connector. Do not remove these
cables at their Main PCA connections.
Note
The IEEE-488 ribbon cables are not interchangeable with the Display
Assembly ribbon cable. Connectors on these cables are aligned
differently, allowing for proper cable routing.
4. Remove the IEEE-488 PCA, disengaging the board from both the small slot in the
side of the meter chassis and the plastic standoff at the front corner of the board.
3-20.
Remove the Main PCA
With the IEEE-488 option and the Display Assembly removed, the Main PCA can be
removed with the following procedure:
1. Remove the power switch activator rod ("E" in Figure 3-5) from the bottom of the
Main PCA.
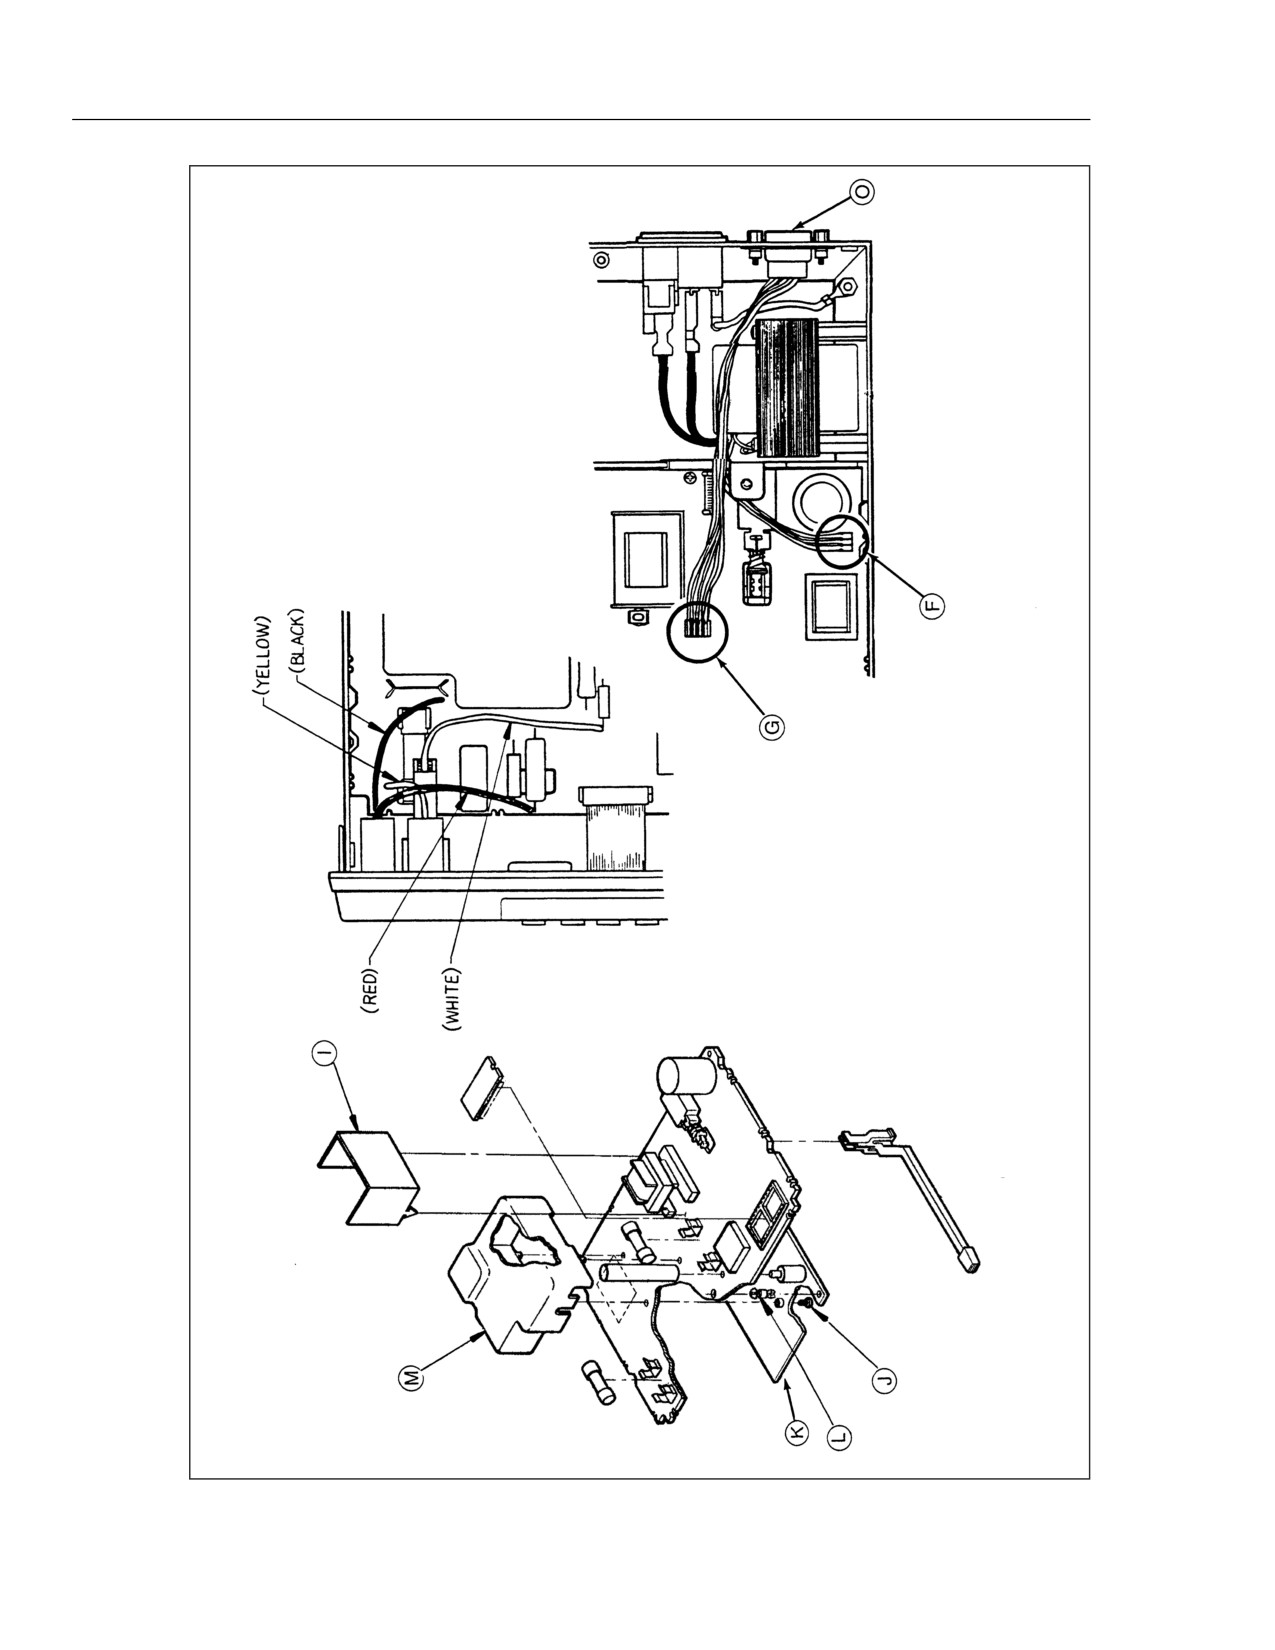
2. Detach the transformer connector (right rear corner of the Main PCA, "F" in Figure
3-5) and the RS-232 connector (center of the Main PCA, "G" in Figure 3-5.) If the
Battery Option is installed, detach its connector at the center-rear of the Main PCA.
3. Now remove the securing screw (near the battery connector, "H" in Figure 3-5), and
slide the Main PCA forward. Match the pca edge indentations to the guide tabs on
each chassis side, then lift the Main PCA up and away from the chassis.
To remove the transformer insulator (center rear of the Main PCA, "I" in Figure 3-5),
detach the two tabs and pull up.
3-21.
Remove the Analog Measurement Processor Shields
The Analog Measurement Processor resides within a plastic shield on the top of the
Main PCA. Although having the appearance of a dark gray piece of plastic, this shield is
electrically conductive; treat it as you would any other conducting surface. On the
bottom of the Main PCA, the Analog Measurement Processor is protected with a
metallic shield. Access the Analog Measurement Processor with the following
procedure:
3-9
45
Service Manual
• Working from the bottom of the Main PCA, remove the single Phillips head screw
("J" in Figure 3-6) securing the metallic shield, then lift the plastic shield ("M")
away from the top of the Main PCA.
• If necessary, remove the metallic shield ("K".) Avoid contacting any circuit traces
during this procedure. First rotate the shield toward the pca edge, then pry the shield
free from its nylon standoff ("L").
3-22.
Remove the Rms PCA
The rms pca is soldered in place on the Main PCA (within the Analog Measurement
Processor shield.) For access procedures, refer to "Remove the Analog Measurement
Processor Shields". Use standard desoldering techniques (e.g. solder sucker or solder
wick) when removing this assembly.
3-23.
Remove the Battery Option
Use the following procedure to remove the Battery Option. Refer to Figures 7-2 and 7-3
(Chapter 7) to identify features and techniques mentioned here. If necessary, refer to
Chapter 7 for a detailed description of Battery Option removal.
1. Disconnect the flat white battery option connecting cable at the Battery Option PCA.
2. Remove the two #6-32 x 1/4" panhead Phillips screws securing the Battery Option.
3. Carefully slide the Battery Option out of the meter. Do not pinch the wires running
from the pca to the battery terminals.
3-24.
Disconnect Miscellaneous Chassis Components
The following procedures can be used to disconnect remaining hardware from the
chassis:
1. Use needle nose pliers to remove the internal connections at the line power plug.
2. Remove the power plug by releasing its two snaps, one at a time.
3. Disconnect the power transformer by removing the four screws ("N" in Figure 3-5)
that secure it to the right side of the chassis.
4. Remove the RS-232 connector ("O") on the rear of the chassis. Use a 3/16-inch nut
driver to loosen the connector securing hardware. Also, disconnect the ground wire
at its chassis connection.
5. Remove the IEEE connector.
3-25. Assembly Procedures
Generally, assembly procedures follow a reverse sequence of disassembly procedures.
As some differences do apply, assembly is described separately in the following
paragraphs. Begin assembly at the appropriate level, as defined by the heading.
References are made to items in Figure 3-5 for assembly details of standard meter parts.
3-26. Install Miscellaneous Chassis Components
Use the following procedure to replace any items that have been removed from the basic
chassis.
1. Install the IEEE connector on the rear of the chassis.
3-10
General Maintenance
Assembly Procedures
3
2. Replace the RS-232 connector ("O") on the rear of the chassis. Use a 3/16-inch nut
driver to tighten the connector hardware. Also, attach the ground wire at its chassis
connection.
3. Replace the power transformer along the right side of the chassis. Use four 6-32 x
.25 FHU screws ("N"), inserted from the exterior of the meter.
4. Snap the power plug into position.
5. Use needle nose pliers to replace the interior connections at the power plug.
3-27.
Install the Battery Option
Installation is fully described in both the instruction sheet supplied with the Battery
Option and in Chapter 7 of this manual. The following procedure presents installation
essentials. Figures 7-2 and 7-3 can be used in identifying features and techniques
mentioned here.
1. Carefully slide the battery kit into the area reserved for it in the back of the meter.
Make sure that both the retaining slots line up and the mounting holes mate. Do not
pinch wires running from the circuit assembly to the battery terminals.
2. Secure the battery kit with two #6-32 x 1/4" panhead Phillips screws.
3. Attach the flat, white connecting cable at the Battery Option PCA. The single blue
marking line of the cable should be to the rear of the meter. Align the plastic socket
on the cable end, then seat it securely in place.
3-28.
Install the Rms PCA
With the Analog Measurement Processor shields removed, solder the Rms PCA into
place on the upper side of the Main PCA. The component side of the Rms PCA faces
forward.
3-29.
Install the Analog Measurement Processor Shields
The Analog Measurement Processor resides within a plastic shield on the top of the
Main PCA. Although having the appearance of a dark gray piece of plastic, this shield is
electrically conductive; treat it as you would any other conducting surface. On the
bottom of the Main PCA, the Analog Measurement Processor is protected with a
metallic shield.
Press the conductive plastic shield ("M") into place on the top of the Main PCA. From
the bottom of the Main PCA, install the metallic shield ("K".) Avoid contacting any
circuit traces during this procedure. Then replace the single Phillips head screw ("J")
securing the metallic shield.
3-30.
Install the Main PCA
1. Prior to installing the Main PCA, verify the following:
• If necessary, reinstall the transformer insulator ("I"), tabs down, around the right
side of the transformer. Once the insulator is in place, pull each tab through the
Main PCA from bottom side with a needle nose pliers.
• If the nylon standoff ("L") used between the Main PCA and the metallic shield
surrounding the Analog Measurement Processor has been removed, verify that
proper orientation is maintained during installation. The standoff end with the
shorter, beveled indent fits into the metallic shield. Press the standoff end with
the wider, straighter indent into the Main PCA with a 3/16 nut driver.
3-11
45
Service Manual
2. Ensure that the nylon standoff support (front-center of the Main PCA) is in place.
Then slide the Main PCA onto the chassis slider taps.
3. Fasten the Main PCA to the chassis with a 6-32, 1/4-inch panhead screw ("H").
4. Connect the transformer cable ("F") and RS-232 cable ("G") at the Main PCA.
3-31.
Install the IEEE-488 Option
Both the instruction sheet provided with the IEEE-488 Option and Chapter 8 of this
manual fully describe installation. The following instructions provide installation
procedure essentials. If necessary, refer to Chapter 8, paying particular attention to
Figures 8-2 and 8-3.
1. Check that the plastic standoff remains in the appropriate hole in the Main PCA
(narrow end of the standoff down.)
2. If necessary, install the two ribbon cables on the IEEE-488 circuit board. Each cable
fits in only one socket and in only one direction. Make sure the cables lock firmly in
place.
3. Attach opposite ends of the ribbon cables onto the Fluke 45 Main PCA.
4. Install the IEEE-488 PCA into the small slot in the side of the Fluke 45 (two ribbon
cables facing forward.) The end of the plastic standoff fits into the hole in the IEEE-
488 PCA. Make sure the IEEE-488 PCA is firmly gripped against the retainer on the
standoff and that the rear of the pca rests upon the support just forward of the
transformer.
5. Secure the rear of the IEEE-488 PCA with the panhead Phillips screw.
6. Connect the 24-line cable assembly to the IEEE-488 circuit board.
3-32.
Assemble the Front Panel Assembly
As appropriate, use the following steps to assemble the Front Panel Assembly.
1. Clean the lens ("D") with deionized air and, if necessary, isopropyl alcohol. Then
gently snap the lens into the front panel tabs.
2. Install the elastomeric keypad assembly ("C"). Make sure that the four front panel
guide pins protrude through the keypad.
3. On the Display PCA, clean the display with deionized air and, if necessary,
isopropyl alcohol.
4. Slide the Display PCA into the bottom securing tabs on the back of the Front Panel
Assembly. Then gently snap the pca into the remaining tabs along its periphery.
Note
The Display PCA provides a space for a center securing screw. If the
peripheral tabs are intact, this screw is not necessary. If some of the tabs
are broken, the screw can be used as an additional securing device.
5. Connect the 20-pin cable connector ("A") to the Display PCA.
3-12
General Maintenance
Assembly Procedures
3
qb16c.eps
Figure 3-5. Assembly Details
3-13
45
Service Manual
qb17c.eps
Figure 3-5. Assembly Details (cont)
3-14
General Maintenance
Assembly Procedures
3
3-33.
Install the Front Panel Assembly
Use the following procedure when installing the Front Panel Assembly:
1. Snap the Front Panel Assembly into place in the four tab retainers ("B").
2. Observing the alignment orientation provided by tabs on the connector, attach the
display ribbon cable connector ("A") on the Main PCA.
3. Attach the wires at the rear of the front panel input terminals. Observe the following
color coding:
• At the rear of the 100 mA input terminal, carefully insert the spring (attached to
the white wire) into the fuse holder.
• Using needle nose pliers, connect the wires at the rear of the input terminals as
follows:
Red
[COM] Black
[10 A]
Yellow
• Install the front panel 100 mA input fuse (F1).
3-34.
Install the Handle and Mounting Brackets
Refer to Figure 3-4 during the following procedure. Use a Phillips head screwdriver to
attach the two handle mounting brackets. Note that these brackets must be reinstalled in
their original positions. Therefore, the inside of each bracket is labeled with an "R" or an
"L", in reference to the front view of the meter.
Now, engage the handle. Point the handle straight up. Then pull out on each end of the
handle to engage the respective pivot in its bracket. Pull out slightly on both pivots to
rotate the handle to the desired position.
3-35.
Install the Meter Case
Reinstall the meter case, checking that it seats properly in the front panel. Attach the rear
bezel with the two panhead Phillips screws and secure the case with the flathead Phillips
screw in the bottom. Refer to Figure 3-3.
3-15
Chapter 4
Performance Testing and Calibration
Title
Page
4-1.
Introduction
4-3
4-2.
Required Equipment
4-3
4-3.
Performance Tests
4-4
4-4.
Front Panel Calibration
4-7
4-5.
Introduction
4-7
4-6.
Entering Calibration Mode
4-8
4-7.
Exiting Calibration Mode
4-9
4-8.
DC Volts Calibration (Front Panel)
4-9
4-9.
AC Volts Calibration (Front Panel)
4-9
4-10.
DC and AC Milliamp Calibration (Front Panel)
4-9
4-11.
DC and AC Amps Calibration (Front Panel)
4-11
4-12.
Ohms Calibration (Front Panel)
4-11
4-13.
Alternate Ohms Calibration (Front Panel)
4-13
4-14.
Continuity/Hysteresis Threshold Calibration (Front Panel)
4-13
4-15.
Frequency Calibration (Front Panel)
4-13
4-16.
C2 Adjustment Procedure
4-13
4-17.
Editing the Prompt for Different Calibration Points
4-14
4-18.
Calibration Using the Computer Interface
4-15
4-19.
Setup
4-15
4-20.
RS-232 Interface
4-15
4-21.
IEEE-488 Interface
4-16
4-22.
The Calibration Procedure
4-18
4-23.
DC Volts Calibration (Computer Interface)
4-19
4-24.
AC Volts Calibration (Computer Interface)
4-19
4-25.
DC and AC Milliamps Calibration (Computer Interface)
4-19
4-26.
DC and AC Amps Calibration (Computer Interface)
4-19
4-27.
Ohms Calibration (Computer Interface)
4-19
4-28.
Continuity/Hysteresis Threshold Calibration (Computer Interface)
4-20
4-29.
Frequency Calibration (Computer Interface)
4-20
4-30.
Concluding Calibration Using the Computer Interface
4-20
4-31.
Alternate Ohms Calibration (Computer Interface)
4-20
4-1
Performance Testing and Calibration
Introduction
4
4-1. Introduction
This chapter of the Service Manual provides performance tests that can be used at any
time to verify Fluke 45 operation within published specifications. A complete calibration
procedure is also included. The performance test and, if necessary, the calibration
procedure can be performed periodically and after service or repair.
4-2. Required Equipment
Equipment required for performance testing and calibration is listed in Table 4-1.
Table 4-1. Recommended Test Equipment
Instrument
Recommended
Minimum Specifications
Type
Model
Multifunction
DC Voltage:
Fluke 5700A
Calibrator
Range = 90 mV to 1000 V dc
with wideband
Accuracy = .005%
option
AC Voltage:
Frequency
Voltage
Accuracy
1 kHz
29 mV to 750 V
0.05%
100 kHz
15 mV to 300 mV
1.25%
AC Milliamps:
Frequency
Current
Accuracy
1 kHz
29 mA to 100 mA
0.125%
DC Milliamps:
Frequency
Voltage
Accuracy
10 kHz
1 V
0.125%
Boost
DC Amps:
Current
Accuracy
Fluke 5725A
Amplifier
10 A
.05%
AC Amps:
1 kHz
2A and 10 A
0.25%
Decade
General
Resistance
Ohms
Accuracy
Resistance Inc.
Source
Model RDS 66A
290 Ω
0.0125%
2.9 kΩ
0.0125%
29 kΩ
0.0125%
290 kΩ
0.0125%
2.9 MΩ
0.0125%
Note
The 5700A Calibrator can be used for 0.05% accuracy (rated) on the
3.0 kΩ, 30 kΩ, 300 kΩ, and 3.0 MΩ ranges. This calibrator can be used
for 0.06% accuracy on the 100 Ω and 300 Ω ranges.
4-3
45
Service Manual
4-3.
Performance Tests
The following performance tests are provided to ensure that the meter is in proper
operating condition. If the meter fails any of the performance tests, calibration
adjustment and/or repair is needed. To perform these tests, you will need a Fluke 5700A
Multifunction Calibrator and a 5725A Amplifier or equipment meeting the minimum
specifications given in Table 4-1.
Each of the measurements listed in the following steps assumes the meter is being tested
after a one-hour warmup in an environment with an ambient temperature of 18 to 28ºC
and a relative humidity of less than 90% (70% for MΩ ranges). The limits in Table 4-2
represent the 1-year calibration cycle.
Note
All measurements listed in the performance test tables are made in the
medium reading rate unless otherwise noted.
1. Power up the meter and allow it to stabilize for one hour.
2. Connect a cable from the Output VA HI and LO connectors of the 5700A to the
and COM connectors on the Fluke 45. Select the function and range on the
Fluke 45 and the input level from the 5700A using the values listed in Table 4-2. The
display should read between the minimum and maximum values listed in the table.
3. Connect a cable from the Output VA HI and LO connectors of the 5700A to the
[100 mA] and COM connectors on the Fluke 45. Select the function and range on the
Fluke 45 and the input level from the 5700A using the values contained in Table 4-3.
The display should read between the minimum and maximum readings listed in the
table.
4. The following tests require a Fluke 5725A Amplifier (or equivalent) to be used with
the 5700A. The input level for the performance test will be set on the 5700A but will
be output from the 5725A Amplifier.
Connect a cable from the Output VA HI and LO connectors of the 5725A to the [10 A]
and COM connectors on the Fluke 45. Select the function and range on the Fluke 45 and
the input level from the 5700A using the values contained in Table 4-4. The display
should read between the minimum and maximum readings listed in the table.
4-4

Performance Testing and Calibration
Performance Tests
4
Table 4-2. Performance Tests for Volts, Diode Test, Ohms, and Frequency Functions
Function
Range (Rate)***
Input Level
Frequency
Display
Min
Max
100 mV (slow)
short
-
-0.006
0.006
90 mV
-
89.971
90.029
1000 mV (slow)
900 mV
-
899.71
900.29
300 mV
short
-
-0.02
0.02
300 mV
-
299.90
300.10
3 V
-3 V
-
-3.0010
-2.9990
30 V
-30 V
-
-30.010
-29.990
300 V
-300 V
-
-300.10
-299.90
1000 V
-1000 V
-
-1000.5
-999.5
30 V
30 V
-
29.990
30.010
300 V
300 V
-
299.90
300.10
1000 V
1000 V
-
999.5
1000.5
-
short
-
-0.0008
0.0008
(tone)
(tone)
-
open
-
OL
OL
300 mV
short
-
<0.75
15 mV
1 kHz
14.87
15.13
100 kHz
13.75
16.25
300 mV
1 kHz
299.30
300.70
100 kHz
284.50
315.50
3 V
3.0 V
1 kHz
2.9930
3.0070
30 V
30 V
1 kHz
29.930
30.070
300 V
300 V
1 kHz
299.30
300.70
750 V
750 V
1 kHz
747.5
752.5
Using decades of 3:
300 Ω*
short
0.00
0.04
300 Ω
299.83
300.19
3 kΩ*
short
0.000
0.0002
3 kΩ
2.9983
3.0017
30 kΩ
30 kΩ
29.983
30.017
300 kΩ
300 kΩ
299.83
300.17
3 MΩ
3 MΩ
2.9980
3.0020
30 MΩ**
30 MΩ
29.922
30.078
300 MΩ
300 MΩ
294.0
306.0
Using decades of 1.9:
300 Ω*
short
0.00
0.04
190 Ω
189.88
190.14
4-5
45
Service Manual
Table 4-2. Performance Tests for Volts, Diode Test, Ohms, and Frequency Functions (cont)
Function
Range (Rate)***
Input
Frequency
Display
Level
Min
Max
3k Ω*
short
0.0000
0.0002
1.9 kΩ
1.8988
1.9012
30 kΩ
19 kΩ
18.988
19.012
300 kΩ
190 kΩ
189.88
190.12
3 MΩ
1.9 MΩ
1.8987
1.9013
30 MΩ**
19 MΩ
18.949
19.051
300 MΩ**
190 MΩ
186.2
193.8
Using decades of 1.0:
300 Ω*
short
0.00
0.04
100 Ω
99.93
100.09
3 kΩ
short
0.0000
0.0002
1 kΩ
0.9993
1.0007
30 kΩ
10 kΩ
9.993
10.007
300 kΩ
100 kΩ
99.93
100.07
3 MΩ
1 MΩ
0.9992
1.0008
30 MΩ**
10 MΩ
9.972
10.028
300 MΩ**
100 MΩ
98.0
102.0
10/100 kHz
0.1 to 10 V
10 kHz
9.994
10.006
* Use either 2-wire compensation on the 5700A or the relative (REL) mode on the 45.
** Optional test points that can be used if standards are available.
*** All measurement rates are in medium speed unless otherwise specified.
4-6
Performance Testing and Calibration
4
Table 4-3. Performance Tests for mA Current Functions
Function
Range (Rate)
Input Level
Frequency
Display
Min
Max
(mA)
30 mA
+30 mA
-
29.982
30.018
100 mA
+100 mA
-
99.93
100.07
(mA)
30 mA
30 mA
1 kHz
29.840
30.160
100 mA
100 mA
1 kHz
99.40
100.60
Table 4-4. Performance Tests for Current Functions
Function
Range (Rate)
Input Level
Frequency
Display
Min
Max
10 A
+10 A
-
9.975
10.025
10 A
10 A
1 kHz
9.890
10.110
4-4.
Front Panel Calibration
The Fluke 45 features closed-case calibration using known reference sources. The
multimeter automatically prompts you for the required reference sources, measures
them, calculates correction factors, and stores the correction factors in the nonvolatile
calibration memory.
Closed-case calibration has many advantages. There are no parts to disassemble, no
mechanical adjustments to make, and the Fluke 45 can be calibrated by an automated
instrumentation system.
The Fluke 45 should normally be calibrated on a regular cycle, typically every 180 days
or 1 year. The chosen calibration cycle depends on the accuracy specification you wish
to maintain. The Fluke 45 should also be calibrated if it fails the performance test or has
undergone repair. To meet the specifications in Chapter 1, the Fluke 45 should be
calibrated with equipment meeting the minimum specifications given in Table 4-1.
The following paragraphs first present a basic calibration procedure for use with front
panel control. This is followed by a description of editing prompts for different
calibration points, then by a description of calibration using the IEEE-488 or RS-232
computer interface.
4-5.
Introduction
The basic calibration consists of sets of steps for DC Volts, AC Volts, DC and AC
Milliamps, DC and AC Amps, Ohms, Continuity/Hysteresis Threshold, and Frequency.
Normally, it is recommended that the entire calibration procedure be performed.
However, it is possible to calibrate any function individually. This might be useful
during troubleshooting, when looking for a problem in a specific function. Whenever the
VDC function is calibrated, the entire calibration procedure for all functions should be
performed. Any function except VDC can be calibrated independently without affecting
calibration of another function.
If calibration of any function is discontinued prior to completion, no changes are made to
nonvolatile calibration memory for that function.
Some calibration steps take longer to execute than others. When the Fluke 45 is
executing a calibration step, it ignores all of the front panel buttons and postpones
execution of all computer interface commands.
4-7
45
Service Manual
4-6.
Entering Calibration Mode
Always begin the calibration procedure as follows:
1. Allow the Fluke 45 to stabilize in an environment with ambient temperature of 18 to
28ºC and relative humidity of less than 70%. Then turn the Fluke 45 on, and allow it
to warm up for at least 1 hour.
2. The Cal Enable button is located on the right side of the display and is recessed
beneath a calibration seal. Enable the calibration mode by pressing the Cal Enable
button for about three seconds (CAL appears in secondary display.) Use a small
screwdriver or equivalent blunt-tipped object. Avoid using sharper-tipped objects
(such as pencils).
When the calibration mode is enabled, the unit first beeps, then displays VDC CAL.
From this point the calibration menu can be scrolled to a specific function using the
and
editor buttons. To display the first prompt for the selected calibration function
press the
button. In the calibration mode, most buttons are disabled; only the
,
, and
edit buttons and the Cal Enable button remain active. These buttons are
described more fully as follows:
1. Cal Enable button: Enables the calibration mode when pressed for 3 seconds. Exits
the calibration mode when pressed momentarily.
2.
Editor buttons: Used to scroll to the desired calibration function in the
calibration menu or to edit the displayed calibration prompt.
• Once calibration mode has been entered, the calibration menu appears in the
following sequence:
VDC
VAC mA DC mA AC A DC A AC Ω
Hz
The menu does not wrap; going from Hz back to V DC can only be accomplished by
successively pressing the
button.
• Once
has been pressed to initiate calibration prompting, press either
or
once initially to enter the editor mode. Then use these buttons to edit the
calibration prompt value.
The calibration prompt value can be edited by digit. Use
to select the digit
to edit. Use
to increment the selected digit. To select a lower digit value,
continue incrementing with
; the meter wraps from 9 back to 0. Press
when the edited value is correct.
3.
button: Used to select a calibration function, calibrate (store constants derived
from input source into memory), or exit editor mode.
Each time the Fluke 45 prompts you for a reference source, apply the requested source to
the appropriate input and COM terminals, allow for both calibrator and meter settling
time, and press the
button. When
is pressed, the numeric display field blanks
while the Fluke 45 performs the necessary calculations. (Do Not change the reference
source while the display is blank.) If the calibration step is successful, the Fluke 45
displays an intensified reading equal to the calibration prompt value before changing to
the next prompt.
Note
The meter emits a beep and displays ’Error’ if a calibration step fails.
Usually, this happens if the reference is not within an anticipated range (5
to 15%, depending on the step.) At this point, the intensified reading equals
the raw uncalibrated reading taken on the reference input. Refer to
Calibration Failures in Chapter 5 for more information.
4-8
Performance Testing and Calibration
Front Panel Calibration
4
4-7.
Exiting Calibration Mode
Calibration mode can be exited at any time by pressing the Cal Enable button. However,
if this button is pressed prior to completion of all calibration points for any function, no
changes are made to nonvolatile calibration memory for that function.
If calibration mode is exited after completion of calibration of any function except VDC,
constants for other functions are not affected. But remember, whenever VDC is
calibrated, the calibration procedure for all other functions should be performed.
To exit the calibration mode, press the Cal Enable button with a small screwdriver or
equivalent blunt-tipped object. Avoid using sharper-tipped objects (such as pencils).
4-8.
DC Volts Calibration (Front Panel)
To perform VDC calibration, proceed as follows:
1. Press the Cal Enable button for 3 seconds to enter the calibration mode. Or, if the
meter is already in calibration mode, but set for a different type of calibration, press
the
button to return to VDC calibration.
2. Press the
button to select the first prompt (0.000 mV DC) for the VDC
function.
3. Apply a shorting bar to the
and COM inputs of the meter and allow 5
seconds for meter settling.
Note
After voltage is applied to the
input, the meter can take up to 4
minutes to settle to zero within one microvolt once the voltage is removed.
For this reason, no voltage should be applied to the input for 4 minutes
before doing zero mV cal.
4. Push the
button to calibrate the meter zero mV calibration point.
5. Remove the short and connect the dc volts source to the
and COM inputs of
the meter.
6. Complete calibration steps 2 through 10 in Table 4-5.
4-9.
AC Volts Calibration (Front Panel)
To perform ac volts calibration, proceed as follows:
1. If the meter is already in calibration mode, press the
or
button to select
VAC calibration. Otherwise, select calibration mode first (press Cal Enable button
for three seconds), then select VAC calibration by pressing the
button once.
2. Connect the ac source to the
and COM inputs of the meter.
3. For each of steps 11 through 17 (Table 4-5), apply the source output indicated and
calibrate the meter by pressing the
button.
4-10.
DC and AC Milliamp Calibration (Front Panel)
Perform the dc and ac milliamps calibration as follows:
1. If the meter is already in calibration mode, press the
or
button to select
mA DC calibration. Otherwise, select calibration mode first (press Cal Enable button
for three seconds), then select mA DC calibration by pressing the
button twice.
2. Connect the dc milliamps source to the [100 mA] and COM inputs.
3. Apply the dc milliamp outputs indicated in Table 4-5 (steps 18 and 19), and calibrate
the meter with the
button.
4. Press the
button to select mA AC calibration.
4-9
45
Service Manual
5. Connect the ac milliamps source to the [100 mA] and COM inputs.
6. Apply the ac milliamp outputs indicated in Table 4-5 (steps 20 and 21), and
calibrating each step by pressing the
button.
Table 4-5. Front Panel Calibration
Note
Before proceeding, allow for settling time of at least 30 seconds with no
input applied.
Step
Meter Cal Prompt
Source Input
Meter Settling Time
Before Pressing
DC Volts Calibration
0.000 mV DC
short
5 s
1
90.000 mV DC
90 mV dc
2 s
2
-90.000 mV DC
-90 mV dc
2 s
3
900.00 mV DC
900 mV dc
2 s
4
90.000 mV DC
90 mV dc
5 s
5
290.00 mV DC
290 mV dc
1 s
6
2.9000 V DC
2.9 V dc
1 s
7
29.000 V DC
29 V dc
1 s
8
290.00 V DC
290 V dc
1 s
9
1000.0 V DC
1000 V dc
1 s
10
Note
Settling times mentioned here assume that steps 1 through 32 are followed
in sequence. If you have just calibrated dc volts (steps 1 through 10), but
do not follow the subsequent sequence, a special settling period of 4
minutes may be required due to dielectric absorption caused by the 1000 V
dc input in step 10. Examples of this requirement include re-checking dc
volts calibration (going from step 10 back to step 1) or skipping to ohms
calibration (going from step 10 to step 25.)
AC Volts Calibration
11
29.000 mV AC
29 mV 1 kHz
3 s
12
290.00 mV AC
290 mV 1 kHz
3 s
13
0.2900 V AC
290 mV 1 kHz
3 s
14
2.9000 V AC
2.9 V 1 kHz
3 s
15
29.000 V AC
29 V 1 kHz
3 s
16
290.00 V AC
290 V 1 kHz
3 s
17
750.00 V AC
750 V 1 kHz
3 s
DC Milliamps Calibration
18
29.000 mA DC
29 mA dc
1 s
19
100.00 mA DC
100 mA dc
1 s
AC Milliamp Calibration
20
29.000 mA AC
29 mA 1 kHz
3 s
21
100.00 mA AC
100 mA 1 kHz
3 s
DC and AC Amps Calibration
22
10.000 A DC
10 A DC
3 s
23
2.000 A AC
2 A 1 kHz
5 s
24
10.000 A AC
10 A 1 kHz
5 s
4-10
Performance Testing and Calibration
Front Panel Calibration
4
Table 4-5. Front Panel Calibration (cont)
Ohms Calibration
Step
Initial Meter Cal
5700A Source
Edit Meter Cal Prompt
Meter Settling Time
Prompt
Output
To:
Before Pressing
25
290.00 Ω
190 Ω*
5700A Display
1 s
26
2.9000 kΩ
1.9 kΩ
"
1 s
27
29.000 kΩ
19 kΩ
"
2 s
28**
290.00 kΩ
190 kΩ
"
3 s
29**
2.9000 MΩ
1.9 MΩ
"
3 s
Continuity/Hysteresis Threshold Calibration
Step
Meter Cal
Source Output
Meter Settling Time Before Pressing
Prompt
30
0.000 V
0.000 mV
1 s
31
0.020 V
20.00 mV
1 s
Frequency Calibration
32
2.000 V p-p
10 kHz
2 s
* A 190 Ω source calibrates the 300 Ω range on the Fluke 45 to 0.06%+2 digits +0.02 Ω. For calibration of
this range to 0.05%+2 digits +0.02 Ω, use a 290 Ω source and the procedure detailed under Alternate
Ohms Calibration (Front Panel). This procedure can also be used with appropriate discrete resistor
values (such as a decade box) on all ranges.
** Note that the 300 kΩ and 3 MΩ ranges are quite sensitive to noise. Any movement of the input leads
or movement of the hands or body in the vicinity of the leads can cause noisy readings. This causes an
error in the calibration if the
button is pushed during a bad reading. To avoid this, use shielded
leads during this calibration and hold very steady for several seconds with your index finger resting on
the
button before pressing it. These two cal points should be verified for accuracy at the
conclusion of calibration.
4-11. DC and AC Amps Calibration (Front Panel)
The dc and ac amps calibration requires a boost amplifier or transconductance amplifier
capable of 10 A output at both dc and 1 kHz.
1. If the meter is already in calibration mode, press the
or
button to select A
DC calibration. Otherwise, select calibration mode first (press Cal Enable button for
three seconds), then select A DC calibration by pressing the
button four times.
2. Connect the output of the boost amplifier to the [10 A] and COM inputs of the
meter.
3. Apply the dc amp output indicated in Table 4-5 (step 22), and calibrate using the
button.
4. Select A AC calibration on the meter by pressing the
button once.
5. Apply the two ac amp outputs called for in steps 23 and 24 of Table 4-5, calibrating
each step by using the
button.
4-12. Ohms Calibration (Front Panel)
If you do not have the value resistors (290 Ω, 2.9 kΩ, 29 kΩ, etc.) required by the Fluke
45 calibration prompts, the requested value (prompt) must be edited to the value
available. (See "Editing the Prompt for Different Calibration Points", later in this
4-11
45
Service Manual
chapter.) In the following procedure, the Fluke 5700A Multifunction Calibrator is used
as the ohms source, with input values of 190 Ω, 1.9 kΩ, 19 kΩ, 190 kΩ, and 1.9 MΩ.
1. If the meter is already in calibration mode, press the
or
button to select Ω
calibration. Otherwise, select calibration mode first (press Cal Enable button for
three seconds), then select Ω calibration by pressing the
button six times.
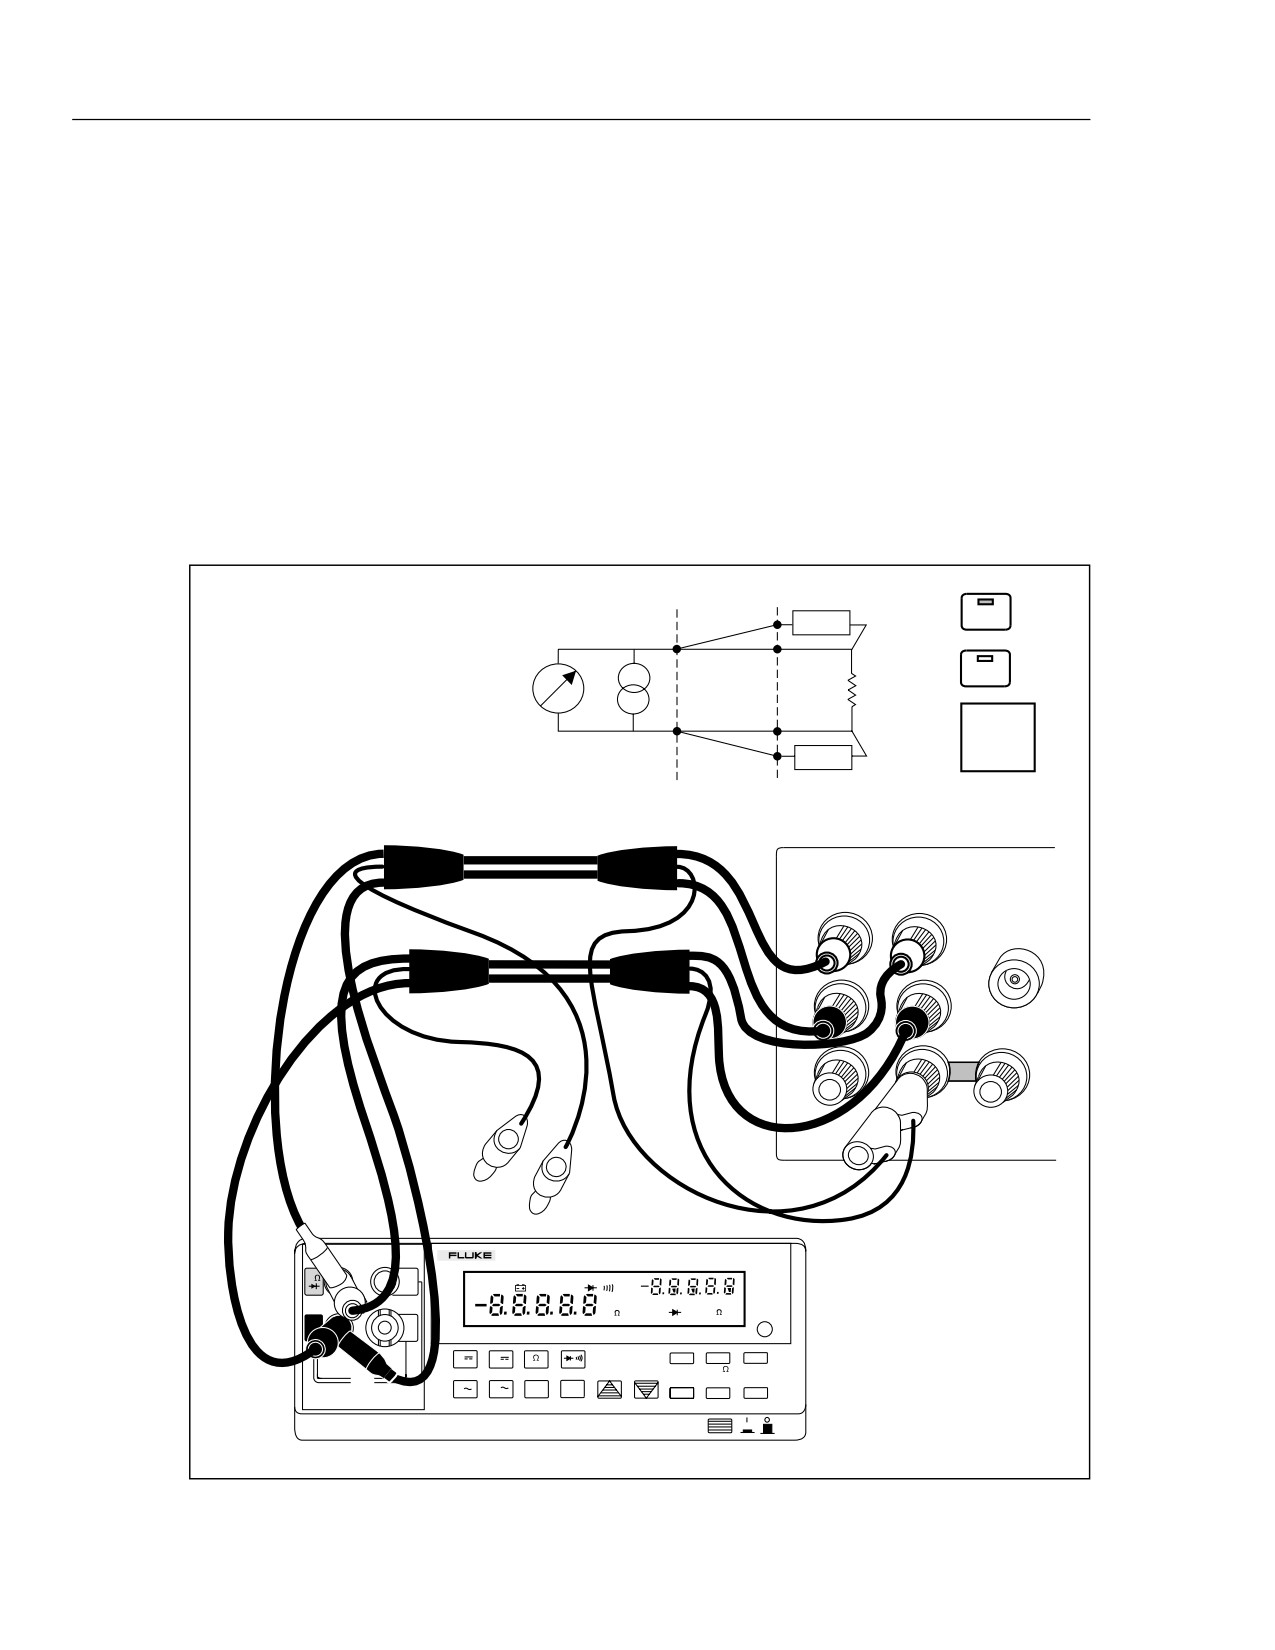
2. Connect the ohms source to the meter in a four-wire configuration. Refer to Figure
4-1.
3. On the 5700A, select 2-wire compensation ON, with external sense. Then program
the 5700A for the output in step 25 of Table 4-5.
4. Edit the meter prompt display to read the same value as the 5700A output display.
5. On the meter, press the
button to calibrate this step. Then continue with steps
26 through 29 in Table 4-5.
CAUTION
: ON
COMP
EX SNS
USE CONNECTIONS WITH
EXPOSED PLUG TIPS FOR
: OFF
EX GRD
THE OHMS FUNCTION ONLY.
UUT
5700A
2-WIRE
COMP
COMP
ON
5700A
OUTPUT
SENSE
V Ω A
V
Ω
WIDEBAND
HI
HI
LO
LO
HI
AUX
GUARD GROUND
CURRENT
NC
NC
45 DUAL DISPLAY MULTIMETER
V
10A
REMOTE
SMF MAX dB REL AUTO
EXT TRG
MIN HOLD
600V
mA
mVDCAC
UNCAL mA
mV
DC AC
CAL
1000V CAT
Mk Hz
Mk Hz
ENABLE
COM
mA
100
FUSE F1
V
REL
dB
2ND
500 mA
A
F 250V
REF#
REF
LOCAL
FUSED
V
A
FREQ
AUTO
HOLD
MN MX
RATE
COMP
HI
LO THRESH
ADDR
BAUD
POWER
qb18f.eps
Figure 4-1. Four-Wire Configuration
4-12
Performance Testing and Calibration
Front Panel Calibration
4
4-13.
Alternate Ohms Calibration (Front Panel)
The following procedure can be used with discrete resistor values (such as a decade
box). On the 300 Ω range, this alternate procedure uses a 290 Ω source and yields a
specification of 0.05%+2 digits +0.02 Ω. Alternate calibration of this range is detailed
below, although discrete resistor values can be used for all ranges. Lead and source zero
resistances are only taken into account for the lowest two ranges (300 Ω and 3 kΩ).
1. Connect the ohms source to the meter. Apply zero ohms.
2. Measure and record the residual lead and source zero resistance on the 300Ω range.
3. Add the value from the lead and source zero resistance from step 2 above to the
certified value of the source resistor.
4. Set the meter to the calibration mode (press the Cal Enable button.) Select ohms
calibration.
5. Using the editor buttons, edit the meter display prompt to the value calculated in step
3.
6. Press
to calibrate this range.
4-14.
Continuity/Hysteresis Threshold Calibration (Front Panel)
Perform the calibration as follows:
1. If the meter is already in calibration mode, press the
or
button to select
calibration. Otherwise, select calibration mode first (press Cal Enable button
for three seconds), then select
calibration by pressing the
button seven
times.
2. Connect the output of the dc voltage source to the
and COM input of the
meter.
3. Apply the outputs indicated in Table 4-5, and calibrate using the
button.
4-15.
Frequency Calibration (Front Panel)
If the meter is already in calibration mode, press the
button to select Hz calibration.
Otherwise, select calibration mode first (press Cal Enable button for three seconds), then
select Hz calibration by pressing the
button eight times. Complete step 32 of Table
4-5
4-16.
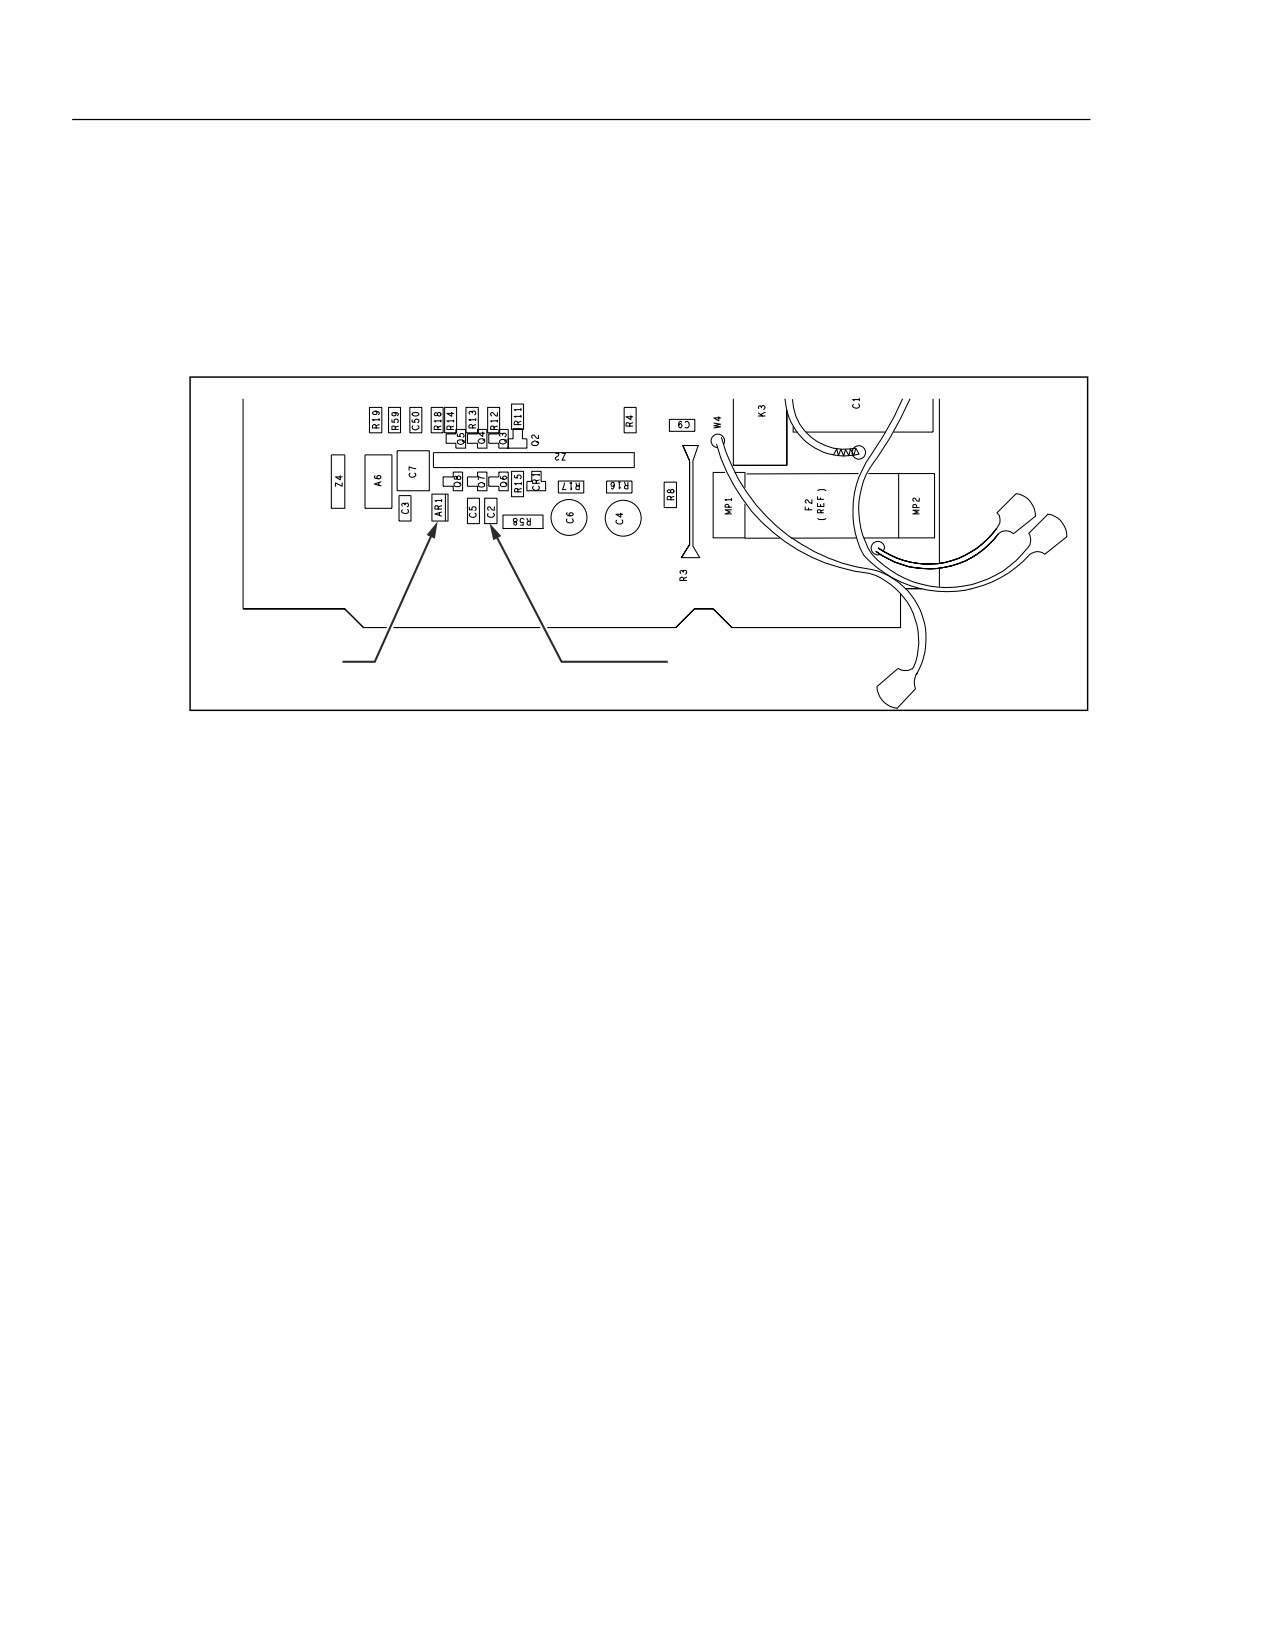
C2 Adjustment Procedure
The following procedure can be performed on meters that fail to meet the performance
test limits for high frequency VAC. The procedure is performed separately after all other
VAC calibration steps are completed. It is not necessary to enter the calibration mode to
adjust C2.
1.
Remove the top shield (MP11).
2.
Set the UUT to VAC
3.
Apply 15 mV, 1 kHz to the UUT input.
4.
Record the UUT display reading.
5.
Apply 15 mV, 20 kHz to the UUT input.
6.
Adjust C2 until the UUT display reads 40 µV less that the reading recorded in Step
4.
4-13
45
Service Manual
7.
Remove the adjustment tool from the vicinity of C2 and let the reading settle.
8.
The reading should remain stable.
9.
Readjust if necessary.
10. Re-install the top shield (MP11).
11. Complete the performance test for ACV.
AC Buffer Amp
C2
qb58sc.eps
Figure 4-2. C2 Location
4-17.
Editing the Prompt for Different Calibration Points
Except for the first three prompts in VDC (0.000 mV, +90.000 and -90.000 mV are
calibration constants), the Fluke 45 can be calibrated using calibration points other than
the prompted values. To do this, you must edit the prompt to the reference source value
as follows:
1. Press the
editor button. This intensifies the left-most digit of the numeric
display and turns the EDIT annunciator on.
2. Press the
editor button to increment the intensified digit from 0-9.
3. Press the
editor button again to intensify the next digit to be edited.
4. Once the edited value is equal to the reference source value, push the
button to
exit the edit mode.
Holding down the editor buttons causes continual incrementing until the button is
released.
For calibration at points other than full scale, you must account for the effect of non-
linearity and noise on the accuracy specifications. This effect is expressed as a
percentage added to the Fluke 45 specification.
Table 4-6 shows additional errors to be added to the specifications when calibration is
conducted at points other than full range.
For example, if ohms is calibrated using decades of 1.9 (190 Ω, 1.9 kΩ, etc.), the
additional error on the 300 Ω and 100 Ω ranges is 0.01%. Therefore, since calibration
has been performed at less than full scale, 0.01% must be added to the Fluke 45 300 Ω
and 100 Ω range accuracy to arrive at the new specification.
4-14
Performance Testing and Calibration
Calibration Using the Computer Interface
4
Note that the first three calibration points (0, 90 mV, and -90 mV) cannot be edited.
Also, to provide accuracy at full range, calibration is not recommended below one-third
of full range (10000 counts).
Table 4-6. Specifications Increase with Different Calibration Points
Cal Point In Display Counts
Function
20000
19000
10000
DC
.006%
.006%
.012%
AC
.045%
.05%
.09%
300 Ω/100 Ω
.01%
.01%
.02%
kΩ/MΩ
-
-
.01%
4-18. Calibration Using the Computer Interface
4-19.
Setup
Before performing this type of calibration, make sure that computer interface
connections are made to the Fluke 45. Then verify the ac power connection to the Fluke
45, and turn the meter on.
4-20.
RS-232 Interface
For RS-232 interface operation, use the following procedure from the front panel:
1. Press
, then press
2. Use
or
to scroll to the desired baud rate. Then press
to select the
displayed rate.
3. Use
or
to scroll to the desired parity ("E" for even, "Odd" for odd, or "no"
for none.) Then press
to select the displayed parity.
4. Use
or
to display "OFF" or "On" for command echo mode. Then press
to make the selection.
5. Send the following command from the computer interface:
*IDN?<CR>
6. Check for a response in the following format:
FLUKE, 45, nnnnnnn, n.n Dn.n <CR><LF> =><CR><LF>
where ’nnnnnnn’ is the multimeter serial number, ’n.n’ identifies the main software
version, ’Dn.n’ identifies the display software version, and ’=>’ is the RS-232 prompt.
If echo mode is ON, the response to the CALSTEP? command called for in Table 4-7
(step 12) appears in the form:
CALSTEP?<CR><LF>
+290.00E-3<CR><LF>
=><CR><LF>
where => is the prompt returned by the Fluke 45. The response to CALREF? also
follows this format.
4-15
45
Service Manual
4-21. IEEE-488 Interface
For IEEE-488 interface operation, use the following front panel procedure:
1. Press
, then press
2. Use
to scroll to "IEEE". Then press
to enable the IEEE-488 interface.
3. Send the following to the meter over the IEEE-488 bus:
Note
The following example uses Fluke BASIC commands entered from a Fluke
1722A Instrument Controller. Syntax may vary for other controllers.
INIT PORT 0<CR>
CLEAR PORT 0<CR>
PRINT @<address of meter>,"*IDN?"<CR>
INPUT LINE @<address of meter>,A$<CR>
PRINT A$<CR>
4. Check for the following response format:
FLUKE, 45, nnnnnnn, n.n Dn.n
where ’nnnnnnn’ is the multimeter serial number, ’n.n’ identifies the main software
version, and ’Dn.n’ identifies the display software version.
4-16
Performance Testing and Calibration
Calibration Using the Computer Interface
4
Table 4-7. Calibration Using the Computer Interface
Note
Before proceeding, allow for settling time of at least 30 seconds with no
input applied.
Step
Apply Input
Wait For Meter Settling Time
Send
1
0.0000 mV dc
5 s
CALSTEP?
2
90.000 mV dc
2 s
CALSTEP?
3
-90.000 mV dc
2 s
CALSTEP?
4
900.00 mV dc
2 s
CALSTEP?
5
90.000 mV dc
5 s
CALSTEP?
6
290.00 mV dc
1 s
CALSTEP?
7
2.9000 V dc
1 s
CALSTEP?
8
29.000 V dc
1 s
CALSTEP?
9
290.00 V dc
1 s
CALSTEP?
10
1000.0 V dc
1 s
CALSTEP?
Note
Settling times mentioned here assume that steps 1 through 32 are followed in sequence. If you
have just calibrated dc volts (steps 1 through 10), but do not follow the subsequent sequence, a
special settling period of 4 minutes may be required due to dielectric absorption caused by the
1000 V dc input in step 10. Examples of this requirement include re-checking dc volts calibration
(going from step 10 back to step 1) or skipping to ohms calibration (going from step 10 to step
25.)
AC Volts Calibration
11
29.000 mV ac, 1 kHz
3 s
CALSTEP?
12
290.00 mV ac, 1 kHz
3 s
CALSTEP?
13
290.00 mV ac, 1 kHz
3 s
CALSTEP?
14
2.9000 V ac,
1 kHz
3 s
CALSTEP?
15
29.000 V ac,
1 kHz
3 s
CALSTEP?
16
290.00 V ac,
1 kHz
3 s
CALSTEP?
17
750.00 V ac
1 kHz
3 s
CALSTEP?
DC Milliamps Calibration
18
29.000 mA DC
1 s
CALSTEP?
19
100.00 mA DC
1 s
CALSTEP?
DC Amps Calibration
22
10.000 A DC
3 s
CALSTEP?
AC Amps Calibration
23
2.000 A AC, 1 kHz
5 s
CALSTEP?
24
10.000 A AC, 1 kHz
5 s
CALSTEP?
Ohms Calibration
Step
Range
Input
Wait for Meter Settling
Send
Send
Time
25
1
190.0 Ω*
1 s
CALREF xxx.xx
CALSTEP?
26
2
1.900 kΩ
1 s
CALREF xxxx.x
CALSTEP?
27
3
19.00 kΩ
2 s
CALREF xxxxx
CALSTEP?
28**
4
190.0 kΩ
3 s
CALREF xxxxxx
CALSTEP?
29**
5
1.900 MΩ
3 s
CALREF xxxxxxx
CALSTEP?
4-17
45
Service Manual
Table 4-7. Calibration Using the Computer Interface (cont)
Continuity/Hysteresis Threshold Calibration
Step
Apply input
Wait for meter settling time
Send
30
0.000 mV dc
1 s
CALSTEP?
31
20.00 mV dc
1 s
CALSTEP?
Frequency Calibration
32
10 kHz, 2.000 V p-p
2 s
CALSTEP?
(xxxx... represents the known exact ohms value of the source)
* A 190 Ω source calibrates the 300 Ω range on the Fluke 45 to 0.06%+2 digits +0.02 Ω. For calibration of
this range to 0.05%+2 digits +0.02 Ω, use a 290 Ω source and the procedure detailed under Alternate
Ohms Calibration (Computer Interface). This procedure can also be used with appropriate discrete resistor
values (such as a decade box) on all ranges.
** Note that the 290 kΩ and 2.9 MΩ ranges are quite sensitive to noise. Any movement of the input leads
or movement of the hands or body in the vicinity of the leads can cause noisy readings. Use shielded
leads during this calibration. These two cal points should be verified for accuracy at the conclusion of
calibration.
4-22.
The Calibration Procedure
Now select calibration mode on the Fluke 45. Using a thin, blunt-tipped object, press the
recessed Cal Enable button for three seconds. Avoid using sharp objects that might
damage this button. Refer to Table 4-8 for brief descriptions of calibration mode
commands.
The CALREF xxx.xx command tells the Fluke 45 to change the calibration prompt to the
exact value of the input from the calibrator. Use of this command is equivalent to the act
of editing the calibration prompt from the front panel when other than exact calibration
points are to be used.
The CALSTEP? command normally returns the calibrated value of the input. If the input
is not within an anticipated range of the expected value (5 to 15%, depending on the
step), a beep is sounded at the front panel, a device dependent error is returned over the
computer interface, and the measured reading is returned.
The response to CALSTEP? must be received before each new step can begin. With
some steps (such as step 31), a noticeable delay may be encountered.
Before beginning calibration, consider the functions that will be affected. AC volts, dc
amps, ac amps, and ohms are all influenced by dc volts calibration. If you calibrate dc
volts, you must re-calibrate these other functions. But, calibration of ac volts, dc amps,
ac amps, and/or ohms influences only the function being calibrated.
If you plan to include the ohms function in your calibration procedure, determine the
residual lead and source zero resistance before you place the meter in calibration mode.
Use the following procedure:
1. Send: OHMS; RANGE 1
2. Measure the residual lead and source zero resistance on the 300 Ω range by sending:
VAL?
3. Record the response. This value is used if you elect to perform the Alternate Ohms
Calibration.
4. Now continue on with the calibration procedures in the following paragraphs.
4-18
Performance Testing and Calibration
Calibration Using the Computer Interface
4
4-23.
DC Volts Calibration (Computer Interface)
1. Connect the DC Calibrator to the Fluke 45
and COM inputs. Then send:
CAL 1
2. Complete steps 1 through 10 in Table 4-7. Then clear the dc volts source.
4-24.
AC Volts Calibration (Computer Interface)
1. Connect the AC Calibrator to the Fluke 45
and COM inputs. Then send:
CAL 2
2. Complete steps 11 through 17 in Table 4-7. Then clear the ac volts source.
4-25.
DC and AC Milliamps Calibration (Computer Interface)
1. Connect the mA Calibrator to the Fluke 45 [100 mA] and COM inputs. Then send:
CAL 3
2. Complete steps 18 and 19 in Table 4-7.
3. Now send:
CAL 4
4. Complete steps 20 and 21 in Table 4-7. Then clear the milliamp source.
4-26.
DC and AC Amps Calibration (Computer Interface)
1. Connect the Amps Calibrator to the Fluke 45 [10 A] and COM inputs. Then send:
CAL 5
2. Complete step 22 in Table 4-7.
3. Clear the dc amps source. Then send:
CAL 6
4. Complete steps 23 and 24 in Table 4-7, and clear the amps source.
4-27.
Ohms Calibration (Computer Interface)
If you do not have the value resistors (290 Ω, 2.9 kΩ, 29 kΩ, etc.) required by the Fluke
45 calibration prompts, the requested value (prompt) may be set to the value available. In
the following procedure, the Fluke 5700A Multifunction Calibrator is used as the ohms
source, with input values of 190 Ω, 1.9 kΩ, 19 kΩ, 190 kΩ, and 1.9 MΩ.
Note
If you are using an ohms calibrator without active 2-wire compensation,
take a zero ohms measurement before entering calibration mode. Use the
test leads that will be used for ohms calibration. Record this zero ohms
value. The CALREF xxx.xx command tells the Fluke 45 to calibrate to the
exact ohms value of the calibrator resistance. For the 290 Ω and 2.9 kΩ
steps, xxx.xx should be the calibrator value plus the recorded zero ohms
value.
1. Connect the Ohms Calibrator to the Fluke 45
and COM inputs. Then send:
CAL 7
4-19
45
Service Manual
Note that the 300 kΩ and 3 MΩ ranges are quite sensitive to noise. Any movement
of the input leads or movement of the hands or body in the vicinity of the leads can
cause noisy readings. Use shielded leads during this calibration. Verify these two
calibration points for accuracy at the conclusion of the calibration procedure.
2. Complete steps 25 through 29 in Table 4-7. Then clear the ohms source.
4-28.
Continuity/Hysteresis Threshold Calibration (Computer Interface)
1. Connect the DC Volts Calibrator to the Fluke 45
and COM inputs. Then
send:
CAL 8
2. Complete steps 30 and 31 in Table 4-7, and clear the source.
4-29.
Frequency Calibration (Computer Interface)
1. Connect the Frequency Calibrator to the Fluke 45
and COM inputs. Then
send:
CAL 9
2. Complete step 32 in Table 4-7. Then clear the frequency source.
4-30.
Concluding Calibration Using the Computer Interface
At the conclusion of this type of calibration, first make sure the source is cleared. Then
press the Cal Enable button on the meter to exit calibration mode.
Calibration mode can also be exited at any time by sending the *RST command. If this
command is sent prior to completion of all calibration points for the selected function, no
changes are made to nonvolatile calibration memory for that function.
If calibration mode is exited after completion of calibration of any function except VDC,
constants for other functions are not affected. But remember, whenever VDC is
calibrated, the calibration procedure for all other functions should be performed.
4-31.
Alternate Ohms Calibration (Computer Interface)
This procedure can be used with discrete resistor values (such as a decade box). On the
300 Ω range, this alternate procedure uses a 290 Ω source and yields a specification of
0.05%+2 digits +0.02 Ω. Alternate calibration of this range is detailed below, although
discrete resistor values can be used for all ranges. Lead and source zero resistances are
only taken into account for the lowest two ranges (300 Ω and 3 kΩ).
1. Add the value of lead and source zero resistance to the certified value of the source
resistor. Lead and source zero resistance is the value obtained with the VAL?
command, immediately prior to entering dc volts calibration. Use this total value as
’xxx.xx’ in the following command:
CALREF xxx.xx
2. Now send
CALSTEP?
Table 4-8. Calibration Mode Computer Interface Commands
4-20

Performance Testing and Calibration
Calibration Using the Computer Interface
4
CAL x
Start calibration of a new function, where x = 1 through 9, defined as follows:
1
VDC calibration
2
VAC calibration
3
DC Milliamps calibration
4
AC Milliamps calibration
5
DC Amps calibration
6
AC Amps calibration
7
Ohms calibration
8
Frequency comparator
9
Frequency calibration
CALCLR
Reset all calibration constants to nominal values, destroying present calibration.
CALCONST? xx
Return the value of the calibration constant indicated by xx. See Table 4-9.
CALREF?
Return the present calibration reference.
CALREF xxx.xx
Calibrate to the exact value xxx.xx, rather than the nominal (expected) cal value.
CALSTEP?
Return the calibrated value of the input.
EEREG? xx
Return the contents of the specified EEROM register (xx).
The following additional computer interface commands can be used in Calibration Mode. Use of any
other command results in an execution error.
*CLS
BUTTON?
*ESE
FORMAT?
*ESE?
LOCS
*ESR?
LWLS
*IDN?
REMS
*OPC
RWLS
*OPC?
SERIAL?
*RST
FORMAT
*SRE
VAL?
*SRE?
VAL1?
*STB?
*TRG
*WAI
4-21

45
Service Manual
Table 4-9. EEROM Calibration Constants
Calconst?
Valid Range
Description
1
0.97025 to 1.03775
VDC, range 1
2
0.97025 to 1.03775
VDC, range 2
3
0.97267 to 1.04554
VDC, range 3
4
0.96782 to 1.04035
VDC, range 4
5
0.96792 to 1.04045
VDC, range 5
6
0.9975 to 1.0025
100 mV gain
7
0.9975 to 1.0025
320 mV gain
8
0.9975 to 1.0025
3.2 V gain
9
-100 to 100
VAC offset, range 1
10
0.9725 to 1.0275
VAC, range 1
11
-100 to 100
VAC offset, ranges 2 through 4
12
0.9725 to 1.0275
VAC, range 2
13
0.9725 to 1.0275
VAC, range 3
14
0.9725 to 1.0275
VAC, range 4
15
0.9725 to 1.0275
VAC, range 5
16
0.9500 to 1.0500
ADC, range 1
17
0.9500 to 1.0500
ADC, range 2
18
0.9500 to 1.0500
ADC, range 3
19
0.9225 to 1.0775
AAC, range 1
20
0.9225 to 1.0775
AAC, range 2
21
-100 to 100
AAC offset, range 3
22
0.9225 to 1.0775
AAC, range 3
23
0.9990 to 1.0090
OHMS, range 1
24
1.0000 to 1.0100
OHMS, range 2
25
1.0040 to 1.0140
OHMS, range 3
26
0.9990 to 1.0090
OHMS, range 4
27
0.9990 to 1.0090
OHMS, range 5
28
0.9990 to 1.0090
OHMS, range 6
29
0.9886 to 1.0035
Slow Siemens
30
0.9910 to 1.0010
Medium and Fast Siemens
31
0.9999 to 1.0001
Frequency calibration
32
-10.0 to 10.0
Slow offset
33
1.0000 to 1.0006
Slow negative gain
4-22
Chapter 5
Diagnostic Testing and Troubleshooting
Title
Page
5-1.
Introduction
5-3
5-2.
Servicing Surface-Mount Assemblies
5-3
5-3.
Error Codes
5-4
5-4.
General Troubleshooting Procedures
5-10
5-5.
Power Supply Troubleshooting
5-10
5-6.
Raw DC Supply
5-10
5-7.
5-Volt Switching Supply
5-11
5-8.
Inverter
5-12
5-9.
Analog Troubleshooting
5-13
5-10.
Uart Test
5-13
5-11.
DC Volts Troubleshooting
5-14
5-12.
AC Volts Troubleshooting
5-14
5-13.
Ohms Troubleshooting
5-14
5-14. Digital Troubleshooting
5-15
5-15. Display Assembly Troubleshooting
5-17
5-16. Calibration Failures
5-19
5-17.
Introduction
5-19
5-18.
Calibration-Related Components
5-20
5-19.
Calibration Interrelationships
5-21
5-20.
Retrieving Calibration Constants
5-21
5-21.
Replacing the EEROM A1U5
5-21
5-1
Diagnostic Testing and Troubleshooting
Introduction
5
5-1.
Introduction
The Fluke 45 provides error code information and semi-modular design to aid in
troubleshooting. This chapter explains the error codes and describes procedures needed
to isolate a problem to a specific functional area. Finally, troubleshooting hints for each
functional area are presented.
But first, if the meter fails, check the fuses and replace as needed. If the problem
persists, verify that you are operating the meter correctly by reviewing the operating
instructions found in the User’s Manual.
Warning
Opening the case may expose hazardous voltages. Always
disconnect the power cord and measuring inputs before
opening the case. And remember that repairs or servicing
should be performed only by qualified personnel.
Required equipment is listed in Chapter 4 of this manual.
Signal names followed by a ’*’ are active (asserted) low. Signal names not so marked are
active high.
5-2.
Servicing Surface-Mount Assemblies
The 45 Dual Display Multimeter incorporates Surface-Mount Technology (SMT) for
printed circuit assemblies (pca’s). Surface-mount components are much smaller than
their predecessors, with leads soldered directly to the surface of a circuit board; no plated
through-holes are used. Unique servicing, troubleshooting, and repair techniques are
required to support this technology. The information offered in the following paragraphs
serves only as an introduction to SMT. It is not recommended that repair be attempted
based only on the information presented here.
Since sockets are seldom used with SMT, "shotgun" troubleshooting cannot be used; a
fault should be isolated to the component level before a part is replaced. Surface-mount
assemblies are probed from the component side. The probes should make contact only
with the pads in front of the component leads. With the close spacing involved, ordinary
test probes can easily short two adjacent pins on an SMT IC.
This Service Manual is a vital source for component locations and values. With limited
space on the circuit board, chip component locations are seldom labeled. Figures
provided in Chapter 6 of this manual provide this information. Also, remember that chip
components are not individually labeled; keep any new or removed component in a
labeled package.
Surface-mount components are removed and replaced by reflowing all the solder
connections at the same time. Special considerations are required.
• Use a solder tool with regulated hot air to melt the solder; there is no direct contact
between the tool and the component.
• Surface-mount assemblies require rework with wire solder rather than with solder
paste. A 0.025 inch diameter wire solder composed of 63% tin and 37% lead is
recommended. A 60/40 solder is also acceptable.
A good connection with SMT requires only enough solder to make a positive metallic
contact. Too much solder causes bridging, while too little solder can cause weak or open
solder joints. With SMT, the anchoring effect of the through-holes is missing; solder
provides the only means of mechanical fastening. Therefore, the pca must be especially
5-3
45
Service Manual
clean to ensure a strong connection. An oxidized pca pad causes the solder to wick up
the component lead, leaving little solder on the pad itself.
5-3.
Error Codes
At reset, the Fluke 45 software attempts power-up self-tests and initialization of ROM,
RAM, Display, EEROM, and measurement hardware. Self-test failures are reported on
the display with "error" in the secondary display and an error code (1-9) in the primary
display.
Several of these error codes might never be displayed. Certainly, errors 4 and 5, which
signify a faulty or dead display, could not be reported in the normal (displayed) manner.
Other errors might not appear on the display.
The keyboard scan lines (A1U6, SWR1-5), which are also used as status indicators, can
be checked as a last resort for accessing error information. The software sets SWR1
(A1U6-21) low to indicate that the basic operation of the processor, ROM, and ROM
decode circuitry is intact. SWR2 (A1U6-22) is set low if the ROM check passes. SWR3
(A1U6-23) is set low if the external RAM (A1U10) check passes, and SWR4 (A1U6-24)
is set low if the internal RAM (A1U6) check passes. Then, if the display self-check
passes, SWR5 (A1U6-25) is set low to indicate that the display is operational.
Table 5-1 describes the error codes.
Note
Each error code is displayed for 2 seconds. Any button press during this
period aborts the error display
5-4
Diagnostic Testing and Troubleshooting
Error Codes
5
Table 5-1. Error Codes
Error No.
Meaning
1
ROM test failed
2
External RAM test failed
3
Internal RAM test failed
4
Display self-test failed
5
Display dead
6
EEROM meter configuration corrupted
7
EEROM calibration data corrupted ("UNCAL" annunciator also lights)
8
A/D chip dead
9
Measurement self-test failed
Refer to Troubleshooting information later in this chapter.
Error 1
ROM (A1U8) checksum match failed.
All the bytes in the ROM (including a checksum byte) are summed
Error 2
External RAM (A1U10) check failed.
Error 3
Internal RAM (A1U6) check failed.
Complementary patterns are alternately written and read from each RAM location for
both external RAM and the 256 bytes internal to the 6303Y Main Processor (A1U6). If the
pattern read from any RAM location is not the same as the pattern written, the test fails.
Error 4
Display self-check failed
Error 5
Display dead.
The display processor automatically performs a self-check on power-up, and the Main
Processor attempts to read the result of this test.
Error 6
EEROM (A1U5) meter configuration corrupted or EEROM not initialized.
At power up, A1U6 reads CRC from EEROM (A1U5) location, then reads configuration
data from another location in EEROM, calculates an algorithm to compare to the CRC. If
an error is determined, the meter configuration is set to factory default and Error 6 is
displayed.
Error 7
EEROM (A1U5) calibration data corrupted.
The EEROM is divided into two storage areas: the default meter configuration storage and
calibration data storage. Each area uses a Cyclic Redundancy Checksum, against which
the data is checked on power-up. In addition, the calibration data includes parity
information for each calibration constant, which is also checked.
If the meter configuration check finds an error, the meter configuration is set to factory
defaults, and Error 6 is reported.
If the parity check or the calibration data checksum finds an error, the front panel UNCAL
annunciator is turned on, and Error 7 is reported.
Note
Errors 6 and 7 should always appear the first time a meter is
powered up with a new, uninitialized EEROM. Error 7
continues to appear at subsequent power-ups until the meter
is fully calibrated.
Error 8
Analog Measurement Processor (A1U1) dead.
Error 9
Measurement self-check failed.
The Analog Measurement Processor is programmed to do self test measurements. If the
Analog Measurement Processor does not respond, it is considered dead.
5-5
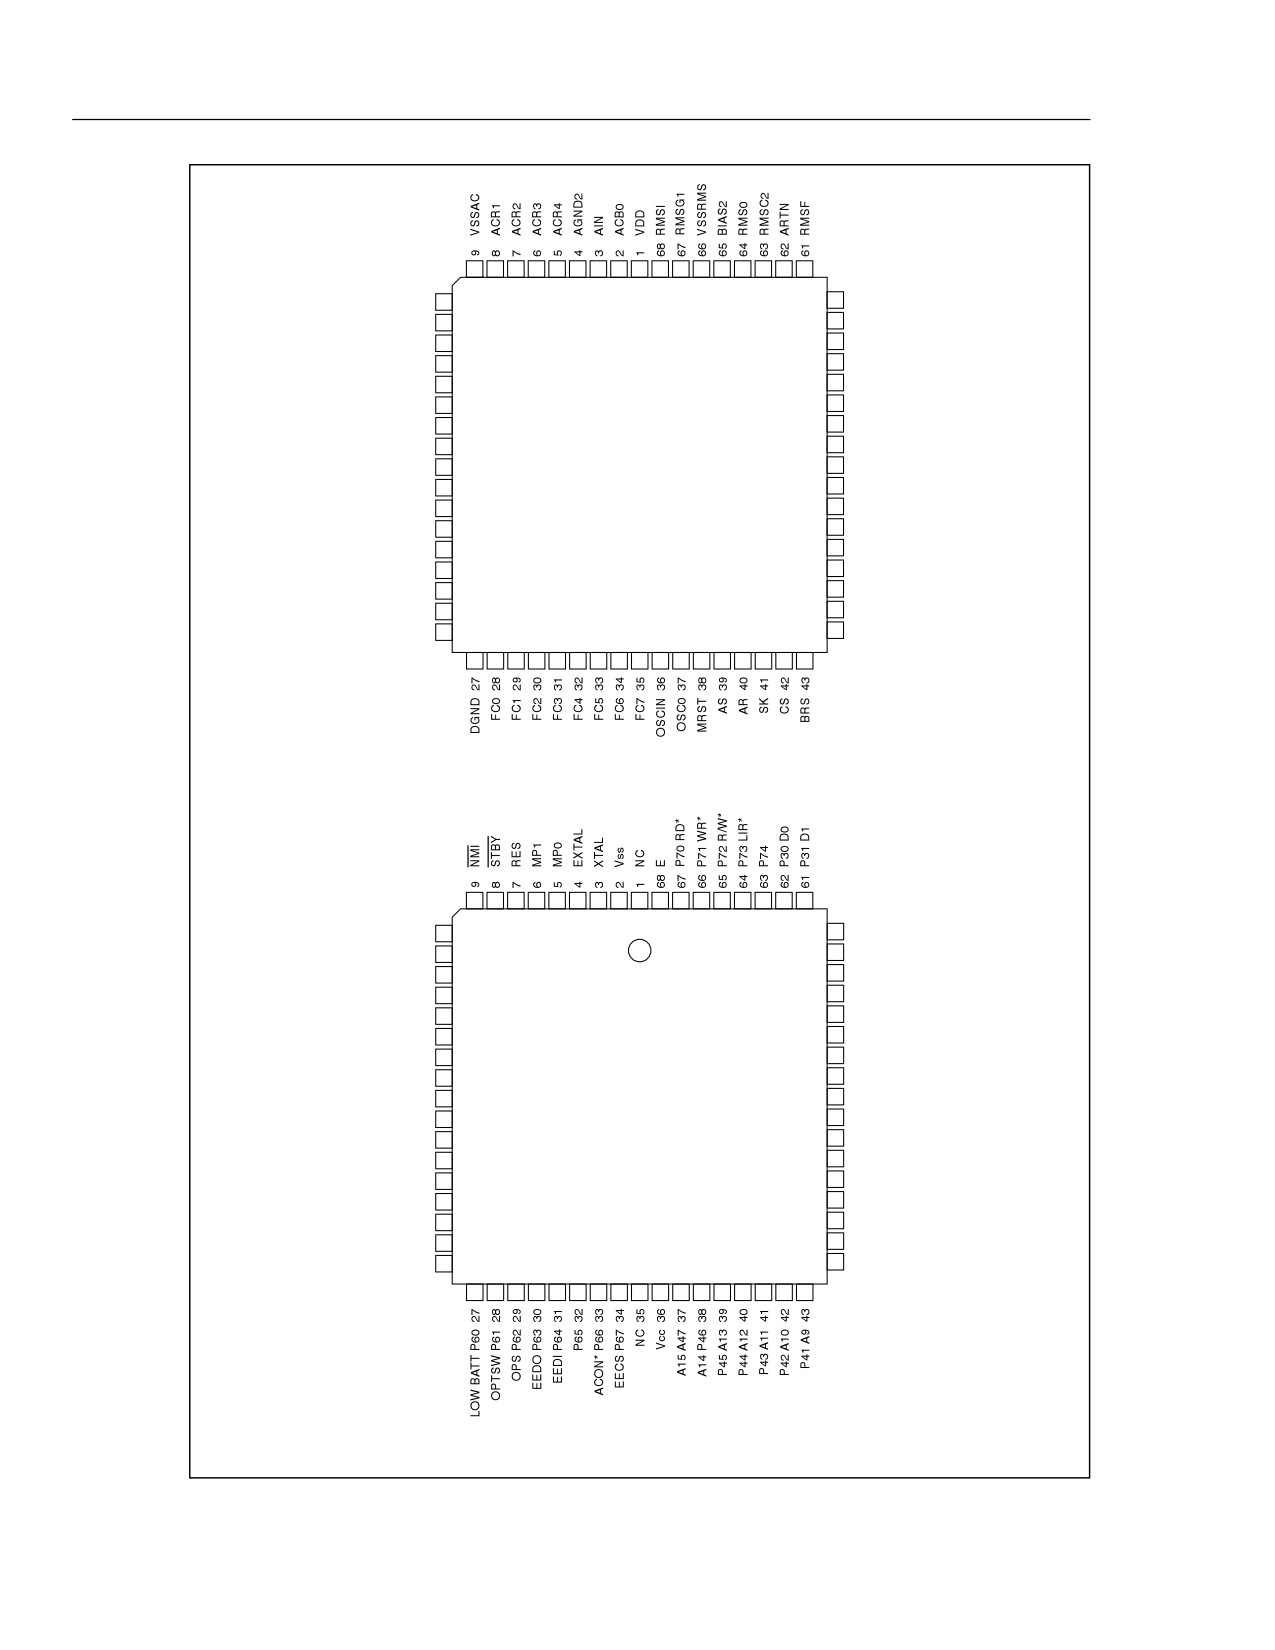
45
Service Manual
REFJ
10
60
FA0
LO
11
59
FAI
GUARD
12
58
AFI
RRS
13
57
MOF
V4
14
56
AF0
V3
15
55
RA-
V1
16
54
RA+
GUARD
17
53
RA0
V2F
18
52
VREF-
V2
19
51
VREF+
GUARD
20
50
B3
V0
21
49
B1
GUARD
22
48
B.3
0/VS
23
47
B.1
GUARD
24
46
SUM
AGND1 25
45
INT
26
44 VSS
A1U1 ANALOG MEASUREMENT PROCESSOR
DIGR P20
10
60
P32 D2
DIGS P21
11
59
P33 D3
DSCLK P22
12
58
P34 D4
RX P23
13
57
P35 D5
TX P24
14
56
P36 D6
DISRX P25
15
55
P37 D7
DISTX P26
16
54
EESK P27
17
53
P10 A0
NC
18
52
P11 A1
P50
19
51
P12 A2
IRRQ2* P51
20
50
P13 A3
SWR1 P52
21
49
P14 A4
SWR2 P53
22
48
P15 A5
SWR3 P54
23
47
P16 A6
SWR4 P55
24
46
P17 A7
SWR5 P56
25
45
Vss
SWR6 P57 26
44 P40 A8
A1U6 MAIN PROCESSOR
qb19f.eps
Figure 5-1. Test Point Locator
5-6
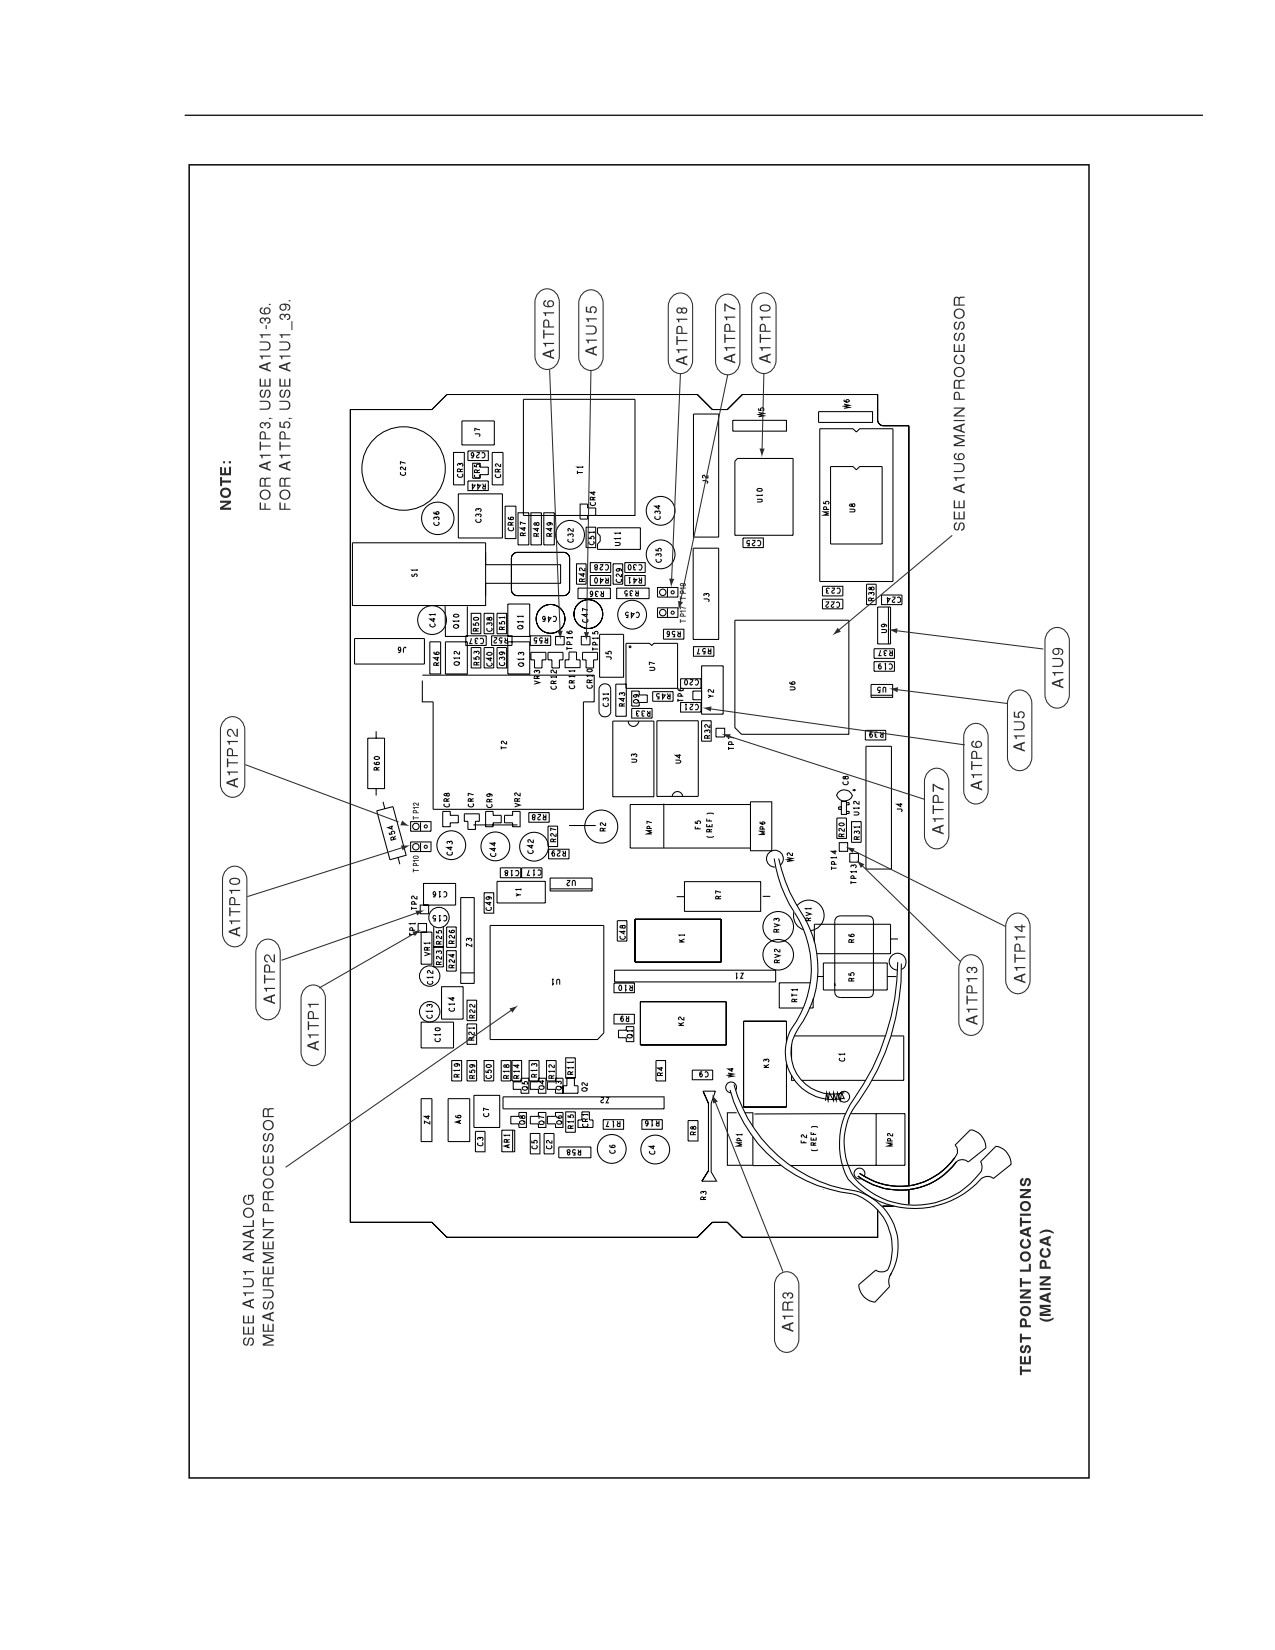
Diagnostic Testing and Troubleshooting
Error Codes
5
qb20c.eps
Figure 5-1. Test Point Locator (cont)
5-7
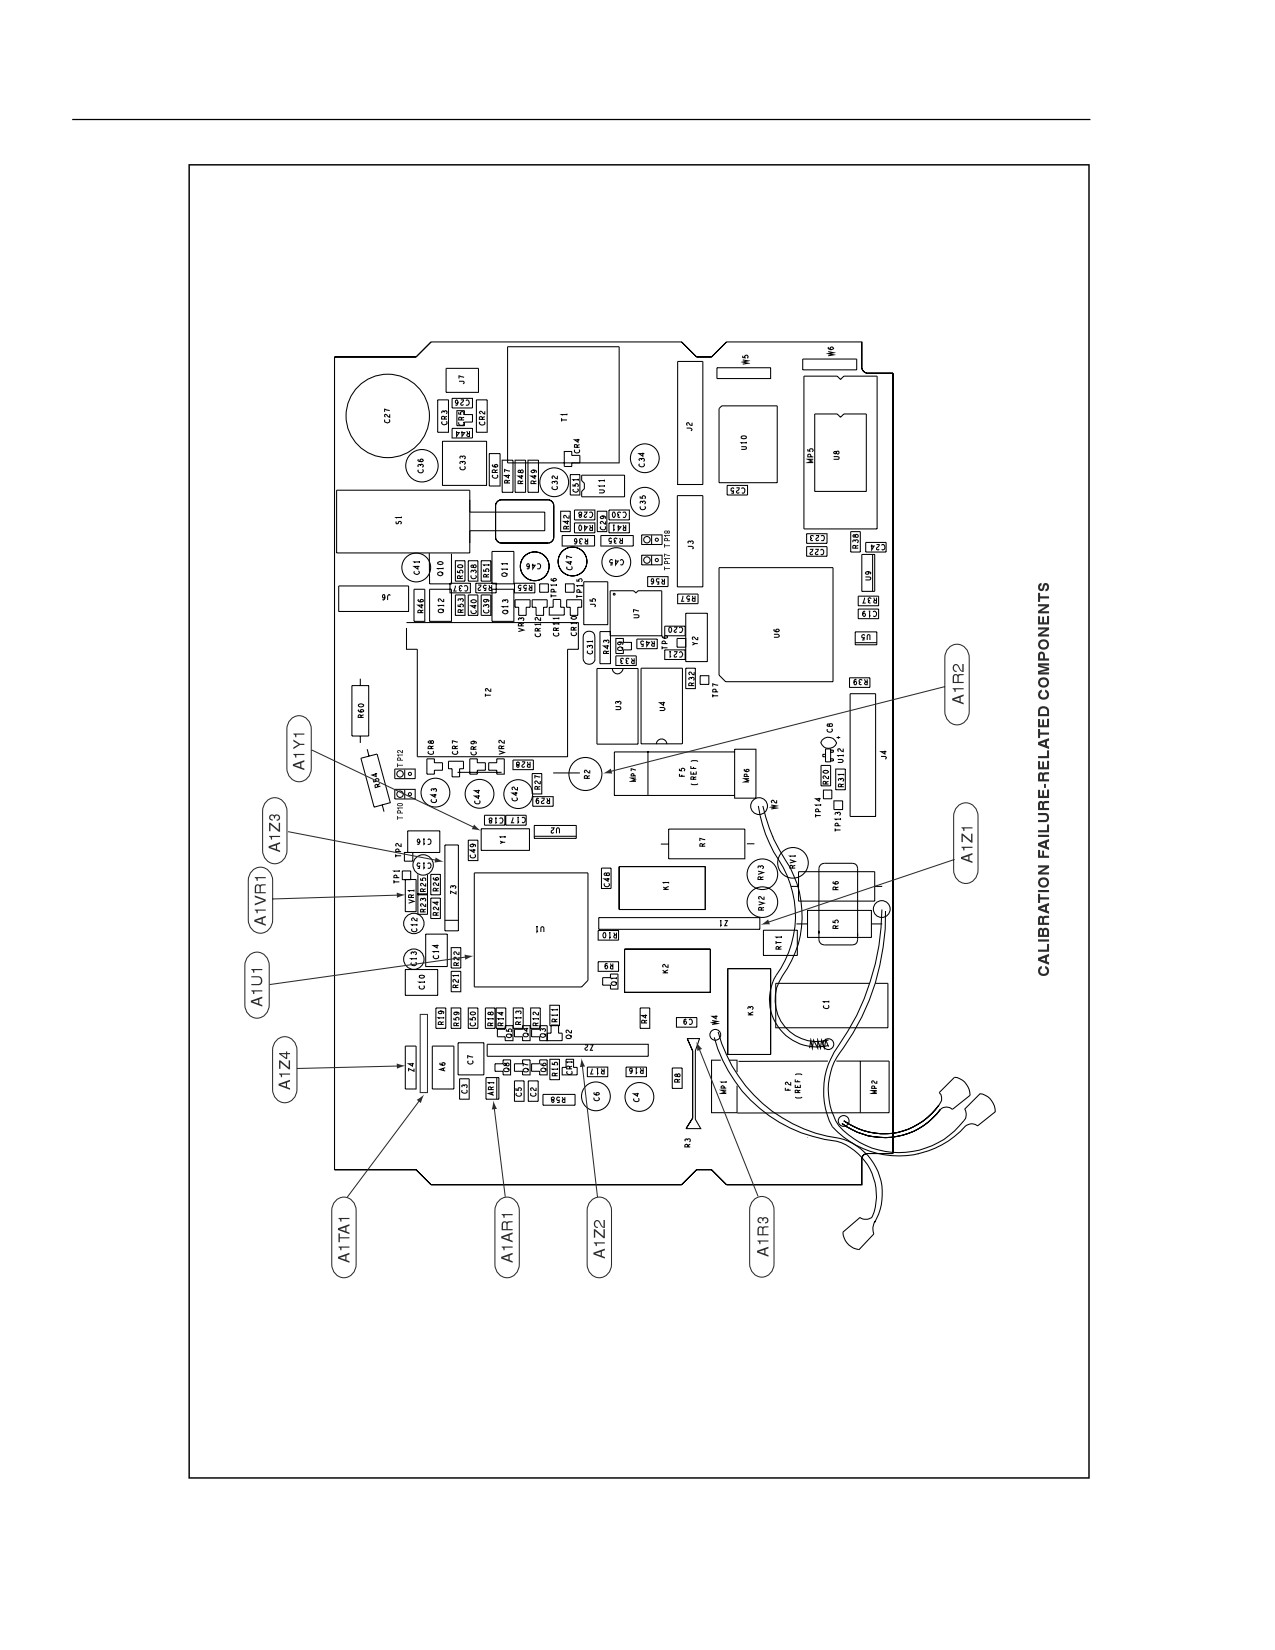
45
Service Manual
qb21c.eps
Figure 5-1. Test Point Locator (cont)
5-8
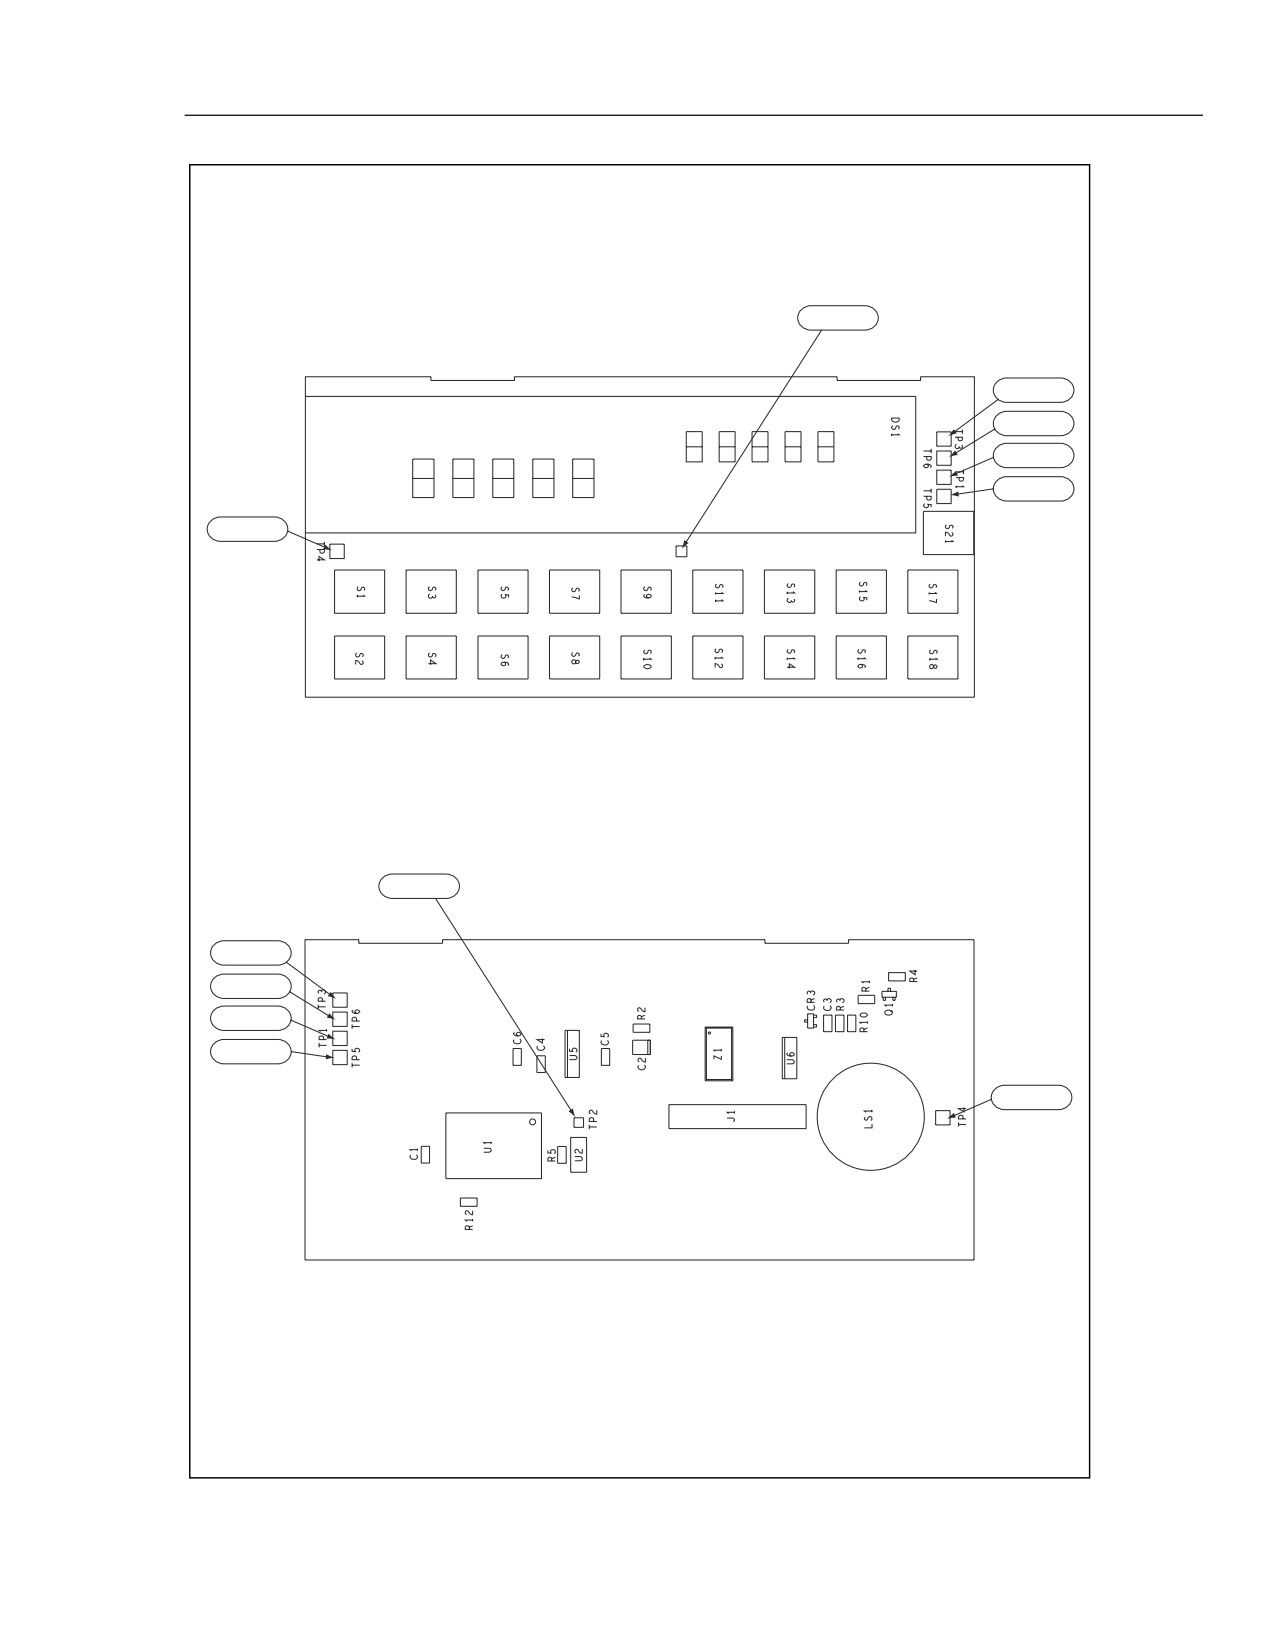
Diagnostic Testing and Troubleshooting
Error Codes
5
A2TP2
A2TP3
A2TP6
A2TP1
A2TP5
A2TP1
A2TP3 = GROUND
A2TP2
A2TP3
A2TP6
A2TP1
A2TP5
A2TP4
TEST POINT LOCATIONS
(DISPLAY PCA)
qb22c.eps
Figure 5-1. Test Point Locator (cont)
5-9
45
Service Manual
5-4.
General Troubleshooting Procedures
The Fluke 45 allows for some fault isolation using self-diagnostic routines and
descriptive error codes. However, these features are somewhat limited and do not
provide in-depth troubleshooting tools.
The Fluke 45 incorporates a semi-modular design; determining modules not related to a
problem constitutes the first step in the troubleshooting process. Disconnect the Battery
Option cable at the Main PCA. Disconnect the IEEE-488 Interface Option at P2 and P3
on the IEEE-488 Interface PCA. If either of these assemblies is causing the meter failure,
refer to troubleshooting information in Chapters 7 and 8 (7 for the Battery Pack Option,
8 for the IEEE-488 Interface Option.)
Measuring the power supplies helps to isolate a problem further. Refer to Table 5-2 and
Figure 5-1 for test point identification and readings. If power supply loading is
suspected, disconnect the Display PCA at J4 on the Main PCA. If this action solves the
loading problem, proceed to Display Assembly Troubleshooting elsewhere in this
chapter. Otherwise, refer to Power Supply Troubleshooting.
If the power supplies appear good, check the E clock signal to determine whether the
Main PCA or the Display PCA is causing the problem. A correct display depends on the
E clock signal. Missing segments, intensified digits, a strobing display, or a blank
display can be caused by a faulty E clock.
Use an oscilloscope to check for the E clock at microcomputer A1U6, pin 68. Look for a
921.6 kHz square wave that transitions from 0 to 5 V dc (VCC).
• If this signal is present, the problem is probably on the Display PCA. Refer to
Display Assembly Troubleshooting elsewhere in this chapter.
• If the E clock is something other than a 921.6 kHz square wave, isolate the digital
chapter of the Main PCA by disconnecting the Display PCA at J4. Then check the E
clock again, and refer to Digital Troubleshooting elsewhere in this chapter for
further problem isolation.
5-5.
Power Supply Troubleshooting
5-6.
Raw DC Supply
With the meter off (but connected to line power), check for approximately 16 V dc (at
120 V ac line voltage) between the ground test point and the cathode of either A1CR2 or
A1CR3. If necessary, check for transformer secondary voltage of approximately 24 V ac.
With the meter on, check for 19 V dc from A1U11, pin 8 to the ground test point. This
voltage is approximately 5 volts greater than the raw supply voltage when the switching
supply is operating properly. The controller IC, A1U11, starts operating when its supply
voltage is approximately 2.5 V dc.
5-10
Diagnostic Testing and Troubleshooting
Power Supply Troubleshooting
5
Table 5-2. Power Supplies
Supply Name
Measure
Supply Range
From:
To:
Main PCA (In-Guard Circuits)
VDD
A1TP10
COM, A1R2, or A1R3*
4.95 to 5.45 V dc
VSS *
A1TP12
COM, A1R2, or A1R3
-4.95 to -5.45 V dc
+VAC
+VAC
COM, A1R2, or A1R3*
4.7 to 5.35 V
-VAC
-VAC
COM, A1R2, or A1R3*
-4.7 to -5.35 V
Main PCA (Out-Guard Circuits)
VCC
A1TP18
A1TP17
4.85 to 5.35 V dc
VEE
A1TP16
A1TP17
-5.0 to -6.0 V dc
VLOAD
A1TP15
A1TP17
-28.5 to -32.0 V dc
Display PCA (Out-Guard Circuits)
VCC
A2U1-21
A2TP3 or A2U1-42
4.85 to 5.35 V dc
VEE
A2U1-4
A2TP3 or A2U1-42
-5.0 to -6.0 V dc
VLOAD
A2U1-5
A2TP3 or A2U1-42
-28.5 to -32.0 V
* These points are at ’Common.’ ’Ground’ is also used in the meter, but in relation to Out-
Guard circuits only. For example, the A2 Display PCA uses ’Ground’.
5-7.
5-Volt Switching Supply
Use an oscilloscope to troubleshoot the 5-volt switching supply. Check the waveform at
either A1U11, pin 6 (switch transistor collector) or A1T1, pin 2 to determine the loading
on the 5-volt switching supply.
•
Normal load:
The waveform is a square wave with a period of approximately 20 to 25 us and an
ON (voltage is low) duty ratio of about 0.35 when the line voltage is about 120 V ac.
The amplitude is usually about 15 V p-p. The positive-going edge of the waveform
will be "fuzzy" as the duty ratio is varying to compensate for the ripple of the raw
supply and the pulsing load due to the switching of the inverter. See Figure 5-2.
•
Very Light or No Load:
The OFF interval (voltage is high) part of the waveform will have a damped ringing
sine wave of 2 to 10 cycles.
•
Heavy Load or Shorted:
The waveform is a square wave with a very low ON duty ratio (approximately 0.1.)
If no square wave signal is present, the functioning of the oscillator can be checked
by looking at the waveform at A1U11, pin 3. Use the oscilloscope with ac coupling
to make this measurement. This waveform should be a sawtooth signal with an
amplitude of 0.5 V p-p and a period of approximately 20 to 25 µs.
The output current of the 5-volt switching supply can be determined by measuring
the voltage across the current limit current sense resistors (A1R47, A1R48, A1R49).
The current shunt is approximately 0.167 ohms. With line voltage at 120 V ac,
typical voltages across the current sense resistors are as follows:
•
Meter without options: 42 mV
•
Meter with IEEE-488 Interface Option: 72 mV
5-11
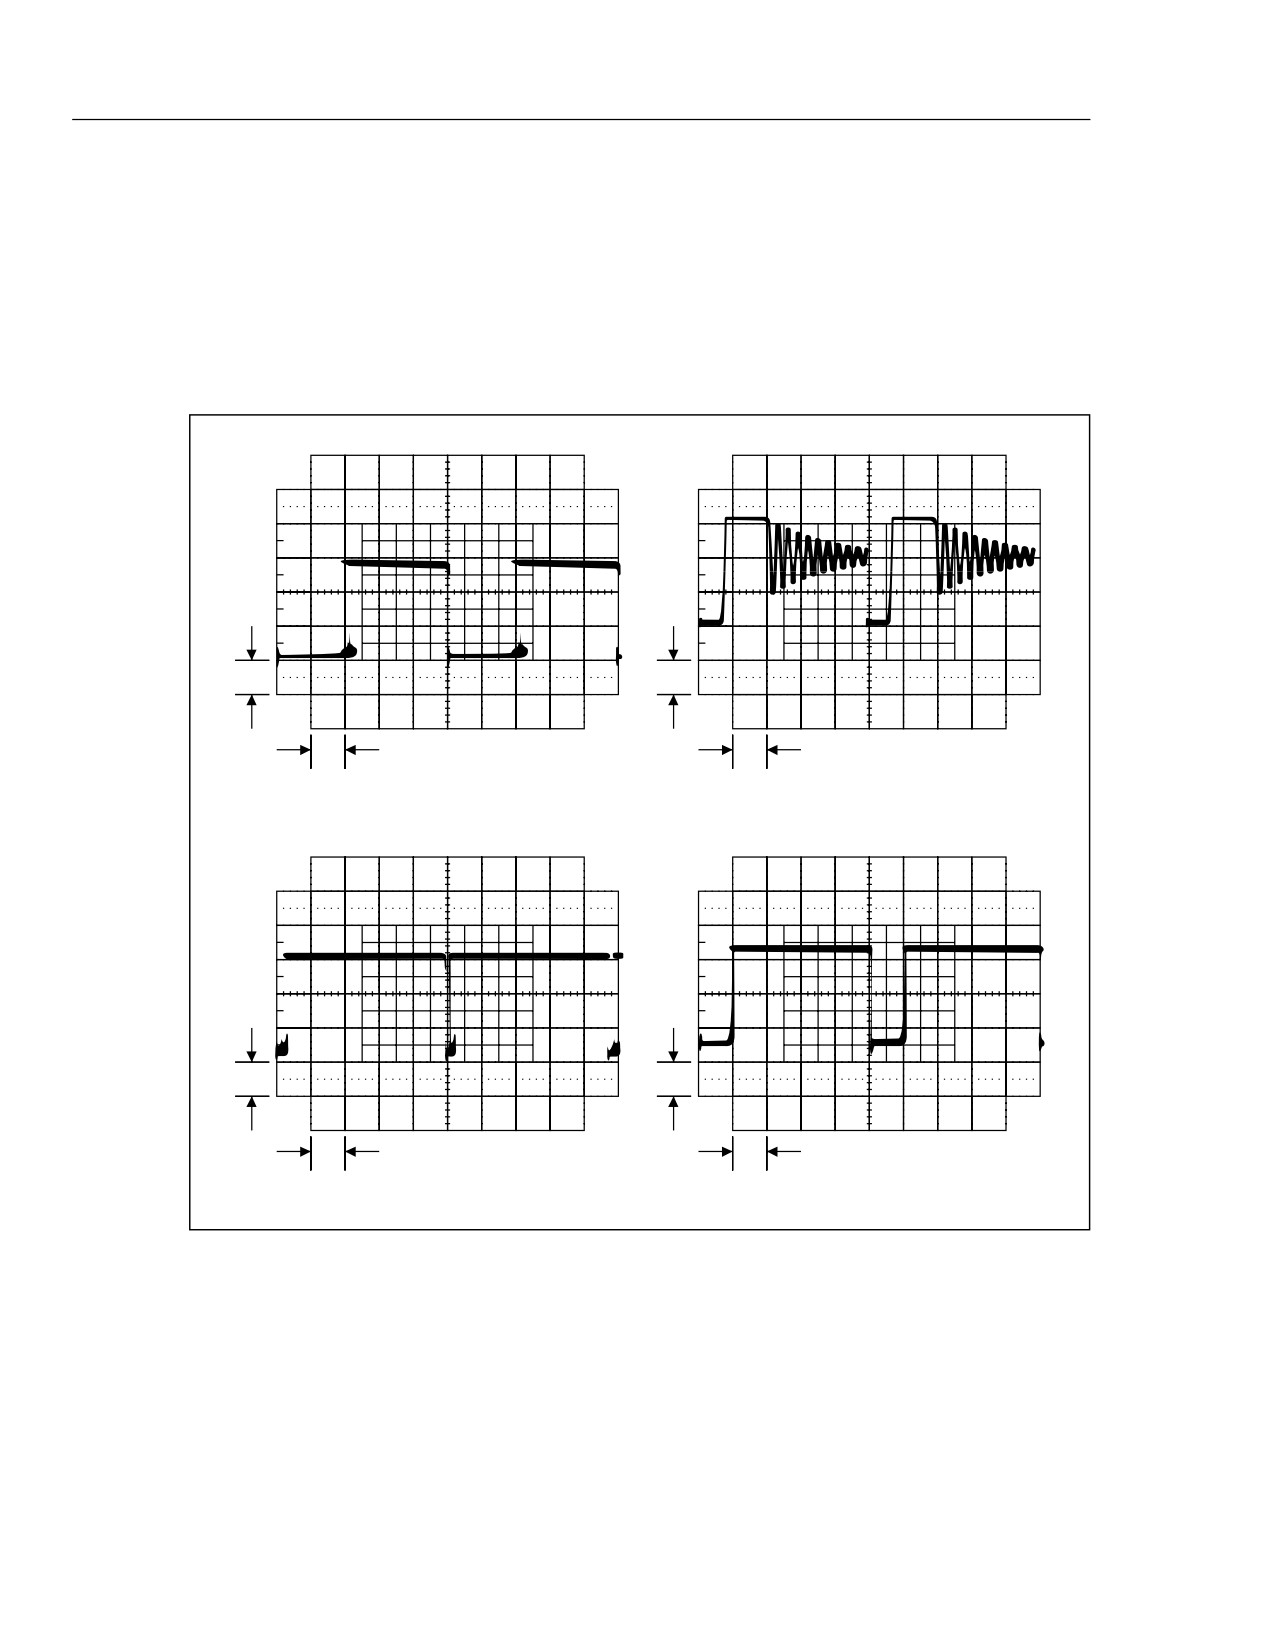
45
Service Manual
• Meter with Battery Option
Line Operation: 54 mV
Battery Operation: 43 mV
• Meter with IEEE-488 Interface and Battery Options
Line Operation: 85 mV
Battery Operation: 43 mV
5V
5V
5m s
5m s
NORMAL LOAD ON 5V SUPPLY
NO LOAD OR VERY LIGHT LOAD ON 5V SUPPLY
5V
5V
5m s
5m s
5V SUPPLY OUTPUT SHORTED
HEAVY LOAD ON 5V SUPPLY
qb23f.eps
Figure 5-2. Volt Switching Supply
5-8.
Inverter
Use an oscilloscope to troubleshoot the inverter. Check for a 9.6 V p-p signal (with a
period of approximately 30 to 40 µs) across the primary winding of the inverter
transformer (A1T2). If this signal is measured with reference to ground, the amplitude of
the square wave should be approximately 4.8 V p-p.
5-12
Diagnostic Testing and Troubleshooting
Analog Troubleshooting
5
Note
When making voltage measurements in the inverter circuit, remember that
there are two separate grounds. The out-guard ground is the ’GRD’ test
point, and the in-guard ground or common is the ’common’ test point.
The normal input current to the inverter supply is about 210 mA, or 1.05 V across
A1R46.
5-9.
Analog Troubleshooting
Analog circuit problems are evidenced by Error 8 or Error 9 in the display. These errors
signify either that the Main Processor (A1U6) is not communicating with the in-guard
circuitry or that the Analog Measurement Processor (A1U1) is not functioning correctly.
First, check the in-guard power supplies referenced to common:
Power
Supply
Testpoint Range
VDD
A1TP10
4.95 to 5.45 V dc
VSS
A1TP12
-4.95 to -5.45 V dc
+VAC
+VAC
+4.7 to +5.35
-VAC
-VAC
-4.7 to -5.35
Check the out-guard to in-guard communication for activity whenever a front panel
button is pressed. If necessary, press a button repeatedly while looking for the following
communication activity:
A1TP8 = GROUND to VCC pulses
A1TP4 = COMMON to VDD pulses
Check the in-guard to out-guard communication:
A1TP5 = VDD to 0.7 V above COMMON pulses
A1TP7 = GROUND to VCC pulses
Check the crystal oscillator referenced to COMMON:
A1TP3 = a 3.84 MHz sine wave (260 ns period)
Check the integrator waveform referenced to COMMON:
A1U1-45 should be a triangle wave when an input is being measured.
Check the 1.1 V reference:
A1TP2 to A1TP1 = +1.1 V
In general, check that the relays are getting the proper drive signals and that they are in
the correct position.
The 10 A current shunt (A1R3) or the mA current shunt (A1R2) can be used as a
convenient COMMON test point.
5-10.
Uart Test
This test checks both the optoisolators (A1U3 and A1U4) and the Analog Measurement
Processor (A1U1) UART circuitry. The Main Processor (A1U6) first sends a break
signal (5 V dc, logic high) to A1U1, then waits for a break signal in response from
A1U1. Once this occurs, A1U6 commands A1U1 to remove its break signal response.
5-13
45
Service Manual
To initiate the UART test, hold the
button down for three seconds. If the test passes,
"PASS" is shown in the secondary display. If the test fails, "FAIL" is shown in the
secondary display. The test is run repeatedly, updating the "PASS" or "FAIL" display
each time. An oscilloscope can thereby be used to trace the rectangular wave forms
across optoisolators A1U3 and A1U4.
To exit the UART Test, turn the meter off, wait three seconds, then turn the meter back
on.
5-11.
DC Volts Troubleshooting
Put the meter in the 300 mV or 3 V range, and apply an input. Then trace this signal as
described in Table 5-3.
5-12.
AC Volts Troubleshooting
Apply a signal with the multimeter set for the 300 mV ac range. Then trace this signal as
described in Table 5-4.
5-13.
Ohms Troubleshooting
Use a meter with high input impedance to measure the open circuit voltage for each
ohms range listed below. If a high input impedance meter is not available, the following
checks can be made on the 30 kΩ and lower ranges only.
RANGE
VOLTAGE:
300 Ω
3 V
3 kΩ
1.3 V
30 kΩ
1.3 V
300 kΩ
1.3 V
3 MΩ
1.3 V
30 MΩ
3 V
300 MΩ
3 V
With failures with these tests, suspect components are A1R5, A1RT1, A1K2, A1Q1,
A1Z1, and A1U1.
Now check the signal path at the following points: W1, A1U1-23 (OVS), A1U1-58
(AFI), and A1U1-56 (AFO). Suspect components for these checks are A1R6, A1R7,
A1K1, and A1U1.
Table 5-3. DC Volts Troubleshooting
Checkpoint
Description
Possible Fault
A1U1-23 (OVS)
Input signal
A1W1, A1R6, A1R7, A1K1
A1U1-58 (AFI)
Input signal, active filter input
A1U1
A1U1-56 (AFO)
Input signal, active filter output
A1U1
A/D low path
Check continuity among A1U1-13, RRS, and
A1R9, A1K2
COMMON.
5-14
Diagnostic Testing and Troubleshooting
Digital Troubleshooting
5
Table 5-4. AC Volts Troubleshooting
Checkpoint
Description
Possible Fault
A1Z2-1
Input signal
A1R5, A1R5, A1C1, A1K3
A1U1-2 (ACBO)
Amplified input (input x 2.5)
A1U1, A1R11-A1R14, A1Q2-A1Q8, A1Z2,
A1AR1, A1C7, A1R16, A1R17
A1U1-68 (RMSI)
Amplified input
A1U1
A6U1-14
Amplified input
A6U1
A1Z4-2
DC equivalent of amplified input
A6U1
A1U1-61 (RMSF)
DC equivalent of original input
A1Z4, A1R19, A1C10
5-14. Digital Troubleshooting
At power-up, if the display does not light or lights up and fails to report errors or begin
operation, use the following troubleshooting procedures.
First check the state of SWR1 (A1U6-21). If this status line is less than 0.8 V, basic
processor operation is intact. Examining SWR2 through SWR5 (A1U6-22 through -25,
respectively) should indicate how far the software progressed before finding an error. If
the state of SWR1 is not less than 0.8 V, the problem may be in the 6303Y Main
Processor (A1U6), the ROM or RAM decode circuitry (A1U9), the ROM (A1U8) or
RAM (A1U10), or the address/data lines among these parts.
Note
The functions of SWR1 through SWR5 as power-up status lines only
persist for 2 to 3 seconds. These functions end when the keyboard scanner
begins operation (if it can). Extremely difficult cases may require the use of
an oscilloscope triggered on the falling edge of SWR1 to examine the states
of SWR2 through SWR5.
To determine the relative health of the 6303Y Main Processor (A1U6), first check for a
valid E clock at pin 68. The default for the E clock after reset is a rectangular wave with
a period of 1.628 us and a duty cycle of about 67%.
If the processor is able to fetch instructions from the ROM, the software initializes the
processor, and the E clock becomes a square wave with a period of 1.085 us. Since this
initialization occurs almost immediately with a working meter, the resulting square wave
on the E clock line is a good indication that the software has begun to execute.
If the E clock remains a 1.628 us rectangular wave, the SWR2 (A1U6-22) keyboard scan
line may be shorted to ground. This condition would cause the Main Processor to HALT
after reset. Check whether the 6303Y Main Processor is attempting to access ROM;
LIR* (pin 64) should transition for a short period of time after reset. If it does, the
6303Y Main Processor is probably operational, and the problem is external to the
processor.
The processor can execute an instruction that stops both itself and the E clock.
Therefore, the absence of any activity on pin 68 does not necessarily mean that A1U6 or
A1Y2 is bad. If some other failure prevents proper ROM access, the processor may have
just "gone to sleep". This can be verified by checking for a rectangular wave occurring at
pin 68 for a short time after RESET* transitions high on pin 7. A1U6 and A1Y2 are
probably operational if this rectangular wave is present.
5-15
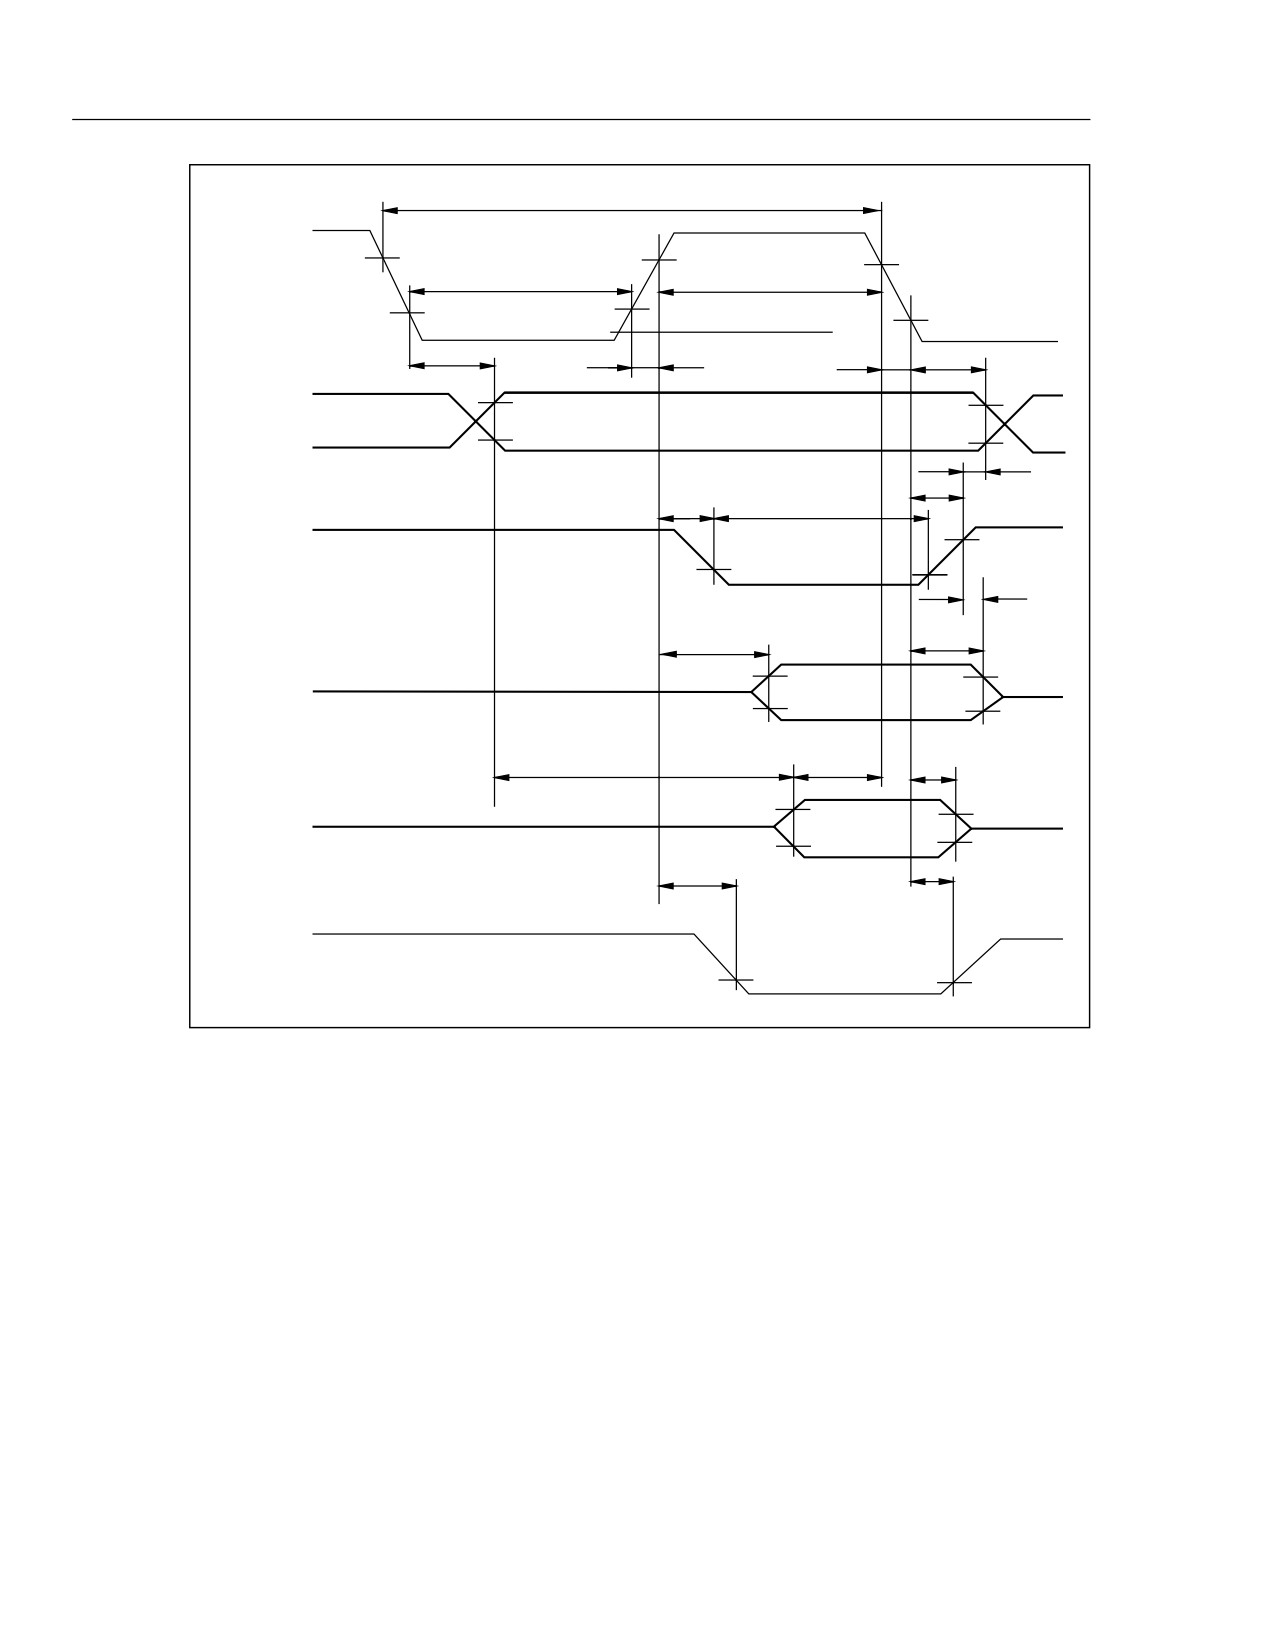
45
Service Manual
t cyc
2.4V
PW
EL
PW
EH
E
0.8V
tAD
t
AH1
t
Er
t
Ef
A0~A15
,
2.4V
R/W
0.8V
t
AH2
t
HRW
PW
RW
t
RWD
2.4V
RD,WR
0.8V
t
HW2
t
DDW
t
HW1
MCU Write
2.4V
D0 ~ D7
0.8V
t
ACC
t
DSR
t
HR
MCU Read
2.0V
D0 ~ D7
0.8V
t
DLR
t
HLR
LIR
0.8V
qb24f.eps
Figure 5-3. Main Processor Timing
To check the ROM decode circuitry, verify that A1U9-6 is transitioning low and that
these transitions correspond roughly to the low-going transitions of LIR*. Pin 6 must be
low when LIR* is low; see Figure 5-3. Verify that this signal also appears at the ROM
Chip Enable, A1U8-20. If the ROM Chip Enable is present, the problem is with the
ROM itself or there is a fault in the address/data lines among the 6303Y Main Processor,
ROM, RAM, and IEEE option connector.
If SWR1 (A1U6-21) and SWR2 (A1U6-22) transition low, but SWR3 (A1U6-23)
remains high, the problem is with the RAM decode circuitry (A1U9), the external RAM
(A1U10), or the address/data/control lines between the RAM and the 6303Y Main
Processor.
To check the RAM decode circuitry, verify that A1U9-8 is transitioning low and that
these transitions correspond approximately to the low-going transitions of WR* (A1U6-
66). It may be necessary to continually reset (power on) the meter to check these lines,
since the activity probably halts quickly when the meter software goes awry. Verify that
the signal on A1U9-8 also appears at the RAM Chip Enable, A1U10-20. If the RAM
5-16
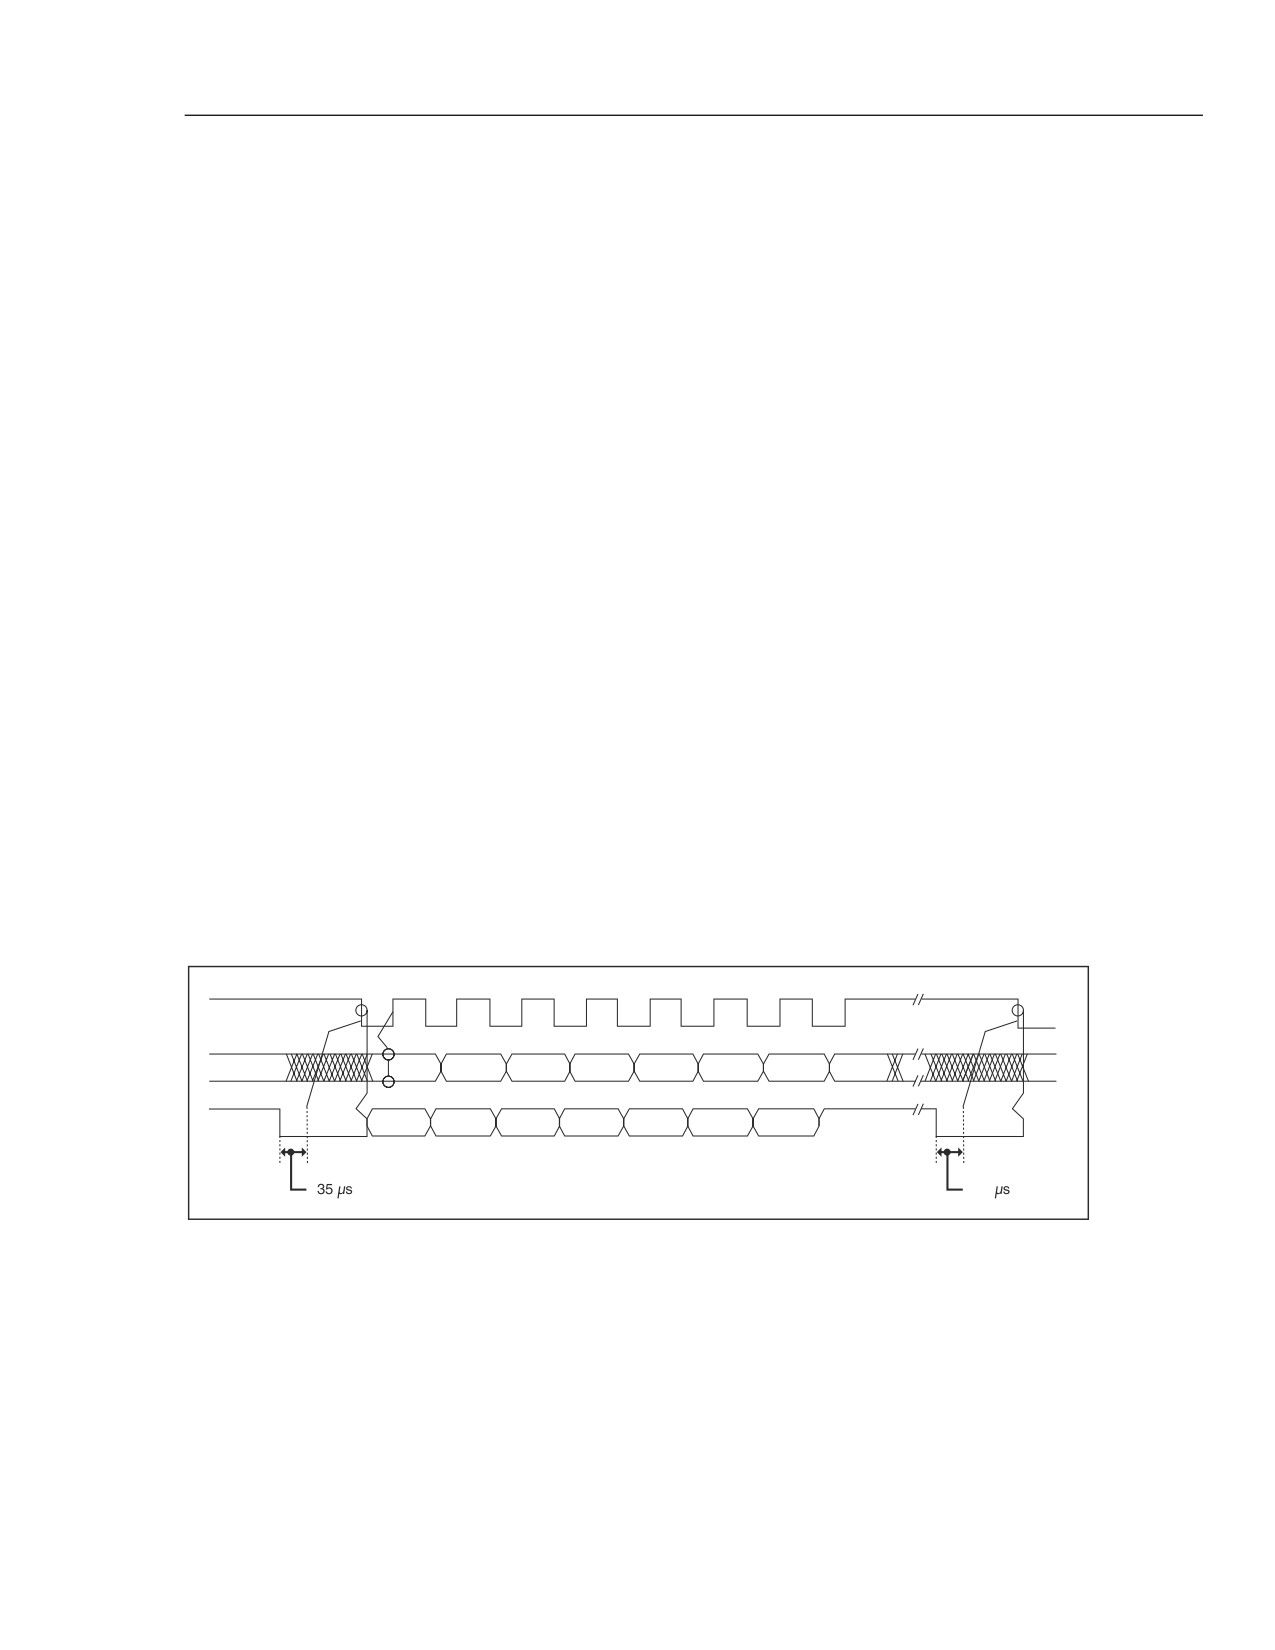
Diagnostic Testing and Troubleshooting
Display Assembly Troubleshooting
5
Chip Enable is present, the problem is with either the RAM itself or the address, data,
RD*, or WR* lines between the 6303Y Main Processor and the external RAM.
Figure 5-3 shows the timing relationships of the 6303Y Main Processor lines LIR* and
WR* to the system clock (E) and the address lines A0..A15. The ROM and RAM Chip
Enables correspond to the active (low) region shown for the address lines.
5-15. Display Assembly Troubleshooting
The following discussion is helpful if it has been determined that the Display Assembly
is faulty. This initial determination may not be arrived at easily, since an improperly
operating display may be the result of a hardware or software problem that is not a direct
functional part of the Display Assembly. Consult the General Troubleshooting
Procedures found earlier in this chapter for procedures to isolate the fault to the Display
Assembly. Use the following discussion of display software operation when
troubleshooting problems within a known faulty Display Assembly. A Display Extender
Cable is available (PN 867952) for use during troubleshooting.
Figure 5-4 shows the timing of communications between the main processor and the
display controller.
The Display Controller reads the DTEST* and LTE* inputs to determine how to
initialize the display memory. DTEST* and LTE* default to logic 1 and logic 0,
respectively, to cause all display segments to be initialized to "on". DTEST* is
connected to test points A2TP4, and LTE* is connected to A2TP5. Either test point can
be jumpered to VCC (A2TP6) or GND (A2TP3) to select other display initialization
patterns. Display Test Patterns #1 and #2 are a mixture of "on" and "off" segments with a
recognizable pattern to aid in troubleshooting problems involving individual display
segments. When either of the special display patterns is selected, the beeper is also
sounded for testing without interaction with the main processor. Table 5-5 indicates the
display initialization possibilities. Figures 5-5 and 5-6 show grid and anode assignments
for primary and secondary displays, respectively.
DSCLK
DISTX
BIT 7
BIT 6
BIT 5
BIT 4
BIT 3
BIT 2
BIT 1
BIT 0
DISRX
BIT 7
BIT 6
BIT 5
BIT 4
BIT 3
BIT 2
BIT 1
BIT 0
Clear to receive
Clear to receive
35
qb09.eps
Figure 5-4. Display Controller to Microprocessor Signals
5-17
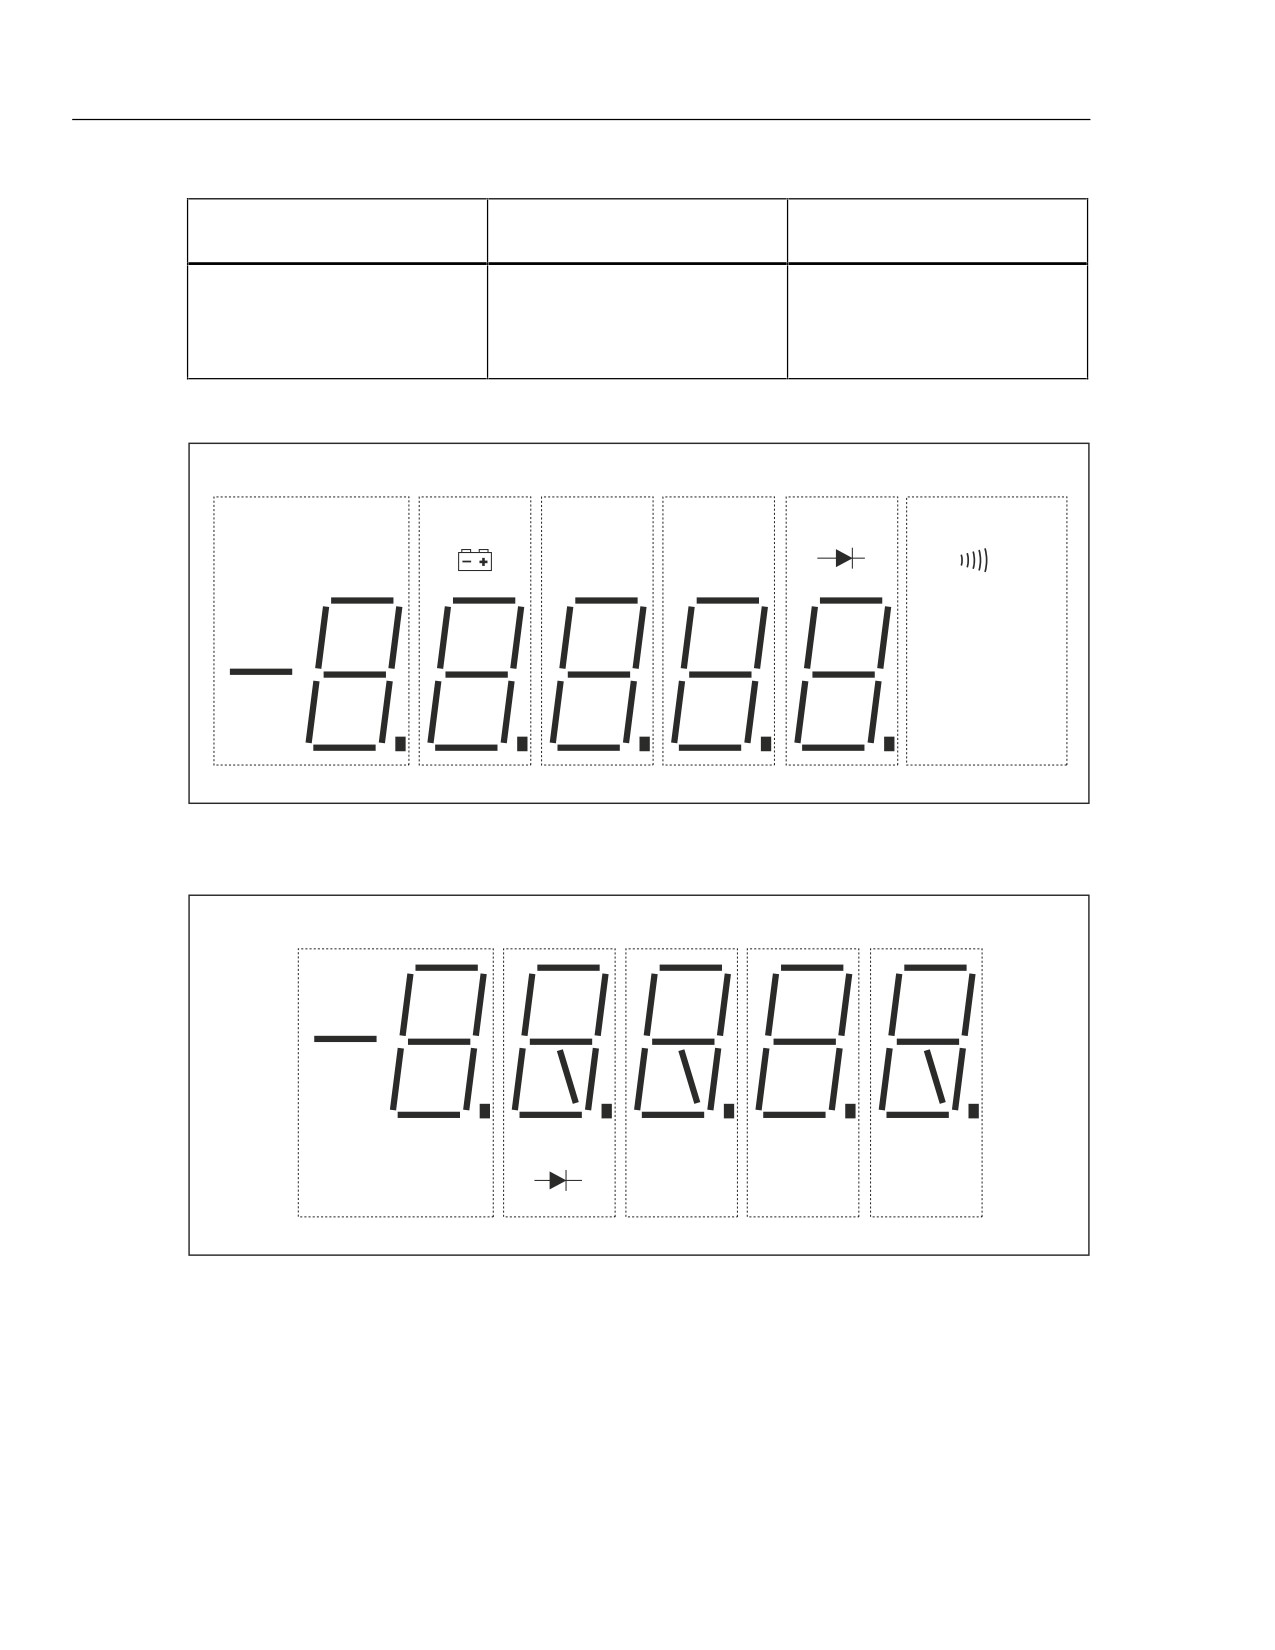
45
Service Manual
Table 5-5. Display Initialization
A2TP4 Dtest*
A2TP5 LTE*
Power-Up Display
Initialization
1
1
All Segments OFF
1
0
All Segments ON (default)
0
1
Display Test Pattern #1
0
0
Display Test Pattern #2
GRID(10)
GRID(9)
GRID(8)
GRID(7)
GRID(6)
GRID(5)
REMOTE
SMF
MAX
dB
MAX
AUTO
ANODE(13)
13
12
11
11
11
11
11
EXT TRG
MIN
HOLD
ANODE(12)
11
10
10
10
10
10
0
0
0
0
0
5
1
5
1
5
1
5
1
5
1
m A
0
1
ANODE(10)
6
6
6
6
6
m V AC DC
5
9
6
2
4
2
4
2
4
2
4
2
4
2
3
7
3
7
3
7
3
7
3
7
M k Ω Hz
8
4
3
7
qb26f.eps
Figure 5-5. Primary Display
GRID(4)
GRID(3)
GRID(2)
GRID(1)
GRID(0)
0
0
0
0
0
5
1
5
1
5
1
5
1
5
1
ANODE(9)
6
6
6
6
6
2
2
2
4
2
4
8
4
8
4
2
4
8
3
7
3
7
3
7
3
7
3
7
UNCAL
m A
m V
AC
DC
ANODE(13)
12
13
12
13
13
13
TOTAL
M k
Ω
Hz
ANODE(12)
10
12
10
11
12
qb27f.eps
Figure 5-6. Secondary Display
When a Fluke 45 display is initially powered up, all display segments should come on
automatically. If this display does not appear, proceed with the following steps:
Note
If the display is operational but has problems with front-panel button
presses, proceed directly to step 9.
5-18
Diagnostic Testing and Troubleshooting
Calibration Failures
5
1.
Check the three power supplies with respect to GND (A2TP3 or A2U1-42) on the
Display Assembly.
•
VCC (A2U1-6) 4.85 to 5.35 V dc
•
VEE (A2U1-19)-5.0 to -6.0 V dc
•
VLOAD (A2U1-18)-28.5 to -32.0 V dc
2.
Check the filament drive signals FIL1 and FIL2; these connect to the last two pins
on each end of A2DS1. These signals should be 5.0 V ac centered on a -25 V dc
level. FIL1 and FIL2 should be 180 degrees out of phase. If the dc bias of the
filament signals is not at about -25 V dc, the display segments that should be "off"
will show a shadowing (or speckling) effect.
Note
It may be necessary to disable the watchdog reset by jumpering A2TP1
(A1U5-3, A1U5-11) to GND (A2TP3) to verify the following items.
3.
Check the clock signal at A2TP2. This signal should be 4.19 MHz
(.238 µs per cycle).
If the signal is not 4.19 MHz, the ceramic resonator, U2 is probably defective.
4.
Check the state of the RESET signal (A2U1-1). This signal should be low once the
reset time is completed (after power-up).
5.
Verify that the DISRX signal (A2U1-39) goes low after RESET (A2U1-1) goes low.
If this sequence does not occur, communication to the Main Processor is held off
with the DISRX signal high. If DISRX stays high but is not shorted to VCC, A2U1
must be faulty.
6.
Verify activity for both the DISTX and DSCLK signals. These signals are driven by
the Main Processor and must be transitioning for the Display Controller to receive
commands from the Main Processor.
7.
If all segments of a particular digit do not turn on at power-up, the grid drive from
A2U1 may not be connected properly to A2DS1. Grids are numbered from 0 to 10
(left to right as the display is viewed). For a digit to be enabled, the respective grid
drive signals (GRID(0:10)) must be at approximately VCC (4.85 to 5.35 V dc.) For a
digit to be disabled, the drive must be at VLOAD (-28.5 to -32.0 V dc.)
8.
If a segment under each of several (or all) grids fails to be turned on (or off)
properly, one of the anode drive signals may not be connected properly from A2U1
to A2DS1. When an anode signal is at VCC, and a grid signal is at VCC, then the
corresponding segment on the display is illuminated.
9.
If the Main Processor has difficulty recognizing front-panel button presses, the
switch scanning signals (SWR1 through SWR6, A1U6-21 through -26, respectively)
should be checked. When no switch contacts are being closed, the switch scanning
lines should have about 20 kΩ of resistance between each other (through two 10 kΩ
pullup resistors to VCC). None of the switch scanning lines should be shorted
directly to GND at any time, unless one of the switches is closed.
5-16. Calibration Failures
5-17. Introduction
Calibration processes for both front panel and computer interface operation are described
in Chapter 4 of this manual. Generally, a calibration failure is noted with an error beep
5-19
45
Service Manual
and a displayed ’Error’ at the front panel and a device dependent error over the computer
interface. These indications occur if the input varies from what the meter expects to see
by more than ±15%. After one second, the meter reverts to normal operation in
calibration mode.
Before suspecting a fault with the Fluke 45, verify that the calibration is being conducted
properly.
• Check the connections between the source and the meter. Are all the connections in
place.
• Check the output of the calibration source. Does it equal the value called for by this
calibration step?
• Check the calibration source. Is it in operate mode? Has it reverted to standby?
If the calibration setup is correct, a faulty component within the Fluke 45 may be causing
the failure. Each measurement function depends on a combination of components in and
around the Analog Measurement Processor (A1U1). Basic dc measurements depend on
the zener reference (A1VR1), reference divider network (A1Z3), and integrate resistors
(A1Z3). Resistance measurements and dc measurements above three volts additionally
depend on the resistors in the dc divider network (A1Z1). AC measurements depend on
the ac divider network (A1Z2), ac buffer (A1AR1), and rms converter (A1A1), as well
as the basic dc measurement components.
Note
The Fluke 45 utilizes three measurement rates: slow, medium, and fast.
Two sets of measurement ranges are used: one for the medium and fast
rates and one for the slow rate. Whenever the meter is powered-up or put
in calibration mode, the medium rate is selected. During calibration, the
slow rate is selected automatically as required by the calibration step.
5-18.
Calibration-Related Components
Measurement function calibration depends on various combinations of components in
and around the Analog Measurement Processor. The major components are:
• Rms Converter A1A1
• AC Buffer A1AR1
• Shunt Resistors A1R2, A1R3
• Zener Reference A1VR1
• Divider Network (DC/Ohms) A1Z1
• Integrate Resistors, Reference Divider A1Z3
• AC Divider Network A1Z2
• Rms Converter Network A1Z4
Calibration of the Fluke 45 utilizes a building block approach; individual components
are calibrated separately and the appropriate calibration building blocks are assembled
later for correction of any particular measurement function, range, and rate. Calibration
steps are grouped by function, with dc volts being first.
Therefore, the calibration constants are partitioned to allow for some independence in
the correction of the various measurement functions. For example, if the zener reference
and divider needed replacing, it would be necessary to recalibrate dc volts only; ac volts
would not be affected. Table 5-6 identifies components that are unique to each
5-20
Diagnostic Testing and Troubleshooting
Calibration Failures
5
calibration step. Table 5-7 provides a different approach, relating components that are
common to a group of calibration steps.
5-19.
Calibration Interrelationships
If you suspect calibration errors, but the meter does not exhibit the symptoms mentioned
above, verify that you are observing the following calibration rules:
• Stored dc volts calibration constants influence constants for several other functions.
If dc volts is recalibrated, these other functions must be recalibrated. This
interrelationship is explained in Table 5-8.
• Independent calibration of any function except dc volts results in the storage of
correcting calibration constants for that function only.
• Once calibration is begun, all steps for that function must be completed before the
calibration constants are stored. If all steps are not completed and the procedure is
terminated, only calibration constants for previously completed functions are stored.
5-20.
Retrieving Calibration Constants
If a calibration error is suspected, the stored constant can be retrieved and verified over
the computer interface. This information can be specified by the number of the constant.
Table 5-9 lists the calibration constant numbers. Use the following format:
CALCONST? xx (where xx denotes the calibration constant number)
Except for constants 9, 11, 21, and 32, the response format is:
±1.XXXXXXor ±0.XXXXXXX
5-21.
Replacing the EEROM A1U5
The EEROM provides non-volatile storage for the serial number of the meter, meter
configuration and calibration information. If the EEROM is replaced during repair, the
new EEROM should be programmed with the 7-digit serial number, found on the rear
panel of the meter. Use the following command to program the serial number into the
EEROM:
SERIAL XXXXXXX
(xxxxxxx denotes the 7-digit serial number. Note:
once entered, the serial number cannot be changed.)
5-21
45
Service Manual
Table 5-6. Calibration Steps and Related Components
Step
Range
Input
Related Components
VDC
1
100 mV
0.0000 V
A1VR1, A1Z3
2
100 mV
0.0900 V
A1VR1, A1Z3
3
100 mV
-0.0900 V
A1VR1, A1Z3
4
1000
0.9000 V
A1VR1
5
mV
0.0900 V
A1VR1, A1Z3
6
100 mV
0.2900 V
A1VR1, A1Z3
7
300 mV
2.9000 V
A1VR1, A1Z3
8
3 V
29.000 V
A1VR1, A1Z1, A1Z3
9
30 V
290.00 V
A1VR1, A1Z1, A1Z3
10
300 V
1000.0 V
A1VR1, A1Z1, A1Z3
1000 V
VAC
11
300 mV
0.0290 V
A1A1 A1VR1, A1Z2, A1Z3, A1Z4
12
300 mV
0.2900 V
A1A1 A1VR1, A1Z2, A1Z3, A1Z4
13
3 V
0.2900 V
A1A1 A1VR1, A1Z2, A1Z3, A1Z4
14
3 V
2.9000 V
A1A1 A1VR1, A1Z2, A1Z3, A1Z4
15
30 V
29.000 V
A1A1 A1VR1, A1Z2, A1Z3, A1Z4
16
300 V
290.00 V
A1A1 A1Z1, A1Z2, A1Z3, A1Z4
17
750 V
750.00 V
A1A1 A1Z1, A1Z2, A1Z3, A1Z4
DC mA
18
30 mA
29.000 mA
A1R2, A1VR1, A1Z3, A1F1
19
100 mA
100.00 mA
A1R2, A1VR1, A1Z3, A1F1
AC mA
20
30 mA
29.000 mA
A1A1, A1R2, A1VR1, A1Z2, A1Z3, A1Z4, A1F1
21
100 mA
100.00 mA
A1A1, A1R2, A1VR1, A1Z2, A1Z3, A1Z4, A1F1
DC A
22
10 A
10.000 A
A1R3, A1VR1, A1Z3, A1F2
AC A
23
10 A
2.0000 A
A1A1, A1R3, A1Z4, A1F2
24
10 A
10.000 A
A1A1, A1R3, A1VR1, A1Z3, A1Z4, A1F2
Ohms
25
300 Ω
190.00 Ω
A1Z1, A1Z3
26
3 kΩ
1.9000 kΩ
A1Z1, A1Z3
27
30 kΩ
19.000 kΩ
A1Z1, A1Z3
28
300 kΩ
190.00 kΩ
A1Z1, A1Z3
29
3 MΩ
1.9000 MΩ
A1Z1, A1Z3
Continuity/Hysteresis Threshold
30
0.000 mV
A1U1
31
20.00 mV
A1U1
Frequency
32
2.000 V p-p 10 kHz
A1Y1
5-22
Diagnostic Testing and Troubleshooting
Calibration Failures
5
Table 5-7. Components Unique to Calibration Steps
Related Component (Main PCA)
Cal
A1A1
A1AR
A1R2
A1R3
A1U1
A1VR1
A1Y1
A1Z1
A1Z2
A1Z3
A1Z4
Step
1
VDC
1
x
2
x
x
3
x
x
4
x
x
5
x
x
6
x
x
7
x
x
8
x
x
x
9
x
x
x
10
x
x
x
VAC
11
x
x
x
x
x
12
x
x
x
x
x
13
x
x
x
x
x
14
x
x
x
x
x
15
x
x
x
x
x
16
x
x
x
x
x
17
x
x
x
x
x
DC mA
18
x
x
x
19
x
x
x
AC mA
20
x
x
x
x
x
x
21
x
x
x
x
x
x
DC A
22
x
x
x
AC A
23
x
x
x
x
x
24
x
x
x
x
x
OHMS
25
x
x
26
x
x
27
x
x
28
x
x
29
x
x
Continuity/Hysteresis Threshold
30
x
31
x
Frequency
32
x
5-23
45
Service Manual
Table 5-8. Calibration Hierarchy
Calibration Type
Prior Calibration Required
DC Volts
none
AC Volts
DC Volts
DC Amps
DC Volts
AC Amps
DC Volts
Ohms
DC Volts
Continuity/Hysteresis Threshold
none
Frequency
Continuity/Hysteresis Threshold
Table 5-9. Calibration Constants
Calconst?
Valid Range
Description
1
0.97025 to 1.03775
VDC, range 1
2
0.97025 to 1.03775
VDC, range 2
3
0.97267 to 1.04554
VDC, range 3
4
0.96782 to 1.04035
VDC, range 4
5
0.96792 to 1.04045
VDC, range 5
6
0.9975 to 1.0025
100 mV gain
7
0.9975 to 1.0025
320 mV gain
8
0.9975 to 1.0025
3.2 V gain
9
-100 to 100
VAC offset, range 1
10
0.9725 to 1.0275
VAC, range 1
11
-100 to 100
VAC offset, ranges 2 through 4
12
0.9725 to 1.0275
VAC, range 2
13
0.9725 to 1.0275
VAC, range 3
14
0.9725 to 1.0275
VAC, range 4
15
0.9725 to 1.0275
VAC, range 5
16
0.9500 to 1.0500
ADC, range 1
17
0.9500 to 1.0500
ADC, range 2
18
0.9500 to 1.0500
ADC, range 3
19
0.9225 to 1.0775
AAC, range 1
20
0.9225 to 1.0775
AAC, range 2
21
-100 to 100
AAC offset, range 3
22
0.9225 to 1.0775
AAC, range 3
23
0.9990 to 1.0090
OHMS, range 1
24
1.0000 to 1.0100
OHMS, range 2
25
1.0040 to 1.0140
OHMS, range 3
26
0.9990 to 1.0090
OHMS, range 4
27
0.9990 to 1.0090
OHMS, range 5
28
0.9990 to 1.0090
OHMS, range 6
29
0.9886 to 1.0035
Slow Siemens
30
0.9910 to 1.0010
Medium and Fast Siemens
31
0.9999 to 1.0001
Frequency calibration
32
-10.0 to 10.0
Slow offset
33
1.0000 to 1.0006
Slow negative gain
5-24