содержание .. 9 10 11 12 ..
РОССИЙСКИЙ СТАТИСТИЧЕСКИЙ ЕЖЕГОДНИК (2017 год) - часть 11
6. УРОВЕНЬ ЖИЗНИ НАСЕЛЕНИЯ / LIVING STANDARDS OF POPULATION
METHODOLOGICAL NOTES
Data on actual final consumption of households contain changes related to introduction of international methodology for the evaluation
of housing services produced and consumed by homeowners; estimation of consumption of fixed capital based on its current market value;
harmonization of data on exports and imports with balance of payments data, developed according to the methodology of the 6 edition of the
IMF “Balance of Payments and International Investment Position Manual (BPM6)” (BPM6); update of data on development of the basic2011
“Input-Output” tables , inclusion of an assessment of services of household workers (domestic servants), as well as the implementation of
provisions of the 2008 SNA regarding results of research and development and weapons systems.
Tables 6.1, 6.2. Average per capita money income (per month) is calculated by dividing annual money income by 12 and by midyear
population.
Tables 6.1, 6.2, 6.5. Real accrued wages of employees of organizations is the purchasing power of wages in the reporting period due
to changes in prices of consumer goods and services compared to base period. For this purpose
the index of real
accrued
wages is com-
piled by dividing the index of nominal accrued
wages by consumer price index for the same time period.
Tables 6.1, 6.2, 6.7. Average monthly accrued nominal wages of employees of organizations are compiled by dividing of accrued
wage of employees by average annual payroll number of employees and a number of months in the period. The wage includes the amounts of
accrued wages paid to employees in cash and in kind for worked and not worked time, compensation payments related to the mode of work
and working conditions, surcharges and allowances, bonuses, one-time incentive payments, as well as payment of food and accommoda-
tion. Benefits received by employees from state non-budgetary funds are not included in the wage fund and the average monthly wages.
Tables 6.1, 6.2, 6.8, 6.9. Average rate of pension is determined by dividing the total sum of accrued pensions (in 2000 taking into ac-
count compensation) by number of pensioners, registered at agencies of the Pension Fund of the Russian Federation (before 2002 - at
agencies of social protection of population).
Tables 6.1, 6.8, 6.16. Subsistence minimum level in accordance with the Federal Decree of October 24, 1997, No 134-FZ
"On the subsistence minimum in the Russian Federation" is a value estimate of a consumer basket and compulsory payments and dues.
Since 2000 the methodology to compile subsistence minimum was changed; estimation is presented using limits established by the
Government of the Russian Federation for Q I-IV of the corresponding year. On the basis of the Federal Law of October 24, 1997 No. 134-
FZ "On the subsistence minimum in the Russian Federation" in 2005-2012 the composition of the consumer basket was changed to deter-
mine the amount of the subsistence minimum.
Since 2013, Federal Law No. 233-FZ of 3 December 2012 "On Amending the Federal Law" On the Subsistence Minimum in the Russian
Federation "amended the procedure for determining the consumer basket and the subsistence minimum for the whole of the Russian Fed-
eration and for the constituent entities of the Russian Federation.
The consumer basket includes a minimum set of food products (in physical terms), as well as non-food goods and services, the cost of
which is determined in relation to the cost of a minimum set of food products (in the amount of 50% of the cost of food), necessary to pre-
serve human health and ensure Its vital activity and is established by the Federal law - as a whole for the Russian Federation, legislative
(representative) bodies of constituent entities of the Russian Federation.
Cost estimate of the consumer basket for the whole the Russian Federation is carried out on the basis of the Federal Law of December
3, 2012 No. 227-FZ "On the consumer basket in the whole of the Russian Federation" (in 2000 - 2004 it was determined on the basis of the
Federal Law of November 20 1999 № 201-ФЗ, in 2005-2012 - on the basis of the Federal Law of March 31, 2006 No. 44-ФЗ) and Rosstat's
data on the level of consumer prices for food and consumer price indices for food, non-food products and services. Monitoring the level of
consumer prices for food and consumer price indices for food, non-food products and services for the calculation of the subsistence mini-
mum for the whole of the Russian Federation is carried out by the state statistical bodies in all constituent entities of the Russian Federation
according to the List of food products-representatives, which includes 42 items.
Minimum subsistence level is determined quarterly as average per capita as well as for three socio-demographic groups of population
(working age population, pensioners, children) and is set: for the Russian Federation as a whole - by the Government of the Russian Fed-
eration and for constituent entities of the Russian Federation -by
executive authorities of constituent entities
of the Russian Federation.
Tables 6.1, 6.2, 6.17. Population with money income below the subsistence minimum level is determined using data on the distri-
bution of population according to the level of average per capita money income and is a result of their comparison with the subsistence
minimum level. This indicator is being calculated since 1992.
Tables 6.1, 6.4. Actual final consumption of households includes expenditures on purchasing of consumer goods and services and
also cost of consumption of goods and services in kind - produced for itself, received as a remuneration and social transfers in kind, i.e. gra-
tuities and individual goods and services, received from state administration sector and non-profit institutions serving households.
Tables 6.1, 6.5. Real disposable money income is relative indicator, calculated by dividing the index of nominal value (i.e., actually
existing in the reporting period) of disposable money incomes of population by the consumer price index for respective period. Disposable
money income of population is money income after deduction of compulsory payments and contributions.
Tables 6.1, 6.5, 6.8. Actual rate of pensions - relative indicator, calculated by dividing of index of nominal pension rate (i.e. actually
existing in the reporting period) by the consumer price index for the respective time period.
Table 6.2. Real money income - relative indicator, which is calculated by dividing of index of nominal value (i.e., actually existing in the
reporting period) of money income of population by consumer price index for respective period of time. Indicator for the Russian Federation
as a whole is being calculated since 1992, by constituent entities of the Russian Federation - since 1994.
Table 6.3. Property income arises as a result of lending or leasing financial or material non-productive assets, including land, to other
units for use in production activities.
Households receive the following property income: interest (on deposits and securities (except shares), dividends on shares, rent, prop-
erty income imputed to households - holders of insurance policies.) Households pay as property income the interests on received loans and
rents. The balance of property income is the difference between the income received and paid out.
The difference between current transfers received by households and transferred.
Received current transfers include social benefits, insurance reimbursements, non-capital gifts, etc.
172
Российский статистический ежегодник. 2017
6. УРОВЕНЬ ЖИЗНИ НАСЕЛЕНИЯ / LIVING STANDARDS OF POPULATION
Transferred current transfers include current taxes on income and property, insurance payments, social insurance contributions, volun-
tary contributions, fines, etc.
Gross disposable household income is the amount of income derived from the primary distribution (wages and salaries, mixed
incomes, net property incomes), and as the result of redistribution of income in a monetary form (current transfers).
Table 6.6. Money income of population includes income of persons engaged in entrepreneurial activities, paid wages of employees
(accrued remuneration, adjusted for the change in arrears), social benefits (pensions, benefits, scholarships, insurance reimbursement and
other transfers), property income in the form of interest on deposits, securities, dividends and other income.
Tables 6.8-6.10. Pensioners are persons who have the right to receive pensions in accordance with legislation of the Russian Federa-
tion and international agreements and who are residents of the Russian Federation.
Table 6.12. Data on minimum social guarantees are given on the basis of regulatory legal acts that were in force on the date speci-
fied in the table. 2000 data are provided on the minimum old-age pension. 2010 data are provided on the size of base part of labour old-age
pension (as of end of 2009). Since January 1, 2015 in accordance with the Federal law of December 28, 2013 No. 400-FZ "On Insurance Pen-
sions" the concept of "Fixed payment to insurance pensions" is introduced.
Table 6.14. Distribution of population by average per capita money incomes is disparity of population in terms of material wealth
and is an indicator of number (or shares) of resident population, grouped in specified range by level of average per capita money income.
Series of distribution are constructed using the method of modeling in accordance with the methodology approved by the Goskomstat of
Russian of July 16, 1996 № 61 in consultation with relevant ministries and departments, by transforming of empirical distribution, obtained
on basis of household budget sample survey, in range of distribution that corresponds to a grouping variable in the general universe
(average per capita money income, obtained from the annual calculation of money incomes and expenditures of population ).
Median per capita money income (median) is defined as income level for which one half of population has per capita money income below
the median, the other half of population has per capita money income above the median.
Modal per capita money income is value of per capita money income, most commonly occurring in the population distribution by average
per capita money income.
Table 6.15. Distribution of total income across different groups of populations is expressed as a share of total income that is
attributable to each of the 20 percentage groups, ranked by increasing of average per capita incomes.
Coefficient of funds (income difference’s coefficient) is the degree of social stratification and is defined as a ratio between the aver-
age levels of money income of 10 percent of population with the highest income and 10 percent of population with the lowest income.
Gini coefficient (index of concentration of income) is the level of deviation of the actual volume of distribution of income of popula-
tion from the line of their even distribution. The value of coefficient may vary from 0 to 1. The higher the value of the indicator, the less even
is the distribution of income in the society.
Table 6.17. Gap of money income is defined as the amount of money required to bring the income of population receiving income
below the subsistence minimum to the minimum subsistence level.
Number of low income people / households is determined using data of sample survey of household budgets by comparing incomes
of each household surveyed with the subsistence minimum. In this case, the minimum subsistence level for a household is generally defined
in terms of its composition as sum of relevant indicators fixed in the selected constituent entity of the Russian Federation for the different
socio-demographic groups, and income is the sum of money and in-kind income that were at the disposal of the household during the
reference period of the survey to ensure all expenditures (both for consumption and non-consumption) and savings.
Table 6.20. Money expenditures and savings of population include the cost of purchasing goods and services, compulsory fees and
a variety of contributions (taxes, fees, insurance payments, contributions to social and cooperative organizations, interest rate for loans,
etc.), property acquisition, growth of financial assets.
Growth of financial assets consists of increase (decrease) in deposits on accounts of citizens, currency in hand, cost of acquisition of
securities, foreign currency, purchase of cattle and poultry by population, changes in accounts of individual entrepreneurs, changes in the
indebtedness on loans.
Table 6.21. The level and structure of household money income are based on the results of sampling observation of the incomes of the
population and participation in social programs, which is carried out by Rosstat, in all constituent entities of the Russian Federation. Obser-
vation is carried out by a sampling method with coverage in 2012 of ten thousand households, in 2014-2015 of forty five thousand house-
holds. Starting since 2016 of
60,000 households, in 2017 and every next five years - an increase in coverage to 160,000 households. The
monitoring program is based on interviewing of household members on the basis of the results for the calendar year preceding the year of
survey. The observation unit for the Sample Survey of Income of Population and Participation in Social Programs is a private household and
members of a household aged 16 and over.
Tables 6.22-6.27. Household budget sample survey is a method of statistical observation of the level of living standards of population.
The frame of study and dissemination of budget survey data are defined by the following goals: to compile data on distribution of popula-
tion by levels of welfare; to get weighting indicators to calculate the consumer price index, to supply data for compilation of accounts of
household sector in the System of National Accounts.
Household Budget Survey is conducted on a quarterly basis in all constituent entities of the Russian Federation by sampling method
and covers 48.5 thousand households. Results of the survey are compiled quarterly and for each year as a whole.
Program of survey is based on the household records of current expenditures and interviews with members of households at the end of
reference period of survey.
Starting 1997, the two-stage random sampling built up by territorial principles has been used to form sample frame of households.
Ultimate sampling unit is a household (except for collective and institutional households), which is the totality of persons living in the same
dwelling or in its part, both related and unrelated by relationships of kinship, jointly providing themselves with food and other essentials for
life, i.e. fully or partially integrating and spending their funds. A household may consist of one person living independently.
Observation units are households and their members. The sample provides the representative data of survey for the federal and
regional levels (constituent entities of the Russian Federation).
Российский статистический ежегодник. 2017
173
6. УРОВЕНЬ ЖИЗНИ НАСЕЛЕНИЯ / LIVING STANDARDS OF POPULATION
Table 6.22. Household final consumption expenditure consists of consumer spending, as well as estimates in monetary terms of the
value in kind of food and non-food goods and services. The final consumption expenditure does not include the value of the goods if they
were not acquired for own consumption.
Tables 6.23, 6.24. Household consumption expenditures are part of the monetary outflows for purchases of consumer goods and
services. Their composition does not include the purchase of art, antiques and jewelry goods acquired as capital investments, the payment
for materials and work on construction and capital repairs of dwellings and subsidiary premises, which refer to investments.
Collection and processing of statistical information, characterizing the level and structure of consumer expenditures during the
household’s budget survey, are carried out using the Classification of Individual Household Consumption by Purpose . The classification is
deve-loped by Rosstat in 2001 on the basis of the Classification of Individual Consumption by Purpose (COICOP), which is one of the
functional classifications of the SNA and serves as a tool of the standard grouping of household’s expenditures for personal consumption.
Tables 6.30, 6.32-6.34. Housing stock is the aggregate of all dwellings located on the territory of the Russian Federation.
Dwelling is an isolated room which is real estate and suitable for permanent living of citizens (which meets established sanitary and
technical rules, norms and other legal requirements).
Housing stock does not include cottages (dachas), summer garden houses, sporting and tourist centers, motels, campings, sanatorium,
health resorts, holiday hotels, visitors’ houses, hotels, barracks, monks’ cells, railway carriages and other lodgings.
In the absence of a regulatory act, which establishes the procedure for state registration of housing stock in the Russian Federation, in-
cluding its state technical registration (including technical inventory), since 2014 the official statistical information is compiled without using a
full scope of accounting units.
Table 6.37. Subsidies for the payment of housing and utilities are targeted social assistance which are provided to citizens by ex-
ecutive authorities of the constituent entities of the Russian Federation and local government bodies in case their expenses for payment of
housing and utilities, calculated on the basis of the size of the regional standard of normative area of the dwelling used for the calculation of
subsidies, and the size of the regional standard for the cost of housing and communal services, exceed the value corresponding to the
maximum allowable share of expenses of citizens on payment of premises and utilities in the total family income.
Table 6.38. Social support for the payment of housing and communal services is provided in accordance with the current legisla-
tion to certain categories of citizens, including jointly with living members of their families (if this is provided for in the legislation correspond-
ing to this category of citizens) in the form of a discount to the accrued amount of payment for living space and communal services or in the
form of a monetary payment to a citizen through bank accounts, communication organizations or in another way.
In the section data for 2014 are given without taking into account the information on the Crimean Federal District (except for Tables 6.3,
6.4, 6.6, 6.7, 6.9-6.16, 6.28-6.36).
Table 6.39. Distribution of households by types and provision of amenities of occupied premises was obtained based on the re-
sults of the Comprehensive Survey of Living Conditions of Population, for the first time conducted by state statistics bodies in 2011 in
all constituent entities of the Russian Federation by a sampling method with coverage of 10,000 households. Starting since 2014, observa-
tion is conducted once every two years with coverage of 60,000 households.
Tables 6.40-6.42. Distribution of households by types and provision of amenities of occupied premises, by living area, which is on aver-
age per resident, is based on the results of the Comprehensive Survey of Living Conditions of Population, which is conducted by Rosstat in
all constituent entities of the Russian Federation. The observation is based on a sample survey of representatives of various groups and
strata of the population living in all constituent entities of the Russian Federation, with a frequency of once every two years and coverage of
60,000 households. The monitoring program is based on a personal interview of household members.
174
Российский статистический ежегодник. 2017
7. ОБРАЗОВАНИЕ
EDUCATION
В разделе информация приведена по данным Росстата и Минобрнауки России, Минздрава России, Минспорта России, Мин-
культуры России.
Показатели деятельности, характеризующие уровень и тенденции развития образования в стране, публикуются также в стати-
стическом сборнике «Образование в Российской Федерации»; показатели деятельности образовательных организаций по уровням
образования с использованием Международной стандартной классификации образования - в статистическом сборнике «Индикато-
ры образования».
Указанные публикации подготавливаются Национальным исследовательским университетом «Высшая школа экономики» со-
вместно с Министерством образования и науки Российской Федерации и Федеральной службой государственной статистики
This section provides data from the Federal State Statistics Service (Rosstat), the Ministry of Education and Science of the Russian
Federation, the Ministry of Healthcare and Social Development of the Russian Federation, the Ministry of Sport of the Russian Federation,
and the Ministry of Culture of the Russian Federation.
Indicators of educational development in the country are also published in the statistical collection "Education in the Russian
Federation"; indicators of educational establishments by stages of education - in accordance to International Standard Classification of
Education - are published in the statistical collection "Education indicators".
These publications are prepared by the National Research University "Higher School of Economics" in cooperation with the Ministry of
Education and Science of the Russian Federation and the Federal State Statistics Service (http://www.hse.ru/primarydata).
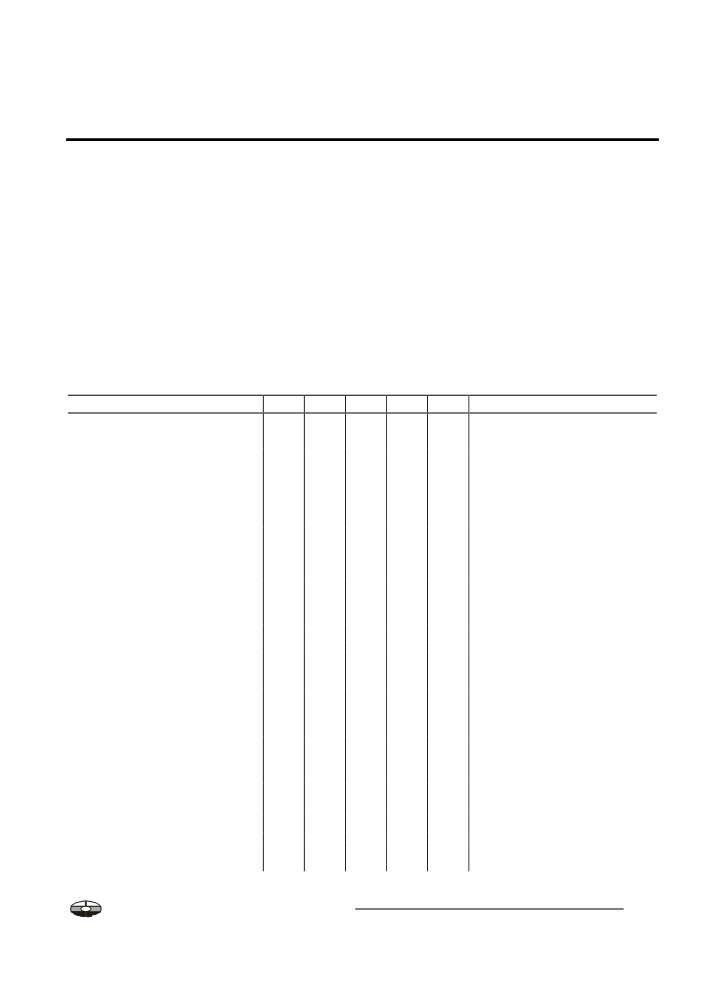
7.1. ОСНОВНЫЕ ПОКАЗАТЕЛИ ОБРАЗОВАНИЯ
MAIN INDICATORS OF EDUCATION
2000
2010
2014
2015
2016
Число организаций, осуществляющих образова-
тельную деятельность по образовательным
Number of establishments carrying out education
программам дошкольного образования, присмотр
activities on education programs of preschool
и уход за детьми1), тыс.
51,3
45,1
51,0
50,1
49,4
education, supervision and childcare 1), thou.
Численность воспитанников в организациях,
осуществляющих образовательную деятельность
Number of pupils in establishments carrying out
по образовательным программам дошкольного
education activities on education programs of
образования, присмотр и уход за детьми2),
preschool education, supervision and childcare 2),
тыс. человек
4263,0
5388,0
6813,6
7151,6
7342,9
thou. persons
Число организаций, осуществляющих образова-
тельную деятельность по образовательным
Number of establishments carrying out training
программам начального, основного и среднего
programs for primary, basic and secondary gen-
общего образования, тыс.
68,8
50,8
44,8
43,4
42,6
eral education, thou.
Численность обучающихся по образовательным
Number of pupils in primary, basic and
программам начального, основного и среднего
secondary general education programs,
общего образования, тыс. человек
20550,2
13642,4
14398,9
14770,4
15219,0
thou. persons
Охват детей и подростков образовательными
Coverage of children and adolescents by primary,
программами начального, основного и среднего
basic and secondary general education
общего образования, процентов
91,6
98,5
100,8
100,5
101,1
programs, percent
Число образовательных организаций, осущест-
вляющих образовательную деятельность по
программам подготовки квалифицированных
Number of vocational education establishments
рабочих, служащих и специалистов среднего
for skilled workers, employees and mid-level
звена3)
2703
2850
2909
2891
3934
specialists 3)
Численность студентов, обучающихся
Students in professional training programs,
по программам подготовки, тыс. человек
4040
3133
2830
2866
2868
thou. persons
квалифицированных рабочих, служащих
1679
1007
727
686
563
for skilled workers, employees
специалистов среднего звена
2361
2126
2103
2180
2305
for mid-level specialists
На 10 000 человек населения численность сту-
дентов, обучающихся по программам подготовки,
Students in professional training programs
человек
per 10 000 population, persons
квалифицированных рабочих, служащих
115
70
50
47
38
for skilled workers, employees
специалистов среднего звена
162
149
144
149
157
for mid-level specialists
Принято на обучение в образовательные органи-
Number of students admitted to vocational
зации по программам подготовки,
education establishments by program type,
тыс. человек
1712
1314
1089
1095
951
thou. persons
квалифицированных рабочих, служащих
845
609
416
396
224
for skilled workers, employees
специалистов среднего звена
867
705
673
699
727
for mid-level specialists
Коэффициент приема на обучение
по программам подготовки специалистов
Admission rate of training programs
среднего звена, процентов
35,1
49,0
51,9
50,8
54,0
for mid-level specialists, percent
Выпущено, тыс. человек:
1342
1153
854
814
668 Number of graduated, thou. persons:
квалифицированных рабочих, служащих
763
581
403
368
199
skilled workers, employees
специалистов среднего звена
579
572
451
446
469
mid-level specialists
На 10 000 человек занятого населения выпуще-
Graduates per 10 000 employed population,
но, тыс. человек
thou. persons
квалифицированных рабочих, служащих
118
86
56
51
27
skilled workers, employees
специалистов среднего звена
90
85
67
62
65
mid-level specialists
Коэффициент выпуска по программам подготов-
Graduation rate on training programs
ки специалистов среднего звена, процентов
23,6
32,2
32,5
34,1
34,7
for mid-level specialists, percent
Российский статистический ежегодник. 2017
175
7. ОБРАЗОВАНИЕ / EDUCATION
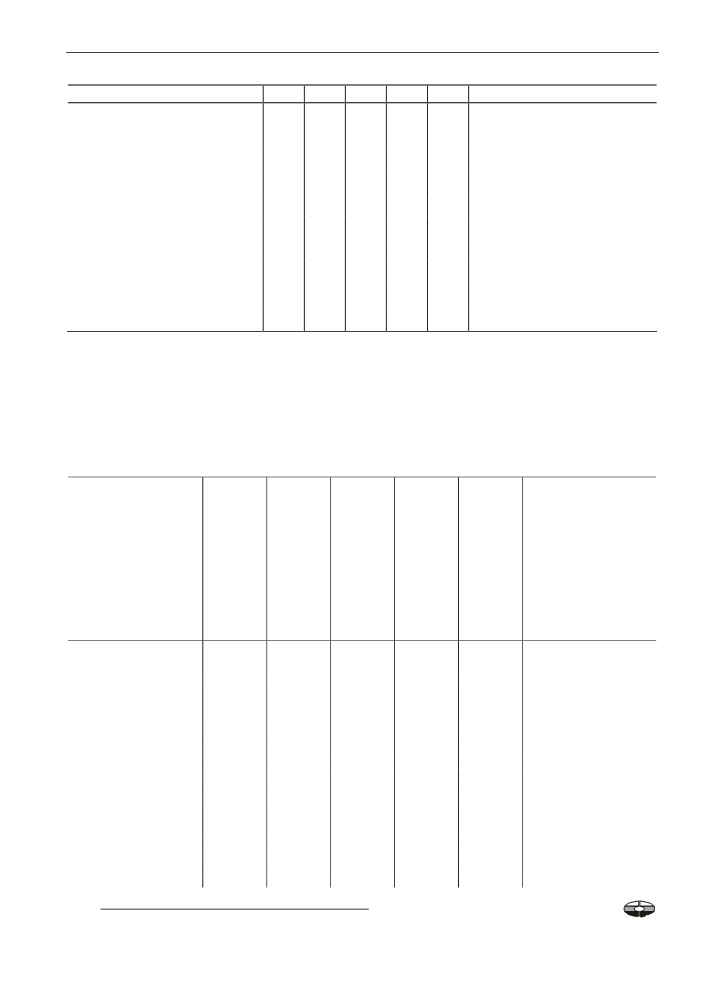
Продолжение табл. / Continued table 7.1
2000
2010
2014
2015
2016
Число образовательных организаций высшего
образования и научных организаций, осущест-
Number of higher professional education
вляющих образовательную деятельность по про-
establishments and scientific organizations carry-
граммам бакалавриата, специалитета,
ing out educational activities on training programs
магистратуры4)
965
1115
950
896
818
of bachelor, specialist, master 4)
Численность студентов, обучающихся
по программмам бакалавриата, специалитета,
Number of students studying on bachelor,
магистратуры, тыс. человек
4741
7050
5209
4766
4399
specialist, master programs, thou. persons
Численность студентов, обучающихся
Number of students studying on bachelor,
по программам бакалавриата, специалитета,
specialist, master programs per 10 000
магистратуры, на 10 000 человек населения
324
493
356
325
300
population
Прием на обучение по программам бакалавриа-
Admission to study on bachelor, specialist,
та, специалитета, магистратуры, тыс. человек
1292
1399
1192
1222
1158
master programs, thou. persons
Коэффициент приема на обучение
по программам бакалавриата, специалитета,
Admission rate to study on bachelor, specialist,
магистратуры, процентов
50,1
91,1
90,6
90,1
89,0
master programs, percent
Выпущено бакалавров, специалистов, магистров,
Number of graduated bachelors, specialists and
тыс. человек
635
1468
1226
1300
1161
masters, thou. persons
Number of graduated bachelors, specialists and
Выпущено бакалавров, специалистов, магистров
masters per 10 000 employed population,
на 10 000 занятых, человек
99
217
171
180
160
persons
Коэффициент выпуска по программам бакалав-
Graduation rate by bachelor, specialist, master
риата, специалитета, магистратуры, процентов
28,8
60,2
67,3
82,5
74,8
programs, percent
Охват молодежи образовательными программа-
Coverage of young people by programs of
ми среднего профессионального и высшего
secondary vocational and higher professional
образования, процентов
20,5
23,8
20,0
19,5
18,9
education, percent
1) До 2014 г. - число дошкольных образовательных организаций.
2) До 2014 г. - численность воспитанников в дошкольных образовательных организациях.
3) До 2016 г. - число профессиональных образовательных организаций.
4) До 2016 г. - число образовательных организаций высшего образования.
1) Before 2014 - number of preschool education establishments.
2) Before 2014 - number of pupils in preschool education establishments.
3) Before 2016 - number of vocational education establishments.
4) Before 2016 - number of higher professional education establishments.
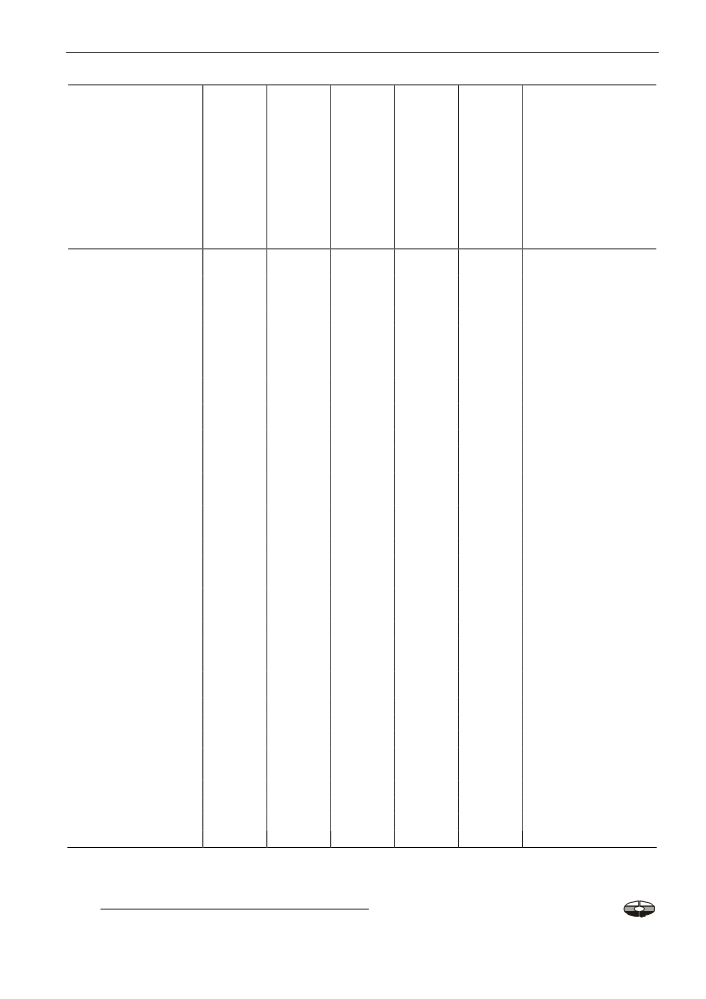
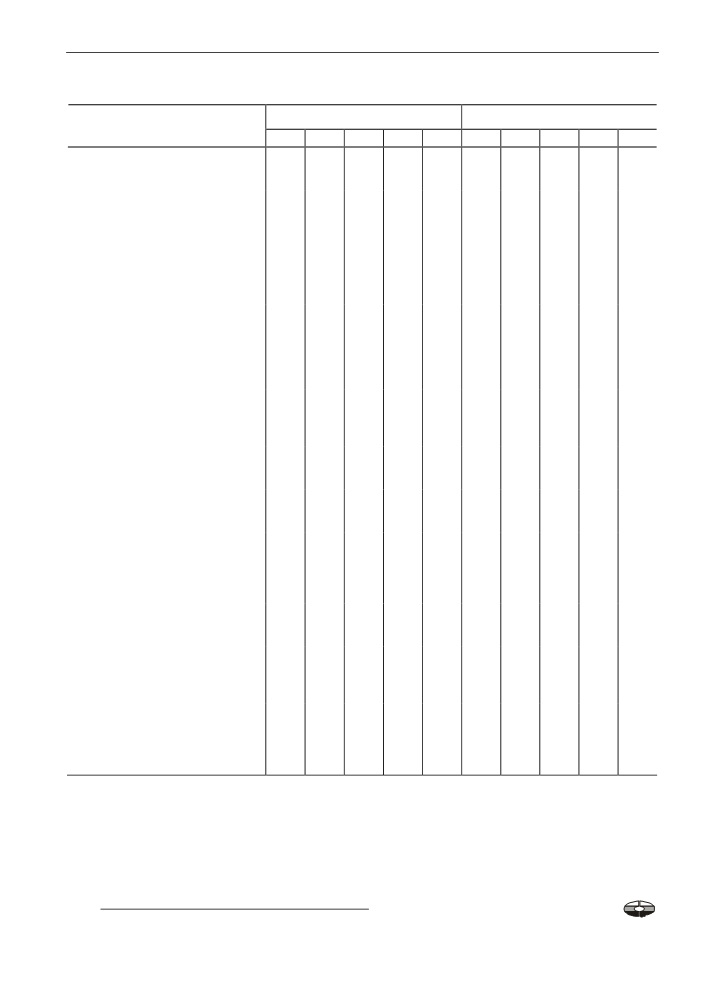
7.2. ЧИСЛЕННОСТЬ ВОСПИТАННИКОВ, ОБУЧАЮЩИХСЯ, СТУДЕНТОВ ПО УРОВНЯМ ОБРАЗОВАНИЯ
ПО СУБЪЕКТАМ РОССИЙСКОЙ ФЕДЕРАЦИИ в 2016 г.
NUMBER OF PUPILS, STUDENTS BY LEVELS OF EDUCATION BY CONSTITUENT ENTITIES
OF THE RUSSIAN FEDERATION in 2016
(тысяч человек / thou. persons)
Численность
Численность
Численность
Численность
Численность
воспитанников
обучающихся
студентов,
студентов,
студентов,
в организациях,
по образова-
обучающихся
обучающихся
обучающихся
осуществляющих
тельным про-
по программам
по программам
по программам
образовательную
граммам началь-
подготовки ква-
подготовки
бакалавриата,
деятельность
ного, основного
лифицированных
специалистов
специалитета,
по образова-
и среднего обще-
рабочих,
среднего звена
магистратуры
тельным про-
го образования
служащих
Number
Number of
граммам до-
Number of pupils
Number
of students
students in
школьного обра-
in primary, basic
of students
in professional
bachelor’s,
зования, при-
and secondary
in professional
training programs
specialist’s,
смотр и уход
general education
training programs
for mid-level
master’s
за детьми
establishments
for skilled workers,
specialists
programs
Number of pupils
employees
in preschool
education,
supervision
and childcare
establishments
Российская Федерация
7342,9
15219,0
563,0
2304,8
4399,5
Russian Federation
Центральный
Central
федеральный округ
1702,3
3569,8
104,9
492,8
1359,6
Federal District
Белгородская область
71,9
152,7
5,5
23,3
50,6
Belgorod Region
Брянская область
57,0
122,7
4,7
19,1
30,7
Bryansk Region
Владимирская область
75,1
137,3
6,1
20,0
30,8
Vladimir Region
Воронежская область
96,1
212,1
8,1
34,7
88,9
Voronezh Region
Ивановская область
52,0
95,6
4,2
14,6
28,5
Ivanovo Region
Калужская область
48,5
101,1
2,3
15,0
19,1
Kaluga Region
Костромская область
37,3
68,2
2,8
11,0
11,4
Kostroma Region
Курская область
42,3
110,2
5,6
21,3
44,5
Kursk Region
Липецкая область
52,5
115,7
6,0
17,5
22,2
Lipetsk Region
Московская область
380,6
776,5
16,5
71,2
86,8
Moscow Region
Орловская область
33,6
73,2
2,8
12,5
30,7
Orel Region
Рязанская область
47,4
103,1
3,1
20,8
33,0
Ryazan Region
Смоленская область
41,0
88,6
3,0
15,2
24,3
Smolensk Region
Тамбовская область
45,2
92,3
5,6
18,8
29,7
Tambov Region
Тверская область
63,4
131,8
4,5
20,0
25,8
Tver Region
Тульская область
61,2
132,7
6,0
20,2
32,5
Tula Region
Ярославская область
70,2
126,1
8,3
20,9
33,8
Yaroslavl Region
г. Москва
426,9
929,7
9,9
116,8
736,3
Moscow city
176
Российский статистический ежегодник. 2017

7. ОБРАЗОВАНИЕ / EDUCATION
Продолжение табл./ Continued table 7.2
Численность
Численность
Численность
Численность
Численность
воспитанников
обучающихся
студентов,
студентов,
студентов,
в организациях,
по образова-
обучающихся
обучающихся
обучающихся
осуществляющих
тельным про-
по программам
по программам
по программам
образовательную
граммам началь-
подготовки ква-
подготовки
бакалавриата,
деятельность
ного, основного
лифицированных
специалистов
специалитета,
по образова-
и среднего обще-
рабочих,
среднего звена
магистратуры
тельным про-
го образования
служащих
Number
Number of
граммам до-
Number of pupils
Number
of students
students in
школьного обра-
in primary, basic
of students
in professional
bachelor’s,
зования, при-
and secondary
in professional
training programs
specialist’s,
смотр и уход
general education
training programs
for mid-level
master’s
за детьми
establishments
for skilled workers,
specialists
programs
Number of pupils
employees
in preschool
education,
supervision
and childcare
establishments
Северо-Западный
North West
федеральный округ
737,5
1329,3
56,4
199,4
430,3
Federal District
Республика Карелия
35,4
68,1
2,8
10,2
12,1
Republic of Karelia
Республика Коми
60,0
100,7
5,5
15,2
17,1
Komi Republic
Архангельская область
70,3
131,2
8.2
18,7
19,1
Arkhangelsk Region
в том числе:
including:
Ненецкий автономный округ
3,4
6,2
0,3
0,8
-
Nenets Autonomous Area
Архангельская область
Arkhangelsk Region less
без автономного округа
66,9
125,0
8,0
17,8
19,1
autonomous area
Вологодская область
76,9
129,1
5,8
18,5
20,8
Vologda Region
Калининградская область
49,2
102,3
3,5
17,0
24,7
Kaliningrad Region
Ленинградская область
77,6
146,2
4,1
14,0
8,9
Leningrad Region
Мурманская область
47,4
79,0
2,9
13,5
9,8
Murmansk Region
Новгородская область
37,1
61,8
2,6
9,5
11,5
Novgorod Region
Псковская область
29,1
64,7
2,9
8,6
12,8
Pskov Region
г. Санкт-Петербург
254,6
446,1
18,0
74,1
293,4
Sankt-Petersburg city
Южный
South
федеральный округ
734,6
1694,0
71,9
264,6
434,4
Federal District
Республика Адыгея
22,4
48,2
1,4
6,5
11,8
Republic of Adygeya
Республика Калмыкия
14,9
32,6
1,2
5,7
9,7
Republic of Kalmykia
Республика Крым
69,5
194,8
8,2
18,3
43,4
Republic of Crimea
Краснодарский край
272,4
611,1
23,2
93,2
119,5
Krasnodar Territory
Астраханская область
51,0
113,3
4,0
20,7
32,1
Astrakhan Region
Волгоградская область
110,2
246,1
10,2
43,4
65,3
Volgograd Region
Ростовская область
177,5
407,0
21,8
72,1
138,6
Rostov Region
г. Севастополь
16,7
40,9
1,9
4,6
14,0
Sevastopol city
Северо-Кавказский
North-Caucasian
федеральный округ
405,2
1215,4
29,7
149,8
229,7
Federal District
Республика Дагестан
91,0
381,6
7,5
40,1
62,0
Republic of Daghestan
Республика Ингушетия
11,2
64,1
2,0
5,7
8,1
Republic of Ingushetia
Кабардино-Балкарская
Kabardino-Balkarian
Республика
50,6
95,9
3,4
12,9
15,2
Republic
Карачаево-Черкесская
Karachayevo-Chirkassian
Республика
19,5
51,5
0,8
6,5
11,2
Republic
Республика Северная
Republic of North
Осетия - Алания
35,1
82,3
3,4
10,8
24,8
Ossetia - Alania
Чеченская Республика
69,0
262,1
6,4
26,7
33,3
Chechen Republic
Ставропольский край
128,7
277,7
6,1
47,2
75,3
Stavropol Territory
Приволжский
Privolzhsky (Volga)
федеральный округ
1600,8
3037,9
126,4
523,3
880,5
Federal District
Республика Башкортостан
236,2
456,6
27,4
71,7
105,4
Republic of Bashkortostan
Республика Марий Эл
38,4
72,8
2,0
12,1
18,8
Republic of Mari El
Республика Мордовия
34,2
70,6
3,0
13,5
28,5
Republic of Mordovia
Республика Татарстан
217,4
390,3
14,2
71,7
153,0
Republic of Tatarstan
Удмуртская Республика
102,2
173,6
8,8
27,6
47,9
Udmurtian Republic
Чувашская Республика
76,5
130,1
6,3
20,8
36,3
Chuvash Republic
Пермский край
165,5
300,9
13,6
51,2
60,3
Perm Territory
Кировская область
70,2
132,3
4,9
22,2
33,6
Kirov Region
Нижегородская область
174,1
309,5
11,7
53,2
90,9
Nizhny Novgorod Region
Оренбургская область
112,1
220,4
9,1
39,3
48,8
Orenburg Region
Пензенская область
58,2
118,9
4,7
20,2
37,3
Penza Region
Самарская область
154,8
314,2
7,8
58,3
102,8
Samara Region
Саратовская область
104,3
232,9
8,8
42,2
80,0
Saratov Region
Ульяновская область
56,7
114,8
3,9
19,4
36,8
Ulyanovsk Region
Российский статистический ежегодник. 2017
177
7. ОБРАЗОВАНИЕ / EDUCATION
Продолжение табл./ Continued table 7.2
Численность
Численность
Численность
Численность
Численность
воспитанников
обучающихся
студентов,
студентов,
студентов,
в организациях,
по образова-
обучающихся
обучающихся
обучающихся
осуществляющих
тельным про-
по программам
по программам
по программам
образовательную
граммам началь-
подготовки ква-
подготовки
бакалавриата,
деятельность
ного, основного
лифицированных
специалистов
специалитета,
по образова-
и среднего обще-
рабочих,
среднего звена
магистратуры
тельным про-
го образования
служащих
Number
Number of
граммам до-
Number of pupils
Number
of students
students in
школьного обра-
in primary, basic
of students
in professional
bachelor’s,
зования, при-
and secondary
in professional
training programs
specialist’s,
смотр и уход
general education
training programs
for mid-level
master’s
за детьми
establishments
for skilled workers,
specialists
programs
Number of pupils
employees
in preschool
education,
supervision
and childcare
establishments
Уральский
Ural
федеральный округ
782,2
1397,3
50,6
225,0
328,2
Federal District
Курганская область
45,3
97,1
3,7
14,9
17,9
Kurgan Region
Свердловская область
255,8
470,0
18,5
90,1
121,1
Sverdlovsk Region
Тюменская область
252,6
454,6
13,2
55,4
87,9
Tyumen Region
в том числе:
including:
Ханты-Мансийский автоном-
ный
Khanty-Mansi Autonomous
округ - Югра
109,3
202,7
6,0
22,2
25,5
Area - Yugra
Ямало-Ненецкий автономный
Yamal-Nenets Autonomous
округ
39,4
71,8
2,2
6,9
1,6
Area
Тюменская область
Tyumen Region less autono-
без автономных округов
103,9
180,1
5,0
26,3
60,8
mous areas
Челябинская область
228,5
375,7
15,3
64,6
101,3
Chelyabinsk Region
Сибирский
Siberian
федеральный округ
1043,5
2253,5
94,3
336,7
575,1
Federal District
Республика Алтай
14,4
35,1
1,0
4,9
3,1
Republic of Altay
Республика Бурятия
59,1
135,4
5,9
19,5
28,7
Republic of Buryatia
Республика Тыва
21,6
62,0
2,8
6,2
4,4
Republic of Tuva
Республика Хакасия
34,1
64,0
3,3
8,1
8,6
Republic of Khakassia
Алтайский край
112,5
259,8
13,4
33,9
52,1
Altay Territory
Забайкальский край
56,3
142,4
6,5
20,0
24,4
Trans-Baikal Territory
Красноярский край
149,5
321,3
14,7
48,5
81,2
Krasnoyarsk Territory
Иркутская область
147,9
305,6
12,6
45,1
71,7
Irkutsk Region
Кемеровская область
145,9
301,0
12,8
47,4
52,6
Kemerovo Region
Новосибирская область
140,8
301,7
8,4
42,3
105,6
Novosibirsk Region
Омская область
104,2
211,2
8,9
41,5
83,0
Omsk Region
Томская область
57,3
114,0
4,0
19,2
59,8
Tomsk Region
Дальневосточный
Far East
федеральный округ
336,7
721,7
28,7
113,2
161,8
Federal District
Республика Саха (Якутия)
67,6
140,6
5,1
21,1
24,3
Republic of Sakha (Yakutia)
Камчатский край
18,2
35,4
1,3
5,3
5,3
Kamchatka Territory
Приморский край
89,9
208,6
7,1
33,5
51,4
Primorye Territory
Хабаровский край
70,0
139,4
6,5
24,9
50,5
Khabarovsk Territory
Амурская область
40,9
97,2
4,2
16,0
16,8
Amur Region
Магаданская область
8,9
16,5
1,1
2,5
3,6
Magadan Region
Сахалинская область
27,8
56,2
2,3
7,4
7,4
Sakhalin Region
Еврейская автономная область
9,6
20,3
1,0
1,8
2,3
Jewish Autonomous Region
Чукотский автономный округ
3,8
7,5
-
0,7
0,3
Chukotka Autonomous Area
178
Российский статистический ежегодник. 2017
7. ОБРАЗОВАНИЕ / EDUCATION
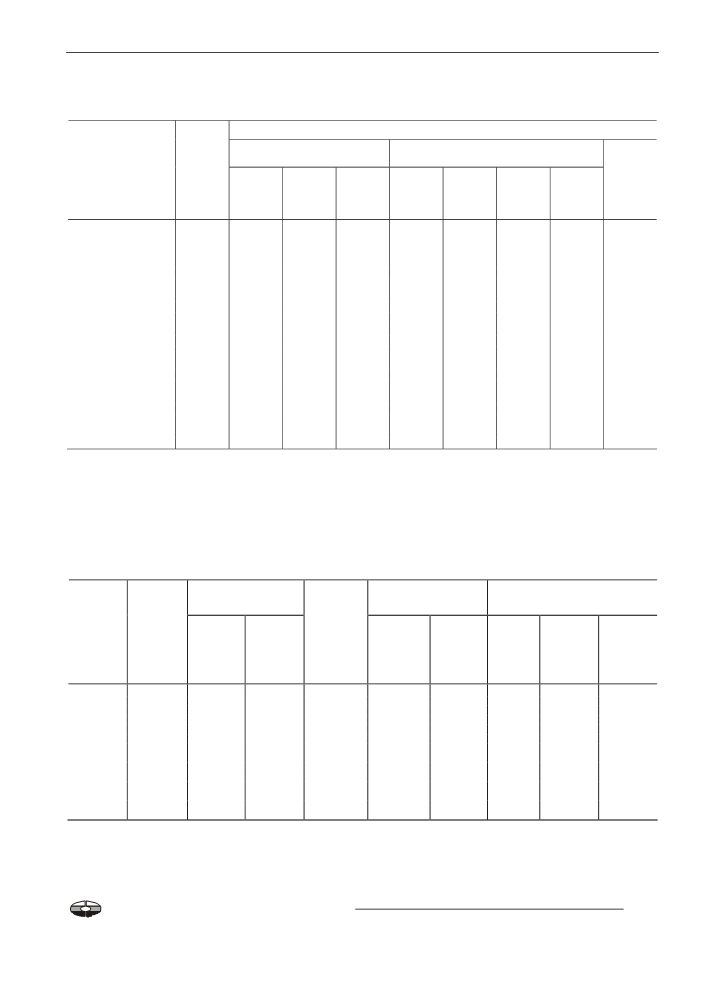
7.3. УРОВЕНЬ ОБРАЗОВАНИЯ НАСЕЛЕНИЯ ПО ВОЗРАСТНЫМ ГРУППАМ
по данным микропереписи населения 2015 года
EDUCATIONAL ATTAINMENT OF POPULATION BY AGE GROUPS
data of the 2015 micro census of population
Указавшие
На 1000 человек соответствующего возраста, указавших уровень образования, приходится лиц
уровень об-
Per 1000 persons of the respective age group indicated the level of education
разования,
имеющих профессиональное
имеющих общее образование
не имеющих
человек
образование
образования
with general education
Indicated
with vocational education
have no pri-
level of educa-
высшее
неполное
среднее
среднее
основное
начальное
дошкольное
mary educa-
tion,
higher
высшее
secondary
(полное)
(неполное
basic
preschool
tion
persons
(незакончен-
secondary
среднее)
ное высшее)
(complete)
secondary
higher
(incomplete)
incomplete
Все население
в возрасте
6 лет и более
Total population aged
6 years and over
1992713
231
25
361
160
91
78
46
8
6 - 7
51565
-
-
-
-
-
-
927
73
8 - 9
45702
-
-
-
-
-
-
945
55
10 - 14
109595
-
-
-
-
73
899
-
28
15 - 17
59226
-
-
2
238
605
145
-
10
18 - 19
35436
-
144
187
517
139
7
-
6
20 - 24
112808
239
142
350
210
51
4
-
4
25 - 29
168378
409
44
362
132
46
4
-
3
30 - 34
166184
401
31
372
139
49
5
-
3
35 - 39
156372
357
22
403
152
59
4
-
3
40 - 44
146584
315
17
456
158
49
3
-
2
45 - 49
135579
282
16
500
161
36
3
-
2
50 - 54
158461
243
13
513
188
38
3
-
2
55 - 59
175050
215
11
511
206
52
4
-
1
60 - 64
151608
201
10
485
209
86
8
-
1
65 - 69
113435
205
10
448
195
123
18
-
1
70 и более / and over
206730
137
7
278
146
232
191
-
9
ДОШКОЛЬНОЕ ОБРАЗОВАНИЕ
PRESCHOOL EDUCATION
7.4. ОРГАНИЗАЦИИ, ОСУЩЕСТВЛЯЮЩИЕ ОБРАЗОВАТЕЛЬНУЮ ДЕЯТЕЛЬНОСТЬ ПО ОБРАЗОВАТЕЛЬНЫМ ПРОГРАММАМ
ДОШКОЛЬНОГО ОБРАЗОВАНИЯ, ПРИСМОТР И УХОД ЗА ДЕТЬМИ1)
на конец года
PRESCHOOL EDUCATION, SUPERVISION AND CHILDCARE ESTABLISHMENTS1)
end of year
Годы
Число
в том числе
Численность
в том числе
На 1000 детей в возрасте 1-6 лет приходится
организаций -
воспитанников -
мест
Year
including
including
всего, тыс.
всего2),
Number of places per 1000 children aged 1-6 years
тыс. человек
Number of estab-
lishments - total,
в городах
в сельской
Number
в городах
в сельской
всего
в городах
в сельской
thou.
и поселках
местности
of pupils -
и поселках
местности
и поселках
местности
total
городского
total 2),
городского
городского
in rural area
in rural area
in rural area
типа
thou. persons
типа
типа
in cities and
in cities
in cities and
urban type
and urban type
urban type
settlements
settlements
settlements
1932
27,5
11,3
16,2
1,2
0,7
0,5
…
…
…
1940
29,9
14,9
15,0
1,3
0,9
0,4
…
…
…
1950
30,2
17,4
12,8
1,2
0,9
0,3
…
…
…
1960
47,6
29,0
18,6
3037,7
2446,7
591,0
…
…
…
1990
87,9
47,3
40,6
9009,5
6860,5
2149,0
…
…
…
2000
51,3
28,6
22,7
4263,0
3408,5
854,5
674
727
560
2005
46,5
26,4
20,1
4530,4
3611,0
919,4
597
630
517
2010
45,1
26,7
18,4
5388,0
4280,6
1107,3
553
590
463
2011
44,9
26,9
18,0
5661,1
4502,4
1158,8
570
614
465
2012
44,3
26,5
17,8
5982,9
4750,6
1232,2
592
640
477
2013
43,2
25,7
17,5
6347,3
5037,1
1310,2
600
648
481
2014
51,0
27,1
23,8
6813,6
5415,6
1398,0
612
660
493
2015
50,1
26,6
23,5
7151,6
5693,8
1457,7
626
673
508
2016
49,4
26,3
23,1
7342,9
5856,3
1486,6
635
677
524
1) До 2014 г. - дошкольные образовательные организации.
2) 1932, 1940, 1950 гг. - млн. человек.
1) Before 2014 - preschool education establishments.
2) 1932, 1940, 1950 - mln. persons.
Российский статистический ежегодник. 2017
179
7. ОБРАЗОВАНИЕ / EDUCATION
7.5. ЧИСЛЕННОСТЬ ПЕДАГОГИЧЕСКИХ РАБОТНИКОВ ОРГАНИЗАЦИЙ, ОСУЩЕСТВЛЯЮЩИХ ОБРАЗОВАТЕЛЬНУЮ
ДЕЯТЕЛЬНОСТЬ ПО ОБРАЗОВАТЕЛЬНЫМ ПРОГРАММАМ ДОШКОЛЬНОГО ОБРАЗОВАНИЯ,
ПРИСМОТР И УХОД ЗА ДЕТЬМИ
PEDAGOGICAL STAFF IN PRESCHOOL EDUCATION, SUPERVISION AND CHILD CARE ESTABLISHMENTS
Численность
из них имеют образование, процентов
педагогиче-
of which having education, percent
ских работ-
ников,
высшее
из них
среднее
из них
тыс. человек
higher
педагогиче-
профессио-
педагогиче-
ское
нальное по
ское
Pedagogical
workers, thou.
of which
программам
of which
persons
pedagogical
подготовки
pedagogical
специалистов
среднего
звена
secondary
vocational
by training
professional
programs for
mid-level
specialists
2014
Всего
630,3
48,7
45,5
49,5
45,3
Total
из них:
of which:
воспитатели
(включая старших воспитателей)
510,9
44,1
41,0
53,9
49,5
tutors (including senior tutors)
музыкальные руководители
43,3
43,0
38,9
55,7
49,4
music instructors
инструкторы по физической культуре
20,3
56,5
52,2
42,0
38,6
physical education teachers
учителя-логопеды
27,4
98,0
96,8
1,7
1,5
speech therapists
учителя-дефектологи
4,5
98,6
97,8
1,1
1,0
special education teachers
педагоги-психологи
14,4
96,4
92,6
3,2
2,7
educational psychologists
2015
Всего
642,8
50,7
47,7
47,7
44,2
Total
из них:
of which:
воспитатели
(включая старших воспитателей)
521,4
46,2
43,4
52,0
48,4
tutors
музыкальные руководители
44,0
44,6
40,5
54,3
48,4
music instructors
инструкторы по физической культуре
20,8
58,8
54,6
39,9
37,0
physical education teachers
учителя-логопеды
28,2
98,2
96,8
1,5
1,3
speech therapists
учителя-дефектологи
4,5
98,6
97,9
1,2
1,1
special education teachers
педагоги-психологи
14,7
96,9
93,5
2,7
2,3
educational psychologists
2016
Всего
656,2
52,6
49,9
46,3
43,5
Total
из них:
of which:
воспитатели
(включая старших воспитателей)
530,1
48,2
45,6
50,6
47,8
tutors
музыкальные руководители
44,5
46,1
42,1
53,1
47,9
music instructors
инструкторы по физической культуре
21,7
60,5
56,6
38,8
36,4
physical education teachers
учителя-логопеды
29,5
98,5
97,7
1,4
1,3
speech therapists
учителя-дефектологи
4,8
98,7
97,7
1,1
1,0
special education teachers
педагоги-психологи
15,4
97,3
94,4
2,5
2,3
educational psychologists
180
Российский статистический ежегодник. 2017
7. ОБРАЗОВАНИЕ / EDUCATION
ДЕТИ И ПОДРОСТКИ, ОСТАВШИЕСЯ БЕЗ ПОПЕЧЕНИЯ РОДИТЕЛЕЙ
CHILDREN AND ADOLESCENTS WITHOUT PARENTAL CARE
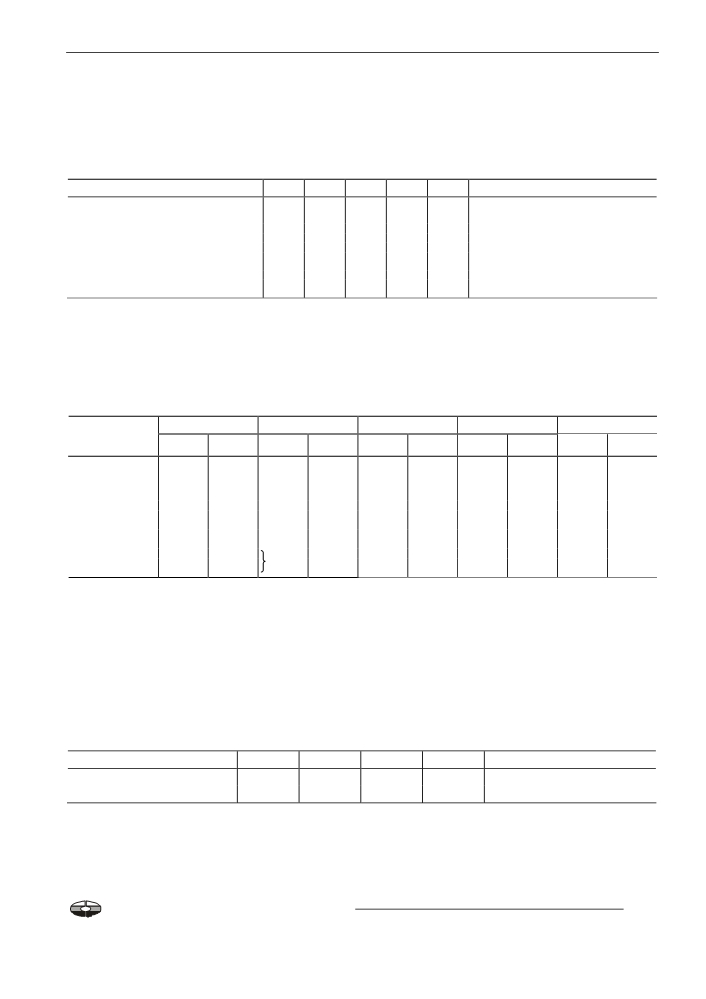
7.6. УСТРОЙСТВО ДЕТЕЙ И ПОДРОСТКОВ, ОСТАВШИХСЯ БЕЗ ПОПЕЧЕНИЯ РОДИТЕЛЕЙ1)
PLACEMENT OF CHILDREN AND
ADOLESCENTS
WITHOUT PARENTAL CARE 1)
(человек / persons)
2000
2010
2014
2015
2016
Выявлено и учтено детей и подростков,
Identified and registered children and
adolescents
оставшихся без попечения родителей2)
134611
101017
65162
60111
58716
without parental care2)
из них устроены:
of them were placed:
в дома ребенка, детские дома и школы-
интернаты для детей-сирот и детей, остав-
at baby homes, orphanages and boarding
шихся без попечения родителей, учреждения
schools for orphans and children without
социальной защиты населения и иные учреж-
parental care, establishments of social
дения на полное государственное обеспече-
protection and other establishments
ние
36215
26622
12052
11278
11223
for
full social security
под опекой (попечительством),
на усыновление
74258
55562
37810
35537
34444
at tutelage (guardianship), for adoption
в том числе усыновлены иностранными
гражданами
6292
3355
1052
746
486
including
adoption by foreigners
в профессиональные образовательные орга-
низации, осуществляющие подготовку квали-
фицированных рабочих, служащих, в профес-
сиональные образовательные организации
at vocational education establishments training
осуществляющие подготовку специалистов
skilled workers, employees, at vocational edu-
среднего звена и в образовательные органи-
cation establishments training middle-level
зации высшего образования на полное госу-
specialists and higher professional education
дарственное обеспечение
2154
1736
790
565
516
establishments for full social security
Численность детей-сирот и детей, оставшихся
Number of orphaned children and children without
без попечения родителей, воспитывающихся
parental care who are brought up at boarding
в интернатных учреждениях
180295
119860
73147
58918
39215
establishments
в том числе в учреждениях:
including at:
дома ребенка3)
14115
12707
6892
5439
4170
baby homes3)
детские дома
67694
49250
29599
23256
20495
orphanages
детские дома - школы
9816
5027
2349
1656
1070
orphan asylums - schools
школы-интернаты для детей-сирот
23314
8758
3902
2792
2445
boarding schools for orphans
школы-интернаты общего типа
9123
3988
1190
722
…
general boarding schools
школы-интернаты для детей с ограниченными
boarding schools for children with limited
возможностями здоровья
40926
26051
16336
12973
…
health abilities
дома-интернаты для детей4)
15307
14079
12879
12080
11035
boarding homes for children4)
Находится детей и подростков на воспитании
Number of children and adolescents who are
в семьях:
brought up in families:
под опекой (попечительством)5)
328978
430604
436539
438494
433599
for tutelage (guardianship)5)
в приемных семьях (без родных детей)
4398
78510
134290
148466
156560
in foster families
(without native children)
на усыновлении
153477
131308
124127
115581
112985
at adoption
в семейных детских домах
459
222
67
272
223
at family orphanages
1) По данным Минобрнауки России.
2) С учетом детей, оставшихся не устроенными к началу отчетного года.
3) По данным Минздрава России.
4) По данным Минтруда России.
5) С 2010 г.- в соответствии с Федеральным законом Российской Федерации от 24.04.2008 № 48-ФЗ «Об опеке и попечительстве» - включая детей, находящихся на воспитании в
приемных семьях.
1) Data source: the Ministry of Education and Science of the Russian Federation.
2) Taking into account children, who had not been placed at the beginning of year.
3) Data source: the Ministry of Healthcare of the Russian Federation.
4) Data source: Ministry of Labour and Social Protection of the Russian Federation.
5) Since 2010 -
in accordance with the Federal Law of April 24,.2008 "On guardianship and trusteeship" - including children, being brought up in foster families.
7.7. ИНТЕРНАТНЫЕ УЧРЕЖДЕНИЯ ДЛЯ ДЕТЕЙ1)
BOARDING INSTITUTIONS FOR CHILDREN 1)
2000
2010
2014
2015
2016
Число детских домов
1244
1048
819
720
642
Number of orphanages
В них детей, тыс. человек
72,3
50,0
30,4
24,7
23,3
Attending children, thou. persons
Число детских домов-школ
85
56
33
25
19
Number of orphan asylums - schools
В них детей, тыс. человек
10,3
5,2
2,5
1,7
1,2
Attending children, thou. persons
Число домов ребенка2)
254
227
176
166
161
Number of baby homes2)
В них детей2), тыс. человек
19,3
17,5
11,5
10,2
8,6
Attending children2), thou. persons
Число домов-интернатов для детей3)
156
143
133
144
141
Number of boarding homes for children3)
В них детей3), тыс. человек
29,3
23,8
21,2
20,6
23,2
Attending children3), thou. persons
1) По данным Минобрнауки России.
2) По данным Минздрава России.
3) По данным Минтруда России.
1) Data source: the Ministry of Education and Science of the Russian Federation.
2) Data source: the Ministry of Healthcare of the Russian Federation.
3) Data source: Ministry of Labour and Social Protection of the Russian Federation.
Российский статистический ежегодник. 2017
181
7. ОБРАЗОВАНИЕ / EDUCATION
НАЧАЛЬНОЕ, ОСНОВНОЕ И СРЕДНЕЕ ОБЩЕЕ ОБРАЗОВАНИЕ
PRIMARY, BASIC AND SECONDARY GENERAL EDUCATION
7.8. ОРГАНИЗАЦИИ, ОСУЩЕСТВЛЯЮЩИЕ ОБРАЗОВАТЕЛЬНУЮ ДЕЯТЕЛЬНОСТЬ
ПО ОБРАЗОВАТЕЛЬНЫМ ПРОГРАММАМ НАЧАЛЬНОГО, ОСНОВНОГО
И СРЕДНЕГО ОБЩЕГО ОБРАЗОВАНИЯ
на начало учебного года
ESTABLISHMENTS CARRYING OUT TRAINING PROGRAMS FOR PRIMARY,
BASIC AND SECONDARY GENERAL EDUCATION
beginning of academic year
2000/2001
2010/2011
2014/2015
2015/2016
2016/2017
Число организаций, осуществляющих образо-
вательную деятельность по образовательным
программам начального, основного и среднего
Number of primary, basic and secondary
общего образования, тыс.
68,8
50,8
44,8
43,4
42,6
general education establishments, thou.
в том числе:
including:
в городах и поселках городского типа
23,3
20,2
18,7
18,1
18,0
in cities and urban type settlements
в сельской местности
45,5
30,6
26,2
25,3
24,6
in rural area
Численность обучающихся по образователь-
Number of pupils in primary, basic and
ным программам начального, основного и
secondary general education,
среднего общего образования, тыс. человек:
20550,2
13642,4
14398,9
14770,4
15219,0
thou. persons:
в том числе:
including:
в городах и поселках городского типа
14446,4
9834,8
10667,7
11007,8
11417,4
in cities and urban type settlements
в сельской местности
6103,7
3807,6
3731,2
3762,6
3801,6
in rural area
Численность обучающихся, получивших
Number of students who received diplomas,
аттестат, тыс. человек:
thou. persons:
об основном общем образовании
2199,5
1354,1
1223,1
1198,3
1239,8
of basic general education
о среднем общем образовании
1457,8
789,3
701,1
647,8
634,8
of secondary general education
7.9. НАПОЛНЯЕМОСТЬ КЛАССОВ ПО УРОВНЯМ ОБЩЕГО ОБРАЗОВАНИЯ
на начало учебного года
NUMBER OF PUPILS PER CLASS AT GENERAL EDUCATION ESTABLISHMENTS
beginning of academic year
(человек / persons)
2000/2001
2010/2011
2014/2015
2015/2016
2016/2017
Классы:
Grades:
1-4
18
17
19
20
20
1-4
5-9
21
18
19
19
19
5-9
10-11(12)
21
17
17
17
17
10-11(12)
7.10. СМЕННОСТЬ ЗАНЯТИЙ В ОРГАНИЗАЦИЯХ, ОСУЩЕСТВЛЯЮЩИХ ОБРАЗОВАТЕЛЬНУЮ ДЕЯТЕЛЬНОСТЬ
ПО ОБРАЗОВАТЕЛЬНЫМ ПРОГРАММАМ НАЧАЛЬНОГО, ОСНОВНОГО И СРЕДНЕГО ОБЩЕГО ОБРАЗОВАНИЯ1); 2)
на начало учебного года
SHIFTS OF STUDIES AT ESTABLISHMENTS CARRYING OUT TRAINING PROGRAMS FOR PRIMARY, BASIC AND SECONDARY
GENERAL EDUCATION 1); 2)
beginning of academic year
2000/2001
2010/2011
2014/2015
2015/2016
2016/2017
Численность обучающихся, занимавшихся:
Pupils studying:
в первую смену:
in the first shift:
млн. человек
15,4
11,2
11,9
12,3
12,8
mln. persons
в процентах от общей численности
обучающихся
79
87
86
87
85
percent of total number of pupils
во вторую и третью смены:
in the second and third shifts:
млн. человек
4,0
1,7
1,9
1,9
1,9
mln. persons
в процентах от общей численности
обучающихся
21
13
14
13
13
percent of total number of pupils
1) См. методологические пояснения в конце раздела.
2) До 2016/2017 учебного года информация приведена только по государственным и муниципальным общеобразовательным организациям.
1) See methodological guidelines at the end of the section.
2) Before the 2016/17 academic year the information is provided only on state and municipal general education establishments.
182
Российский статистический ежегодник. 2017
7. ОБРАЗОВАНИЕ / EDUCATION
7.11. ОБЩЕОБРАЗОВАТЕЛЬНЫЕ ОРГАНИЗАЦИИ, ОСНАЩЕННЫЕ КАБИНЕТАМИ ОСНОВ ИНФОРМАТИКИ
И ВЫЧИСЛИТЕЛЬНОЙ ТЕХНИКИ1)
GENERAL EDUCATION ESTABLISHMENTS, EQUIPPED WITH CLASSROOMS
TO STUDY THE BASIC COMPUTER SKILLS 1)
20102)
2014
2015
2016
Число общеобразовательных организа-
ций, имеющих учебные кабинеты основ
General education establishments, equipped
информатики и вычислительной техники:
with classrooms of the basic computer skills:
всего
43026
42690
41828
38484
total
в процентах от общего числа
percent of total number
общеобразовательных организаций
81,4
85,8
86,7
91,1
of general education establishments
В них рабочих мест с ЭВМ, тыс.
533,3
612,2
614,3
574,9
In them workplaces equipped with PC, thou.
В 2016 году 41567 общеобразовательных организаций имели собственный сайт в сети Интернет.
41567 general education establishments had their own website on the Internet in 2016.
1) До 2016 г. - на начало соответствующего учебного года.
2) Информация приведена только по государственным и муниципальным общеобразовательным организациям.
1) Before 2016 - at beginning of corresponding academic year.
2) Information is provided only on state and municipal general education establishments.
7.12. ЭЛЕКТРОННЫЕ СРЕДСТВА ОБУЧЕНИЯ В ОБЩЕОБРАЗОВАТЕЛЬНЫХ ОРГАНИЗАЦИЯХ1)
ELECTRONIC MEANS AT GENERAL EDUCATION ESTABLISHMENTS1)
20102)
2014
2015
2016
Число персональных компьютеров, тыс. шт.
1169,8
2264,9
2339,4
2448,2
Personal computers, thou. pcs.
из них:
of which:
используемые в учебных целях
918,8
1874,7
1943,5
2051,0
used for educational purposes
в составе локальных вычислительных
сетей
630,1
1342,0
1417,2
1312,7
in local area networks (LAN)
имевшие доступ к сети Интернет
611,0
1506,5
1605,2
1767,6
with Internet access
Число персональных компьютеров,
используемых в учебных целях,
Personal computers used for learning goals,
на 1000 обучающихся, шт.
69
130
132
136
per 1000 pupils, pcs.
Число персональных компьютеров,
используемых в учебных целях, имевших
доступ к сети Интернет, на 1000 обучаю-
Personal computers used for learning goals,
щихся, шт.
…
90
95
97
per 1000 pupils, pcs.
1) До 2016 г. - на начало соответствующего учебного года.
2) Информация приведена только по государственным и муниципальным общеобразовательным организациям.
1) Before 2016 - at beginning of corresponding academic year.
2) Information is provided only on state and municipal general education establishments.
7.13. ЧИСЛЕННОСТЬ УЧИТЕЛЕЙ В ОРГАНИЗАЦИЯХ, ОСУЩЕСТВЛЯЮЩИХ ОБРАЗОВАТЕЛЬНУЮ ДЕЯТЕЛЬНОСТЬ
ПО ОБРАЗОВАТЕЛЬНЫМ ПРОГРАММАМ НАЧАЛЬНОГО, ОСНОВНОГО И СРЕДНЕГО ОБЩЕГО ОБРАЗОВАНИЯ
ПО УРОВНЮ ОБРАЗОВАНИЯ1)
на 20 сентября
PRIMARY, BASIC AND SECONDARY GENERAL EDUCATION TEACHERS BY LEVEL OF EDUCATION1)
as of September 20
20102)
2014
2015
2016
Всего учителей (без совместителей),
Teachers, total (except part-time teachers),
тыс. человек
1067,1
1076,2
1077,3
1074,1
thou. persons
из них имеют образование, процентов:
of them with level of education, percent
высшее
83,1
85,6
86,1
86,6
higher professional
из них педагогическое
78,6
81,2
81,9
83,0
of them pedagogical education
среднее профессиональное по про-
граммам подготовки специалистов
secondary vocational by training programs
среднего звена
15,8
13,6
13,2
12,3
for mid-level specialists
из них педагогическое
13,8
12,1
11,8
11,2
of them pedagogical education
среднее общее
0,6
0,5
0,4
… secondary general
Удельный вес женщин в общей численно-
Share of women in total number
сти учителей, процентов
87,8
87,7
87,6
85,0
of teachers, percent
1) По данным Минобрнауки России.
2) Информация приведена только по государственным и муниципальным общеобразовательным организациям.
1) Source: the Ministry of Education and Science of the Russian Federation.
2) Information is provided only on state and municipal general education establishments.
Российский статистический ежегодник. 2017
183
7. ОБРАЗОВАНИЕ / EDUCATION
7.14. ОРГАНИЗАЦИИ ДОПОЛНИТЕЛЬНОГО ОБРАЗОВАНИЯ ДЕТЕЙ ПО ВИДАМ ОБРАЗОВАТЕЛЬНОЙ ДЕЯТЕЛЬНОСТИ
ESTABLISHMENTS OF ADDITIONAL EDUCATION OF CHILDREN BY EDUCATIONAL ACTIVITIES
Число организаций
Численность учащихся в них, тыс. человек
Number of establishments
Number of students, thou. persons
2000
2010
2014
2015
2016
2000
2010
2014
2015
2016
Всего1) / Total 1)
8699
8531
11791
14359
14172
7905,8
8083,3
9617,2
11010,0
11079,9
в том числе / including:
работающие по всем видам образовательной
деятельности / carrying out training programs
for all types of educational activities
3577
3683
3703
3782
3612
4411,8
4645,5
4976,7
5097,4
5089,1
художественные / art
371
780
2393
4375
4489
294,6
627,2
976,1
1736,7
1901,9
эколого-биологические / ecological and biological
467
331
251
219
204
367,6
281,2
216,0
206,6
194,8
туристско-краеведческие / tourist and local
history
335
256
209
185
177
206,8
175,3
160,4
149,6
153,3
технические / technical
570
327
245
217
225
434,2
268,4
213,0
200,8
207,1
спортивные / sports
2968
2760
3714
4445
4215
1981,3
1790,5
2423,9
2978,8
2891,6
военно-патриотические и спортивно-
технические / military-patriotic and sports-
technical
112
101
83
68
52
101,2
70,0
60,1
60,2
51,9
другие / other
299
293
1193
1068
1198
108,3
225,0
591,1
579,8
590,2
Детско-юношеские спортивные школы2) / Children
and youth sports schools 2)
1709
2210
2902
2809
2399
866,2
1455,7
1981,3
2000,5
1677,0
Детские музыкальные, художественные, хорео-
графические школы и школы искусств3) / Children
music, art, choreography and art schools 3)
5823
5370
5186
5108
5007
1284,5
1433,0
1496,6
1533,4
1555,1
1) По данным Минобрнауки России.
2) По данным Минспорта России.
3) По данным Минкультуры России.
1) Data source: the Ministry of Education and Science of the Russian Federation.
2) Data source: the Ministry of Sport of the Russian Federation.
3) Data source: the Ministry of Culture of the Russian Federation.
184
Российский статистический ежегодник. 2017
7. ОБРАЗОВАНИЕ / EDUCATION
СРЕДНЕЕ ПРОФЕССИОНАЛЬНОЕ ОБРАЗОВАНИЕ
ПО ПРОГРАММАМ ПОДГОТОВКИ КВАЛИФИЦИРОВАННЫХ РАБОЧИХ, СЛУЖАЩИХ*)
SECONDARY VOCATIONAL EDUCATION ON PROGRAMS OF TRAINING
OF SKILLED WORKERS, EMPLOYEES *)
7.15. ПОДГОТОВКА КВАЛИФИЦИРОВАННЫХ РАБОЧИХ, СЛУЖАЩИХ1)
TRAINING OF SKILLED WORKERS, EMPLOYEES1)
2000
2010
2014
2015
2016
Численность студентов, обучающихся по про-
граммам подготовки квалифицированных рабо-
Number of students by training programs for
чих, служащих:
skilled workers, employees:
всего, тыс. человек
1679
1007
727
686
5632)
total, thou. persons
на 10 000 человек населения, человек
115
70
50
47
38
per 10 000 population, persons
Принято на обучение, тыс. человек
845
609
416
396
224
Admitted to training, thou. persons
Выпущено квалифицированных рабочих,
служащих:
Graduates- skilled workers, employees:
всего, тыс. человек
763
581
403
368
199
total, thou. persons
на 10 000 человек занятого населения,
человек
118
86
56
51
27
per 10 000 employed population, persons
1) С 2010 г. - включая студентов на договорной основе.
2) На начало 2016/2017 учебного года.
1) Since 2010 - including students on a contractual basis.
2) At the beginning of
2016/2017 academic year.
7.16. ЧИСЛЕННОСТЬ СТУДЕНТОВ, ОБУЧАЮЩИХСЯ ПО ПРОГРАММАМ ПОДГОТОВКИ
КВАЛИФИЦИРОВАННЫХ РАБОЧИХ, СЛУЖАЩИХ, ПО ПОЛУ И ВОЗРАСТУ1)
STUDENTS IN VOCATIONAL PROGRAMS FOR SKILLED WORKERS AND EMPLOYEES, BY SEX AND AGE 1)
(тысяч человек / thou. persons)
2000
2010
2014
2015
20162)
Юноши
Девушки
Юноши
Девушки
Юноши
Девушки
Юноши
Девушки
Юноши
Девушки
Male
Female
Male
Female
Male
Female
Male
Female
Male
Female
Возрастные
группы, лет / Age
groups, years
14 и младше /14
and younger
13,0
5,5
1,8
0,6
0,4
0,3
0,4
0,2
1,1
0,6
15
171,6
89,6
26,4
12,4
15,6
7,1
14,8
6,4
16,5
7,1
16
269,0
151,1
128,7
59,7
94,4
39,5
86,4
35,9
81,9
32,4
17
298,4
189,1
166,9
84,3
120,5
53,1
119,8
51,6
101,8
42,4
18
145,3
123,1
140,4
78,6
108,0
51,0
102,0
46,7
95,5
40,6
19
43,4
48,7
63,4
44,9
48,2
25,5
44,7
23,1
37,9
18,5
20
13,0
16,8
21 год и старше / 21
69,53)
58,7
54,1
40,8
51,4
38,1
52,5
30,5
and over
16,7
14,9
1) Без профессиональных образовательных организаций ФСИН России и специальных профессиональных образовательных организаций. С 2010 г. - включая обучающихся на
договорной основе.
2) На начало 2016/2017 учебного года.
3) С 2010 г. - с 20 лет и старше.
1) Except vocational education establishments of the Federal Penitentiary Service (FPS) of Russia, and special vocational education establishments. Since 2010 - Including students on
a contractual basis.
2) At the beginning of
2016/2017 academic year.
3) Since 2010 - from 20 and over.
7.17. ЧИСЛЕННОСТЬ ПРЕПОДАВАТЕЛЕЙ В ОБРАЗОВАТЕЛЬНЫХ ОРГАНИЗАЦИЯХ, ОСУЩЕСТВЛЯЮЩИХ
ОБРАЗОВАТЕЛЬНУЮ ДЕЯТЕЛЬНОСТЬ ПО ПРОГРАММАМ ПОДГОТОВКИ КВАЛИФИЦИРОВАННЫХ РАБОЧИХ,
СЛУЖАЩИХ
TEACHERS AT VOCATIONAL EDUCATION ESTABLISHMENTS ON PROGRAMS
FOR SKILLED WORKERS AND EMPLOYEES
(тысяч человек / thou. persons)
2010
2014
2015
20161)
Всего
29,3
10,1
6,6
21,6
Total
в том числе с высшим образованием
25,8
9,1
5,9
19,2
including with higher education diploma
1) На начало 2016/2017 учебного года.
1) At the beginning of
2016/2017 academic year.
*) С 2014 г. - по данным Минобрнауки России.
*) Starting since 2014 - according to data of the Ministry of Education and Science of the Russian Federation.
Российский статистический ежегодник. 2017
185
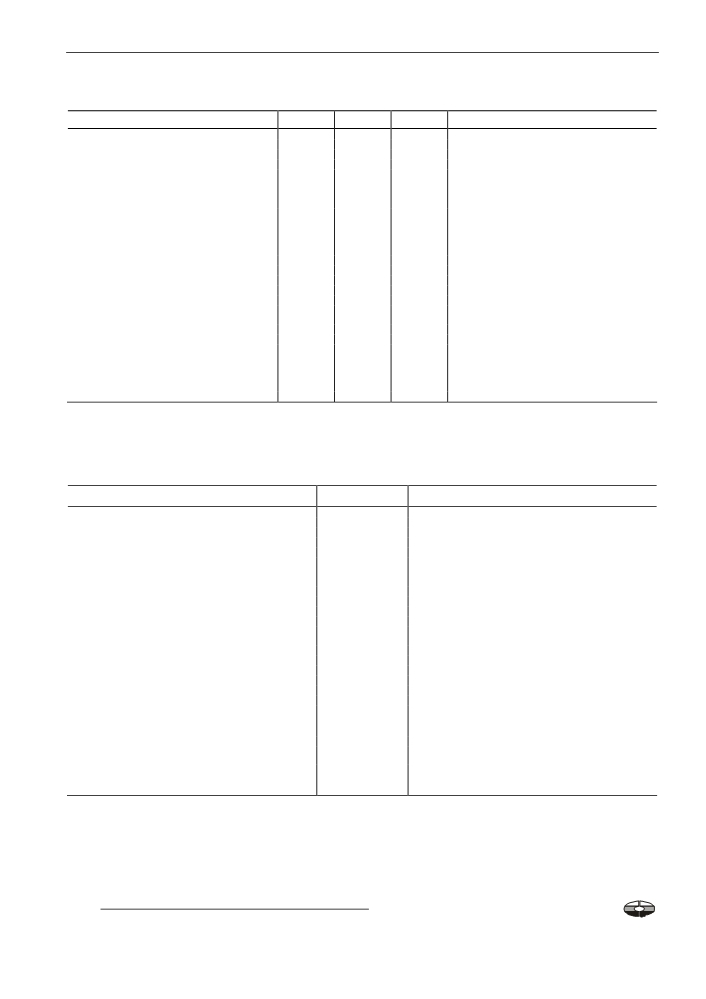
7. ОБРАЗОВАНИЕ / EDUCATION
7.18. ВЫПУСК КВАЛИФИЦИРОВАННЫХ РАБОЧИХ И СЛУЖАЩИХ ПО ПРОФЕССИЯМ в 2010-2015 гг. 1)
GRADUATION OF SKILLED WORKERS AND EMPLOYEES BY OCCUPATION in 2010-2015 1)
(тысяч человек / thou. persons)
2010
2014
2015
Выпуск - всего
580,5
403,0
368,2
Graduates - total
в том числе по профессиям:
including by occupation:
промышленности
174,8
127,3
119,8
industry
из них:
of which:
производства черных и цветных
металлов
1,5
1,0
0,9
manufacture of ferrous and non-ferrous metals
химического производства
0,4
0,3
0,1
manufacture of chemicals and chemical products
металлообработки
95,9
59,2
54,9
processing of metals
лесозаготовительных работ, деревообрабаты-
вающего производства, производства целлю-
logging, woodworking, manufacture of pulp,
лозы, бумаги и картона
17,2
13,9
13,8
paper and paper products
производства строительных материалов
0,6
0,7
0,5
manufacture of construction materials
легкой
32,4
31,6
31,8
light industry
из них производства:
of which manufacture of:
текстильного
содержание .. 9 10 11 12 ..