INTERNATIONAL MONETARY FUND. Navigating Global Divergences (October 2023) - page 1
CONTENTS
Assumptions and Conventions
viii
Further Information
x
Data
xi
Preface
xii
Foreword
xiii
Executive Summary
xvi
Chapter 1. Global Prospects and Policies
1
Growing Global Divergences
1
Outlook: Stable but Slow
10
Risks to the Outlook: Tilted to the Downside but More Balanced
19
Policy Priorities: From Disinflation to Sustained Growth
22
Box 1.1. Dimming Growth Prospects: A Longer Path to Convergence
26
Box 1.2. Risk Assessment Surrounding the World Economic Outlook’s Baseline Projections
30
Commodity Special Feature: Market Developments and the Commodity Price Channel of
Monetary Policy
34
References
46
Chapter 2. Managing Expectations: Inflation and Monetary Policy
49
Introduction
49
Recent Patterns in Inflation Expectations
52
Te Role of Expectations in Inflation Dynamics
55
Expectations Formation and Monetary Policymaking
58
Conclusions
64
Box 2.1. Firms’ Inflation Expectations, Attention, and Monetary Policy Effectiveness
65
Box 2.2. Fiscal Imprudence and Inflation Expectations: Te Role of Monetary
Policy Frameworks
66
Box 2.3. Energy Subsidies, Inflation, and Expectations: Unpacking Euro Area Measures
67
References
68
Chapter 3. Fragmentation and Commodity Markets: Vulnerabilities and Risks
71
Introduction
71
What Makes Commodities Vulnerable in the Event of Fragmentation?
73
Fragmentation in Commodity Markets
76
Which Commodities Are Most Vulnerable?
77
Economic Impacts of Commodity Market Fragmentation
79
Implications for the Clean Energy Transition
83
Summary and Policy Implications
84
Box 3.1. Commodity Trade Tensions: Evidence from Tanker Traffic Data
87
Box 3.2. Commodity Market Fragmentation in History: Many Shades of Gray
88
Box 3.3. Te Uneven Economic Effects of Commodity Market Fragmentation
89
References
90
International Monetary Fund | October 2023
iii
WORLD ECONOMIC OUTLOOK: NAVIGATING GLOBAL DIVERGENCES
Statistical Appendix
93
Assumptions
93
What’s New
93
Data and Conventions
94
Country Notes
95
Classification of Countries
97
General Features and Composition of Groups in the World Economic Outlook
Classification
97
Table A. Classification by World Economic Outlook Groups and Teir Shares in
Aggregate GDP, Exports of Goods and Services, and Population, 2022
99
Table B. Advanced Economies by Subgroup
100
Table C. European Union
100
Table D. Emerging Market and Developing Economies by Region and Main Source
of Export Earnings
101
Table E. Emerging Market and Developing Economies by Region, Net External Position,
Heavily Indebted Poor Countries, and Per Capita Income Classification
102
Table F. Economies with Exceptional Reporting Periods
104
Table G. Key Data Documentation
105
Box A1. Economic Policy Assumptions Underlying the Projections for Selected Economies
115
List of Tables
119
Output (Tables A1-A4)
120
Inflation (Tables A5-A7)
127
Financial Policies (Table A8)
132
Foreign Trade (Table A9)
133
Current Account Transactions (Tables A10-A12)
135
Balance of Payments and External Financing (Table A13)
142
Flow of Funds (Table A14)
146
Medium-Term Baseline Scenario (Table A15)
149
World Economic Outlook Selected Topics
151
IMF Executive Board Discussion of the Outlook, September 2023
161
Tables
Table 1.1. Overview of the World Economic Outlook Projections
12
Table 1.2. Overview of the World Economic Outlook Projections at
Market Exchange Rate Weights
14
Table 1.SF.1. Average Response of CPIs
38
Annex Table 1.1.1. European Economies: Real GDP, Consumer Prices,
Current Account Balance, and Unemployment
40
Annex Table 1.1.2. Asian and Pacific Economies: Real GDP, Consumer Prices,
Current Account Balance, and Unemployment
41
Annex Table 1.1.3. Western Hemisphere Economies: Real GDP, Consumer Prices,
Current Account Balance, and Unemployment
42
Annex Table 1.1.4. Middle East and Central Asia Economies: Real GDP,
Consumer Prices, Current Account Balance, and Unemployment
43
Annex Table 1.1.5. Sub-Saharan African Economies: Real GDP, Consumer Prices,
Current Account Balance, and Unemployment
44
Annex Table 1.1.6. Summary of World Real per Capita Output
45
iv
International Monetary Fund | October 2023
contents
Online Tables—Statistical Appendix
Table B1. Advanced Economies: Unemployment, Employment, and Real GDP per Capita
Table B2. Emerging Market and Developing Economies: Real GDP
Table B3. Advanced Economies: Hourly Earnings, Productivity, and Unit Labor
Costs in Manufacturing
Table B4. Emerging Market and Developing Economies: Consumer Prices
Table B5. Summary of Fiscal and Financial Indicators
Table B6. Advanced Economies: General and Central Government Net Lending/Borrowing
and General Government Net Lending/Borrowing Excluding Social Security Schemes
Table B7. Advanced Economies: General Government Structural Balances
Table B8. Emerging Market and Developing Economies: General Government
Net Lending/Borrowing and Overall Fiscal Balance
Table B9. Emerging Market and Developing Economies: General Government
Net Lending/Borrowing
Table B10. Selected Advanced Economies: Exchange Rates
Table B11. Emerging Market and Developing Economies: Broad Money Aggregates
Table B12. Advanced Economies: Export Volumes, Import Volumes, and Terms of
Trade in Goods and Services
Table B13. Emerging Market and Developing Economies by Region: Total Trade in Goods
Table B14. Emerging Market and Developing Economies by Source of
Export Earnings: Total Trade in Goods
Table B15. Summary of Current Account Transactions
Table B16. Emerging Market and Developing Economies: Summary of
External Debt and Debt Service
Table B17. Emerging Market and Developing Economies by Region:
External Debt by Maturity
Table B18. Emerging Market and Developing Economies by Analytical Criteria:
External Debt by Maturity
Table B19. Emerging Market and Developing Economies: Ratio of External Debt to GDP
Table B20. Emerging Market and Developing Economies: Debt-Service Ratios
Table B21. Emerging Market and Developing Economies, Medium-Term
Baseline Scenario: Selected Economic Indicators
Figures
Figure 1.1. Incomplete Recovery: Scarring from the Shocks of 2020-22
2
Figure 1.2. Te COVID-19 Shock: Returning to Normal
2
Figure 1.3. Cumulative Excess Savings in Advanced Economies
3
Figure 1.4. Tourism Returning to Normal
3
Figure 1.5. Slower Growth Momentum Ahead
4
Figure 1.6. China’s Economy Losing Momentum
5
Figure 1.7. Inflation Turning the Corner
5
Figure 1.8. Headline Inflation Distribution
6
Figure 1.9. Different Drivers: Inflation in Selected Economies
7
Figure 1.10. Labor Markets Still Tight but Easing
7
Figure 1.11. Little Evidence of Wage-Price Spirals
8
Figure 1.12. Profits and Labor Shares: Accounting for Inflation
8
Figure 1.13. Monetary Policy to Remain Tight
9
Figure 1.14. Credit Channel Active in US and EA
9
Figure 1.15. House Prices Slowing or Reversing, 2022-23
9
Figure 1.16. Monetary and Fiscal Policy Assumptions
10
Figure 1.17. Growth Outlook: Stable and Slow
11
International Monetary Fund | October 2023
v
WORLD ECONOMIC OUTLOOK: NAVIGATING GLOBAL DIVERGENCES
Figure 1.18. Inflation Outlook: Falling
16
Figure 1.19. Headline Inflation Forecasts for Selected Economies
17
Figure 1.20. Inflation Mostly above Target until 2025
17
Figure 1.21. Forecasts of Global GDP
18
Figure 1.22. Current Account and International Investment Positions
19
Figure 1.23. Recession and Inflation Concerns over Time
19
Figure 1.24. Sovereign Spreads in Emerging Market and Developing Economies
21
Figure 1.25. Social Unrest Stable at Low Level
22
Figure 1.26. General Government Interest Payments
23
Figure 1.27. Firms Less Green in Emerging Market Economies
25
Figure 1.1.1. Five-Year-Ahead Growth Projections
26
Figure 1.1.2. Five-Year-Ahead Growth Projections: Country Groups
26
Figure 1.1.3. Projected Growth Deceleration in the Largest Economies
27
Figure 1.1.4. Per Capita Growth Forecast Decomposition
28
Figure 1.1.5. Medium-Term Growth and Income Convergence
29
Figure 1.2.1. Distribution of Forecast Uncertainty around Global GDP Growth and
Inflation Projections
31
Figure 1.2.2. Impact of Scenario on GDP Level and Core Inflation
32
Figure 1.SF.1. Commodity Market Developments
34
Figure 1.SF.2. Headline Inflation
35
Figure 1.SF.3. Peak Commodity Price Responses to a 10-Basis-Point US Monetary
Policy Shock
37
Figure 1.SF.4. Impulse Response Functions for a 10-Basis-Point US Monetary
Policy Shock
37
Figure 1.SF.5. Contribution of Oil and Food Prices in the Transmission of
US Monetary Policy Shocks
38
Figure 1.SF.6. Asymmetric Pass-Trough of Commodity Price Shocks
39
Figure 2.1. Cross-Economy Deviations of Inflation Expectations from Targets
50
Figure 2.2. Next-12-Months Mean Inflation Expectations by Economic Agent
53
Figure 2.3. Cross-Economy Distribution of Mean Inflation Expectations over Time
53
Figure 2.4. Historical Episodes with Persistently Rising Near- and Long-Term
Inflation Expectations
54
Figure 2.5. Estimated Effects of Alternative Inflation Expectations Measures on
Current Inflation
55
Figure 2.6. Key Coefficients of the Hybrid Phillips Curve
56
Figure 2.7. Associational versus Causal Estimated Effects of Inflation Expectations on
Current Inflation
57
Figure 2.8. Contributors to Recent Inflation Dynamics
57
Figure 2.9. State-Dependent Pass-Trough from Expectations to Inflation
58
Figure 2.10. Macroeconomic Responses to Shocks Conditional on
Agents’ Expectations Formation
60
Figure 2.11. Sacrifice Ratios under Alternative Expectations Processes
61
Figure 2.12. Soundness of Monetary Policy Frameworks and Forecast Rationality
Tests across Economies
61
Figure 2.13. Policy Interventions to Hasten the Reduction of Inflation and
Inflation Expectations
62
Figure 2.14. Policy Objectives, Social Welfare, and Expectations Formation
63
Figure 2.1.1. US Inflation and Firms’ Attention to the Federal Reserve
65
Figure 2.1.2. Role of Attention in Monetary Policy Effectiveness
65
vi
International Monetary Fund | October 2023
contents
Figure 2.2.1. Inflation Expectations in Emerging Market and Developing Economies:
Monetary Policy Frameworks and Public Debt Interactions
66
Figure 2.3.1. Marginal Impacts of Fiscal Measures for Relief from the Energy Price Shock
on Inflation and Expectations
67
Figure 3.1. Fragmentation Keywords in Earnings Calls
72
Figure 3.2. Commodities: Key Characteristics
75
Figure 3.3. Commodity Trade and Distance of Military Alliances
76
Figure 3.4. Signs of Fragmentation
77
Figure 3.5. Price Changes Due to Fragmentation in Individual Commodity Markets
78
Figure 3.6. Wheat Price Increase in the US-Europe+ Bloc due to a Harvest Shock
79
Figure 3.7. Largest Price Increases Induced by a Single Exporter Switching Blocs
80
Figure 3.8. Surplus Changes due to Fragmentation in Individual Commodity Markets
81
Figure 3.9. Impact of Fragmentation on Real GDP and Inflation
82
Figure 3.10. Impact of Fragmentation of Critical Mineral Markets on Investment in
Renewables and Electric Vehicles, 2030
84
Figure 3.1.1. Changes in Tanker Shipments from Russia’s Ports from 2019:Q2 to 2023:Q2
87
Figure 3.3.1. Estimated Output Losses
89
Figure 3.3.2. Estimated GDP Losses in Low-Income Countries and Others
89
International Monetary Fund | October 2023
vii
ASSUMPTIONS AND CONVENTIONS
A number of assumptions have been adopted for the projections presented in the World Economic Outlook
(WEO). It has been assumed that real effective exchange rates remained constant at their average levels during July
25, 2023-August 22, 2023, except for those currencies participating in the European exchange rate mechanism
II, which are assumed to have remained constant in nominal terms relative to the euro; that established policies
of national authorities will be maintained (for specific assumptions about fiscal and monetary policies for selected
economies, see Box A1 in the Statistical Appendix); that the average price of oil will be $80.49 a barrel in 2023
and $79.92 a barrel in 2024; that the three-month government bond yield for the United States will average
5.3 percent in 2023 and 5.4 percent in 2024, that for the euro area will average 3.0 percent in 2023 and
3.2 percent in 2024, and that for Japan will average -0.2 percent in 2023 and -0.1 percent in 2024; and that
the 10-year government bond yield for the United States will average 3.8 percent in 2023 and 4.0 percent in 2024,
that for the euro area will average 2.4 percent in 2023 and 2.6 percent in 2024, and that for Japan will average
0.5 percent in 2023 and 0.6 percent in 2024. Tese are, of course, working hypotheses rather than forecasts,
and the uncertainties surrounding them add to the margin of error that would, in any event, be involved in the
projections. Te estimates and projections are based on statistical information available through September 25,
2023.
Te following conventions are used throughout the WEO:
• . . . to indicate that data are not available or not applicable;
•
- between years or months (for example, 2022-23 or January-June) to indicate the years or months covered,
including the beginning and ending years or months; and
•
/ between years or months (for example, 2022/23) to indicate a fiscal or financial year.
•
“Billion” means a thousand million; “trillion” means a thousand billion.
•
“Basis points” refers to hundredths of 1 percentage point (for example, 25 basis points are equivalent to ¼ of
1 percentage point).
• Data refer to calendar years, except in the case of a few countries that use fiscal years. Please refer to Table F in
the Statistical Appendix, which lists the economies with exceptional reporting periods for national accounts and
government finance data for each country.
• For some countries, the figures for 2022 and earlier are based on estimates rather than actual outturns. Please
refer to Table G in the Statistical Appendix, which lists the latest actual outturns for the indicators in the
national accounts, prices, government finance, and balance of payments for each country.
What is new in this publication:
• Ecuador’s fiscal sector projections, which were previously omitted due to ongoing program discussions, are now
included.
• Eritrea’s data and projections for 2020-28 are excluded from the database due to constraints in data reporting.
• Sri Lanka’s projections for 2023-28 are excluded from publication owing to ongoing discussions on sovereign
debt restructuring.
• Ukraine’s projections for 2024-28, in line with the program’s baseline scenario, are now included.
• For West Bank and Gaza, certain projections for 2022-28 are excluded from publication pending methodological
adjustments to statistical series.
viii
International Monetary Fund | October 2023
Assumptions and Conventions
In the tables and figures, the following conventions apply:
• Tables and figures in this report that list their source as “IMF staff calculations” or “IMF staff estimates” draw
on data from the WEO database.
• When countries are not listed alphabetically, they are ordered on the basis of economic size.
• Minor discrepancies between sums of constituent figures and totals shown reflect rounding.
• Composite data are provided for various groups of countries organized according to economic characteristics or
region. Unless noted otherwise, country group composites represent calculations based on 90 percent or more of
the weighted group data.
• The boundaries, colors, denominations, and any other information shown on maps do not imply, on the part of
the IMF, any judgment on the legal status of any territory or any endorsement or acceptance of such boundaries.
As used in this report, the terms “country” and “economy” do not in all cases refer to a territorial entity that is
a state as understood by international law and practice. As used here, the term also covers some territorial entities
that are not states but for which statistical data are maintained on a separate and independent basis.
International Monetary Fund | October 2023
ix
FURTHER INFORMATION
Corrections and Revisions
Te data and analysis appearing in the World Economic Outlook (WEO) are compiled by the IMF staff at the
time of publication. Every effort is made to ensure their timeliness, accuracy, and completeness. When errors are
discovered, corrections and revisions are incorporated into the digital editions available from the IMF website and
on the IMF eLibrary (see below). All substantive changes are listed in the online table of contents.
Print and Digital Editions
Print
Print copies of this WEO can be ordered from the IMF bookstore at imfbk.st/530521.
Digital
Multiple digital editions of the WEO, including ePub, enhanced PDF, and HTML, are available on the
IMF eLibrary at http://www.elibrary.imf.org/OCT23WEO.
Download a free PDF of the report and data sets for each of the charts therein from the IMF website at
www.imf.org/publications/weo or scan the QR code below to access the WEO web page directly:
Information on the terms and conditions for reusing the contents of this publication are at www.imf.org/external/
terms.htm.
x
International Monetary Fund | October 2023
DATA
Tis version of the World Economic Outlook (WEO) is available in full through the IMF eLibrary (www.elibrary.
imf.org) and the IMF website (www.imf.org). Accompanying the publication on the IMF website is a larger compi-
lation of data from the WEO database than is included in the report itself, including files containing the series most
frequently requested by readers. Tese files may be downloaded for use in a variety of software packages.
Te data appearing in the WEO are compiled by the IMF staff at the time of the WEO exercises. Te histori-
cal data and projections are based on the information gathered by the IMF country desk officers in the context
of their missions to IMF member countries and through their ongoing analysis of the evolving situation in each
country. Historical data are updated on a continual basis as more information becomes available, and structural
breaks in data are often adjusted to produce smooth series with the use of splicing and other techniques. IMF
staff estimates continue to serve as proxies for historical series when complete information is unavailable. As a
result, WEO data can differ from those in other sources with official data, including the IMF’s International
Financial Statistics.
Te WEO data and metadata provided are “as is” and “as available,” and every effort is made to ensure their
timeliness, accuracy, and completeness, but these cannot be guaranteed. When errors are discovered, there is a
concerted effort to correct them as appropriate and feasible. Corrections and revisions made after publication are
incorporated into the electronic editions available from the IMF eLibrary (www.elibrary.imf.org) and on the IMF
website (www.imf.org). All substantive changes are listed in detail in the online tables of contents.
Usage website (www.imf.org/external/terms.htm).
Inquiries about the content of the WEO and the WEO database should be sent by mail or online forum
(telephone inquiries cannot be accepted):
World Economic Studies Division
Research Department
International Monetary Fund
700 19th Street, NW
Washington, DC 20431, USA
Online Forum: www.imf.org/weoforum
International Monetary Fund | October 2023
xi
PREFACE
Te analysis and projections contained in the World Economic Outlook are integral elements of the IMF’s
surveillance of economic developments and policies in its member countries, of developments in international
financial markets, and of the global economic system. Te survey of prospects and policies is the product of a
comprehensive interdepartmental review of world economic developments, which draws primarily on information
the IMF staff gathers through its consultations with member countries. Tese consultations are carried out
in particular by the IMF’s area departments—namely, the African Department, Asia and Pacific Department,
European Department, Middle East and Central Asia Department, and Western Hemisphere Department—
together with the Strategy, Policy, and Review Department; the Monetary and Capital Markets Department; and
the Fiscal Affairs Department.
Te analysis in this report was coordinated in the Research Department under the general direction of
Pierre-Olivier Gourinchas, Economic Counsellor and Director of Research. Te project was directed by Petya
Koeva Brooks, Deputy Director, Research Department, and Daniel Leigh, Division Chief, Research Department.
Te primary contributors to this report are Silvia Albrizio, Jorge Alvarez, Mehdi Benatiya Andaloussi, John
Bluedorn, Christian Bogmans, Allan Dizioli, Christopher Evans, Christoffer Koch, Toh Kuan, Chiara Maggi,
Jorge Miranda Pinto, Jean-Marc Natal, Diaa Noureldin, Andrea Pescatori, Ervin Prifti, Marika Santoro,
Alexandre Sollaci, Martin Stuermer, Petia Topalova, and Philippe Wingender.
Other contributors include Omer Akbal, Gavin Asdorian, German Villegas Bauer, Jared Bebee, Nina Biljanovska,
Marijn Bolhuis, Damien Capelle, Jiaqian Chen, Seung Mo Choi, Yaniv Cohen, Mariarosaria Comunale, Marina
Conesa, Pedro de Barros Gagliardi, Wenchuan Dong, Angela Espiritu, Rebecca Eyassu, Carlos Goncalves, Ziyan
Han, Youyou Huang, Chris Jackson, Harri Kemp, Benjamin Kett, Divya Kirti, Gene Kindberg-Halon, Eduard
Laurito, Jungjin Lee, Nan Li, Weili Lin, Barry Liu, Rui Mano, Carlos Morales, Joseph Moussa, Peter Nagle,
Cynthia Nyanchama Nyakeri, Emory Oakes, Chris Papageorgiou, Clarita Phillips, Nicola Pierri, Rafael Portillo,
Evgenia Pugacheva, Tianchu Qi, Shrihari Ramachandra, Pedro Rodriguez, Muhammad Ahsan Shafique, Arash
Sheikholeslam, Pedro Vitale Simon, Alessandra Sozzi, Alessia de Stefani, Nicholas Tong, Filiz Unsal, Guillermo
Verduzco Bustos, Mona Wang, Isaac Pittman Warren, Yarou Xu, Fan Zhang, Jiaqi Zhao, Canran Zheng, Dian Zhi,
and Liangliang Zhu.
Gemma Rose Diaz from the Communications Department led the editorial team for the report, with
production and editorial support from Michael Harrup, and additional assistance from Lucy Scott Morales, James
Unwin, Nancy Morrison, Grauel Group, and Absolute Service, Inc.
Te analysis has benefited from comments and suggestions by staff members from other IMF departments, as
well as by Executive Directors following their discussion of the report on September 26, 2023. However, estimates,
projections, and policy considerations are those of the IMF staff and should not be attributed to Executive
Directors or to their national authorities.
xii
International Monetary Fund | October 2023
FOREWORD
Resilient Global Economy Is Limping Along,
China, facing growing headwinds from its real estate
with Growing Divergences
crisis and weakening confidence.
Tree global forces are at play. First, the recovery
Te global economy continues to recover slowly
in services is almost complete. Over the past year,
from the blows of the pandemic, Russia’s invasion of
strong demand for services supported service-oriented
Ukraine, and the cost-of-living crisis. In retrospect,
economies—including important tourism destinations
the resilience has been remarkable. Despite the disrup-
such as France and Spain—relative to manufactur-
tion in energy and food markets caused by the war,
ing powerhouses such as China and Germany. High
and the unprecedented tightening of global mon-
demand for labor-intensive services also translated into
etary conditions to combat decades-high inflation,
tighter labor markets, and higher and more persistent
the global economy has slowed, but not stalled. Yet
services inflation. But services activity is now weaken-
growth remains slow and uneven, with growing global
ing alongside a persistent manufacturing slowdown,
divergences. Te global economy is limping along, not
suggesting services inflation will decrease in 2024 and
sprinting.
labor markets and activity will soften.
Global activity bottomed out at the end of last
Second, part of the slowdown is the result of the
year while inflation—both headline and underlying
tighter monetary policy necessary to bring inflation
(core)—is gradually being brought under control. But
down. Tis is starting to bite, but the transmission
a full recovery toward prepandemic trends appears
is uneven across countries. Tighter credit conditions
increasingly out of reach, especially in emerging mar-
are weighing on housing markets, investment, and
ket and developing economies.
activity, more so in countries with a higher share of
According to our latest projections, global growth
adjustable-rate mortgages or where households are less
will slow from 3.5 percent in 2022 to 3 percent this
willing, or able, to dip into their savings. Firm bank-
year and 2.9 percent next year, a 0.1 percentage point
ruptcies have increased in the US and the euro area,
downgrade for 2024 from our July projections. Tis
remains well below the historical average.
although from historically low levels. Countries are
Headline inflation continues to decelerate, from 9.2
also at different points in their hiking cycles: advanced
economies (except Japan) are near the peak, while
percent in 2022, on a year-over-year basis, to 5.9 per-
some emerging market economies, such as Brazil and
cent this year and 4.8 percent in 2024. Core inflation,
Chile, have already started easing.
excluding food and energy prices, is also projected to
Tird, inflation and activity are shaped by the
decline, albeit more gradually than headline inflation,
to 4.5 percent in 2024.
incidence of last year’s commodity price shock.
As a result, projections are increasingly consistent
Economies heavily dependent on Russian energy
with a “soft landing” scenario, bringing inflation down
imports experienced a steeper increase in energy prices
without a major downturn in activity, especially in the
and a sharper slowdown. Some of our recent work
United States, where the forecast increase in unemploy-
shows that the pass-through from higher energy prices
ment is very modest, from 3.6 to 3.9 percent by 2025.
played a large role in driving core inflation upward in
But important divergences are appearing. Te
the euro area, unlike in the United States, where core
slowdown is more pronounced in advanced econo-
inflation pressures reflect instead a tight labor market.
mies than in emerging market and developing ones.
Despite signs of softening, labor markets in advanced
Within advanced economies, the US surprised on the
economies remain buoyant, with historically low unem-
upside, with resilient consumption and investment,
ployment rates helping to support activity. So far, there
while euro area activity was revised downward. Many
is scant evidence of a “wage-price spiral,” and real wages
emerging market economies proved quite resilient and
remain below prepandemic levels. Further, many coun-
surprised on the upside, with the notable exception of
tries experienced a sharp—and welcome—compression
International Monetary Fund | October 2023
xiii
WORLD ECONOMIC OUTLOOK: NAVIGATING GLOBAL DIVERGENCES
in the wage distribution. Some of this compression
excess savings in some countries, and adverse energy
reflects the higher amenity value of flexible and remote
price developments, inflation could become more
work schedules for high earners, reducing wage pres-
entrenched, requiring even more forceful action from
sures for that group.
central banks.
Fourth, fiscal buffers have eroded in many coun-
tries, with elevated debt levels, rising funding costs,
Risks
slowing growth, and an increasing mismatch between
While some of the extreme risks—such as severe
the growing demands on the state and available fiscal
banking instability—have moderated since April, the
resources (see the October 2023 Fiscal Monitor). Tis
balance remains tilted to the downside.
leaves many countries more vulnerable to crises and
First, the real estate crisis could deepen further in
demands a renewed focus on managing fiscal risks.
China, an important risk for the global economy. Te
Finally, despite the tightening of monetary policy,
policy challenge is complex. Restoring confidence
financial conditions have eased in many countries (see
requires promptly restructuring struggling property
the October 2023 Global Financial Stability Report).
developers, preserving financial stability, and address-
Te danger is of a sharp repricing of risk, especially
ing the strains in local public finance. If real estate
for emerging markets, that would appreciate further
prices decline too rapidly, the balance sheets of banks
the US dollar, trigger capital outflows, and increase
and households will worsen, with the potential for
borrowing costs and debt distress.
serious financial amplification. If real estate prices
are artificially propped up, balance sheets will be
Policies
protected for a while, but this may crowd out other
investment opportunities, reduce new construction
Under our baseline scenario, inflation continues
activity, and have an adverse impact on local govern-
to recede as central banks maintain a tight stance.
ment revenues through reduced land sales. Either way,
With many countries near the peak of their tightening
China’s economy needs to pivot away from a credit-
cycles, little additional tightening is warranted. How-
driven real estate model of growth.
ever, easing prematurely would squander the gains
Second, commodity prices could become more vol-
achieved in the past 18 months. Once the disinflation
atile under renewed geopolitical tensions and disrup-
process is firmly on its way and near-term inflation
tions linked to climate change. Since June, oil prices
expectations are decreasing, adjusting the policy rate
have increased by about 25 percent, on the back of
downward will allow the monetary policy stance, that
extended supply cuts from OPEC+ (the Organization
is, the real interest rate, to remain unchanged until
of the Petroleum Exporting Countries plus selected
inflation targets are in sight.
nonmembers) countries. Food prices remain elevated
Fiscal policy needs to support the monetary strategy
and could be disrupted further by an escalation of the
and help the disinflation process. In 2022, fiscal and
war in Ukraine, causing important hardship for many
monetary policies were pulling in the same direction,
low-income countries. Tis, of course, represents a
as many of the pandemic emergency fiscal measures
serious risk to the disinflation strategy. Geoeconomic
were unwound. In 2023, the degree of alignment has
fragmentation has also led to a sharp increase in
decreased. Most worrying is the case of the United
the dispersion in commodity prices across regions,
States, where the fiscal stance has deteriorated substan-
including critical minerals. As Chapter 3 of this report
tially. Fiscal policy in the US should not be procycli-
analyzes, this could pose serious macroeconomic risks
cal, even less so at this stage of the inflation cycle.
going forward, including to the climate transition.
More broadly, fiscal policy everywhere should focus on
Tird, while both underlying and headline infla-
rebuilding fiscal buffers that have been severely eroded
tion have decreased, they remain uncomfortably
by the pandemic and the energy crisis, for instance, by
high. Near-term inflation expectations have risen
removing energy subsidies.
markedly above target, although they now appear
We should also return our focus to the medium
to be turning a corner. As Chapter 2 of this report
term. Here the picture is becoming darker. Medium-
details, bringing these near-term inflation expecta-
term growth prospects are weak, especially for
tions back down is critical to winning the battle
emerging market and developing economies.
against inflation. With tight labor markets, ample
Te implications are profound: a much slower
xiv
International Monetary Fund | October 2023
FOREWORD
convergence toward the living standards of advanced
contravene World Trade Organization rules and
economies, reduced fiscal space, increased debt
distort international trade. Second, countries should
vulnerabilities and exposure to shocks, and dimin-
safeguard the flow of critical minerals needed for the
ished opportunities to overcome the scarring from
climate transition, as well as that of agricultural com-
the pandemic and the war.
modities. Such “green corridors” would help reduce
With lower growth, higher interest rates, and
volatility and accelerate the green transition.
reduced fiscal space, structural reforms become key.
Finally, all countries should aim to limit geoeco-
Higher long-term growth can be achieved through a
nomic fragmentation that prevents joint progress
careful sequence of structural reforms, especially those
toward common goals and instead work toward
focused on governance, business regulations, and
restoring trust in rules-based multilateral frameworks
the external sector. Tese “first-generation” reforms
that enhance transparency and policy certainty and
help unlock growth and make subsequent reforms—
help foster a shared global prosperity. A robust global
whether to credit markets, or for the green transi-
financial safety net with a well-resourced IMF at its
tion—much more effective.
center is essential.
Multilateral cooperation can help ensure that all
countries achieve better growth outcomes. First,
Pierre-Olivier Gourinchas
countries should avoid implementing policies that
Economic Counsellor
International Monetary Fund | October 2023
xv
EXECUTIVE SUMMARY
Te global recovery from the COVID-19 pandemic
Risks to the outlook are more balanced than they
and Russia’s invasion of Ukraine remains slow and
were six months ago, on account of the resolution of
uneven. Despite economic resilience earlier this year,
US debt ceiling tensions and Swiss and US authorities’
with a reopening rebound and progress in reduc-
having acted decisively to contain financial turbulence.
ing inflation from last year’s peaks, it is too soon to
Te likelihood of a hard landing has receded, but
take comfort. Economic activity still falls short of its
the balance of risks to global growth remains tilted
prepandemic path, especially in emerging market and
to the downside. China’s property sector crisis could
developing economies, and there are widening diver-
deepen, with global spillovers, particularly for com-
gences among regions. Several forces are holding back
modity exporters. Elsewhere, as Chapter 2 explains,
the recovery. Some reflect the long-term consequences
near-term inflation expectations have risen and could
of the pandemic, the war in Ukraine, and increasing
contribute—along with tight labor markets--to core
geoeconomic fragmentation. Others are more cyclical in
inflation pressures persisting and requiring higher
nature, including the effects of monetary policy tight-
policy rates than expected. More climate and geopoliti-
ening necessary to reduce inflation, withdrawal of fiscal
cal shocks could cause additional food and energy price
support amid high debt, and extreme weather events.
spikes. As Chapter 3 explains, intensifying geoeconomic
Global growth is forecast to slow from 3.5 percent in
fragmentation could constrain the flow of commodities
2022 to 3.0 percent in 2023 and 2.9 percent in 2024.
across markets, causing additional price volatility and
Te projections remain below the historical (2000-19)
complicating the green transition. Amid rising debt-
average of 3.8 percent, and the forecast for 2024 is
service costs, more than half of low-income developing
down by 0.1 percentage point from the July 2023
countries are in or at high risk of debt distress.
Update to the World Economic Outlook. For advanced
Tere is little margin for error on the policy front.
economies, the expected slowdown is from 2.6 percent
Central banks need to restore price stability while
in 2022 to 1.5 percent in 2023 and 1.4 percent in
using policy tools to relieve potential financial stress
2024, amid stronger-than-expected US momentum but
when needed. As Chapter 2 explains, effective mon-
weaker-than-expected growth in the euro area. Emerg-
etary policy frameworks and communication are vital
ing market and developing economies are projected to
for anchoring expectations and minimizing the output
have growth modestly decline, from 4.1 percent in 2022
costs of disinflation. Fiscal policymakers should
to 4.0 percent in both 2023 and 2024, with a down-
rebuild budgetary room for maneuver and withdraw
ward revision of 0.1 percentage point in 2024, reflecting
untargeted measures while protecting the vulner-
the property sector crisis in China. Forecasts for global
able. Reforms to reduce structural impediments to
growth over the medium term, at 3.1 percent, are at
growth--by, among other things, encouraging labor
their lowest in decades, and prospects for countries to
market participation—would smooth the decline of
catch up to higher living standards are weak. Global
inflation to target and facilitate debt reduction. Faster
inflation is forecast to decline steadily, from 8.7 percent
and more efficient multilateral coordination is needed
in 2022 to 6.9 percent in 2023 and 5.8 percent in
on debt resolution to avoid debt distress. Coopera-
2024. But the forecasts for 2023 and 2024 are revised
tion is needed as well to mitigate the effects of climate
up by 0.1 percentage point and 0.6 percentage point,
change and speed the green transition, including (as
respectively, and inflation is not expected to return to
Chapter 3 explains) by ensuring steady cross-border
target until 2025 in most cases.
flows of the necessary minerals.
xvi
International Monetary Fund | October 2023
1
GLOBAL PROSPECTS AND POLICIES
Growing Global Divergences
policy stimulus, and greater feasibility of remote
work. Tese factors supported livelihoods during
More than three years after the global economy suf-
the pandemic, and household consumption is now
fered the largest shock of the past 75 years, the wounds
broadly back to prepandemic trends. Among advanced
are still healing, amid widening growth divergences
economies, private consumption has been stron-
across regions. After a strong initial rebound from the
ger in the United States than in the euro area, with
depths of the COVID-19 pandemic, the pace of recov-
households receiving larger fiscal transfers early in the
ery has moderated. Several forces are holding back the
pandemic and spending the associated savings more
recovery. Some reflect the long-term consequences of
quickly; being better insulated from the rise in energy
the pandemic, Russia’s war in Ukraine, and increasing
prices resulting from the war in Ukraine; and feeling
geoeconomic fragmentation. Others are more cyclical,
relatively confident amid historically tight US labor
including the effects of monetary policy tightening
markets, which have supported real disposable incomes
necessary to reduce inflation, withdrawal of fiscal sup-
(Figure 1.1, panel 2). Among emerging market and
port amid high debt, and extreme weather events.
developing economies, the consumption shortfall is
Despite signs of economic resilience earlier this year
particularly large in China, reflecting tight restrictions
and progress in reducing headline inflation, economic
on mobility during the COVID-19 crisis.
activity is still generally falling short of prepandemic
Divergences in labor market performance across
(January 2020) projections, especially in emerging
regions broadly mirror those for output and consump-
market and developing economies (Figure 1.1, panel 1).
tion. Employment and labor participation rates are
Te strongest recovery among major economies has
estimated to exceed prepandemic trends in advanced
been in the United States, where GDP in 2023 is esti-
economies but to remain significantly below them in
mated to exceed its prepandemic path. Te euro area
emerging market and developing economies, reflect-
has recovered, though less strongly—with output still
ing more severe output losses and much weaker social
2.2 percent below prepandemic projections, reflecting
greater exposure to the war in Ukraine and the associ-
protection. Countries that had the most limited fiscal
ated adverse terms-of-trade shock, as well as a spike in
space are also those where employment shortfalls are
the largest (ILO 2023). Among advanced economies,
imported energy prices. In China, the pandemic-related
the euro area has seen larger employment gains than
slowdown in 2022 and the property sector crisis con-
the United States. Tis may reflect more extensive use
tribute to the larger output losses of about 4.2 percent,
in the former of worker-retention programs modeled
compared with prepandemic predictions. Other
emerging market and developing economies have seen
on the German Kurzarbeit short-time work scheme
even weaker recoveries, especially low-income countries,
(IMF 2020), which protect workers’ income and
where output losses average more than 6.5 percent.
allow businesses to retain firm-specific human capital,
Higher interest rates and depreciated currencies have
reducing the costly process of separation, rehiring, and
exacerbated the difficulties of low-income countries,
training. In the euro area, these programs bolstered
placing more than half either at high risk of distress or
employment during the most challenging phases of
already in distress. Overall, global output for 2023 is
the crisis and accelerated the recovery when economies
estimated at 3.4 percent (or about $3.6 trillion in 2023
reopened (Figure 1.1, panel 3).
prices) below prepandemic projections.
Investment, on the other hand, has uniformly fallen
Private consumption has also recovered faster in
short of prepandemic trends across regions. Businesses
advanced economies than in emerging market and
have shown less enthusiasm for expansion and risk
developing economies, owing to an earlier reopening
taking amid rising interest rates, withdrawal of fiscal
in the former group facilitated by greater availability
support, dimmer prospects for product demand,
of effective vaccines, stronger safety nets, more ample
stricter lending conditions, and growing uncertainties
International Monetary Fund | October 2023
1
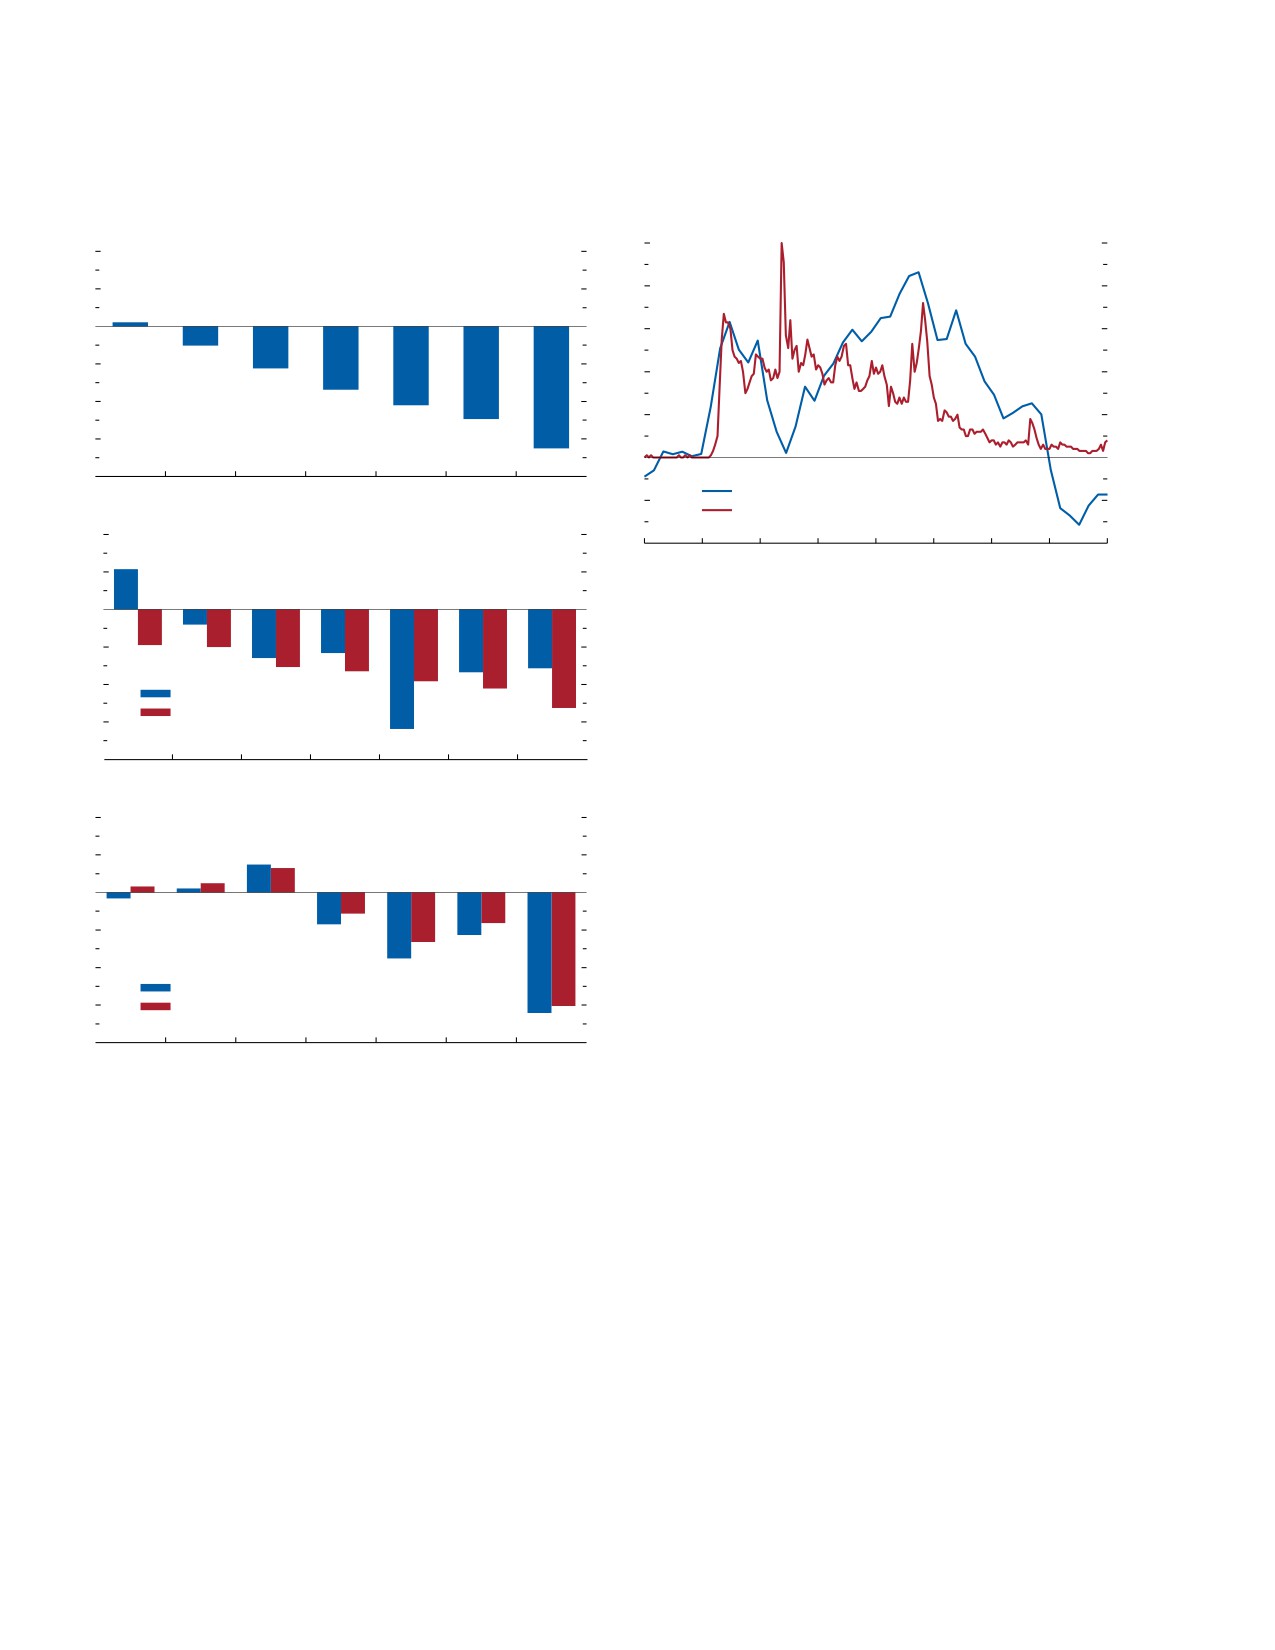
WORLD ECONOMIC OUTLOOK: Navigating Global Divergences
Figure 1.1. Incomplete Recovery: Scarring from the Shocks
Figure 1.2. The COVID-19 Shock: Returning to Normal
of 2020-22
(Standard deviations from average value; index, 100 = highest point
(Percent; deviation in 2023 from prepandemic projections)
worldwide during 2008-23, on right scale)
5
100
4
1. Real GDP Loss
2
4
80
0
3
60
-2
2
40
-4
1
20
-6
0
0
-8
US
AEs
EA
World
China
EMDEs
LIDCs
Global Supply Chain Pressure Index
-1
–20
Google Trends interest in COVID-19 (right scale)
6
2. Real Domestic Demand Shortfall
-2
–40
July
Jan.
July
Jan.
July
Jan.
July
Jan.
Aug.
3
2019
20
20
21
21
22
22
23
23
0
Sources: Federal Reserve Bank of New York, Global Supply Chain Pressure Index;
Google Trends.
-3
Note: On right scale, numbers represent search interest relative to the highest
point (100) during 2008-23 worldwide.
-6
Private consumption
Capital formation
-9
-12
75 million to 95 million more people were living in
US
AEs
EA
World
China
EMDEs
LIDCs
extreme poverty in 2022 compared with prepandemic
4
3. Labor Market Scarring
estimates. Spikes in food prices and related insecurities
following Russia’s invasion of Ukraine, as well as bouts
2
of extreme weather, have accentuated these difficulties.
0
Te global average temperature in July 2023 was the
highest on record for any month, amid reports of cat-
-2
astrophic flooding, heat waves, and wildfires in many
-4
regions. Overall, the global prevalence of undernour-
Employment
-6
Participation
ishment is significantly higher than before the pan-
demic (FAO and others 2023).
-8
US
AEs
EA
World
China
EMDEs
LIDCs
Source: IMF staff calculations.
Resilient Start to 2023, Signs of Slowdown
Note: “Prepandemic projections” refers to those in the January 2020 World
Economic Outlook Update. AEs = advanced economies; EA = euro area; EMDEs =
Despite these persistent challenges, several head-
emerging market and developing economies; LIDCs = low income developing
winds to global growth subsided earlier this year. Te
countries.
World Health Organization announced in May that
it no longer considered COVID-19 a global health
regarding geoeconomic fragmentation. Higher leverage
emergency, and infections and hospitalizations appear
has further dampened investment (see Chapter 2 of
to remain relatively limited, despite a recent uptick
the April 2022 World Economic Outlook [WEO]),
in some regions. Supply chains, which the pandemic
which remains 3 percent to 10 percent lower across
disrupted, have largely normalized, with shipping costs
regions than had been projected before the pandemic
and suppliers’ delivery times back to prepandemic lev-
(Figure 1.1, panel 2).
els (Figure 1.2). And global financial conditions eased
Moreover, the pandemic, war in Ukraine, and wors-
after Swiss and US authorities took strong action in
ening climate shocks have contributed to a reversal in
March to contain turbulence in their banking sectors.
decades-long poverty reduction trends. According to
Amid these conditions, global GDP expanded by
World Bank staff estimates (Mahler and others 2022),
3.4 percent in the second quarter of 2023 compared
2
International Monetary Fund | October 2023
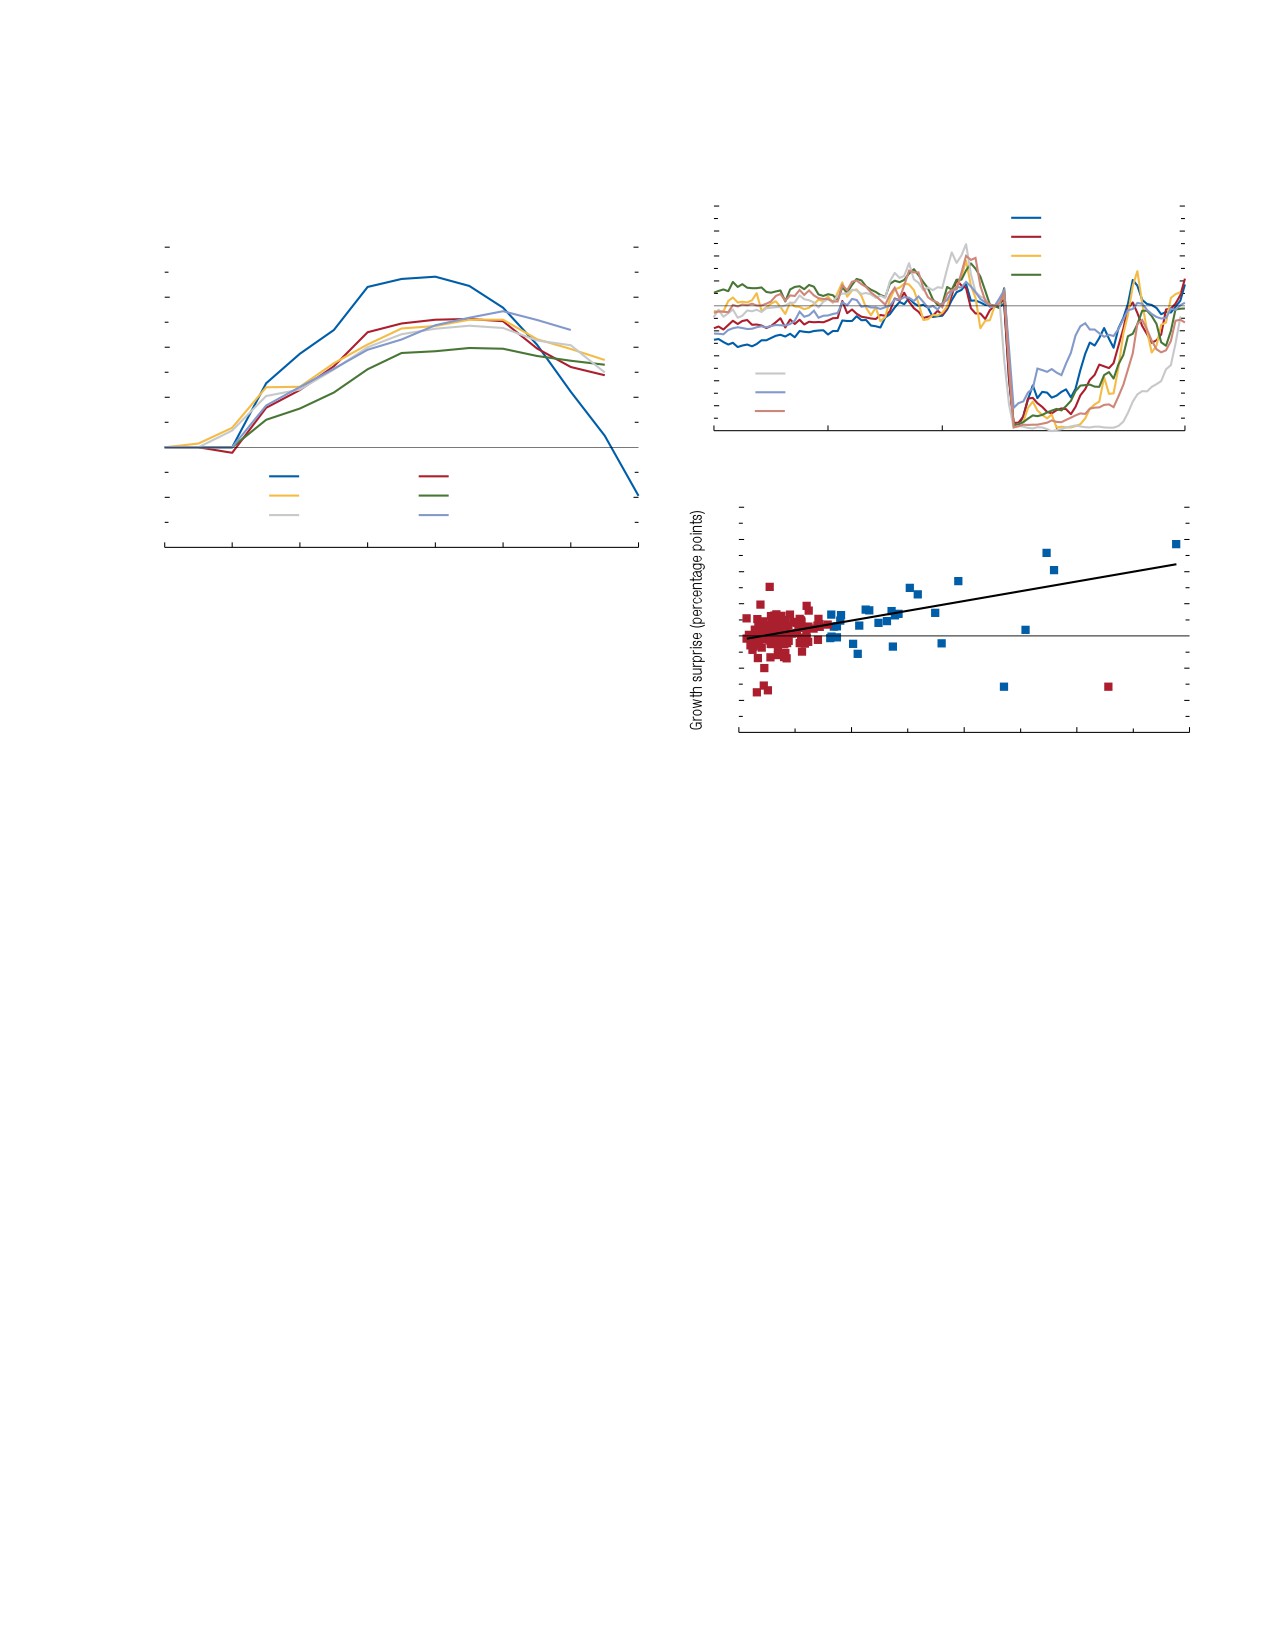
CHAPTER 1 Global Prospects and Policies
Figure 1.3. Cumulative Excess Savings in Advanced
Figure 1.4. Tourism Returning to Normal
Economies
(Percent of GDP)
180
1. Monthly Arrivals of Foreign Visitors
Southern Europe
(Index, Dec. 2019 = 100)
160
Rest of Europe
8
140
United Kingdom
United States
120
6
100
80
4
60
Asia excl. China
40
Latin America and the Caribbean
2
20
Rest of world
0
0
Jan.
Jan.
Jan.
Jan.
Apr.
2015
17
19
21
23
United States
United Kingdom
–2
France
Germany
80
2. Tourism Dependence versus Growth Performance, 2021-23
Italy
Spain
60
MAC
MDV
–4
2019:Q3
20:Q1
20:Q3
21:Q1
21:Q3
22:Q1
22:Q3
23:
ABW
40
Q1
BHS
20
Source: de Soyres, Moore, and Ortiz (2023).
SYC
0
Note: Stock begins accumulating from 0 at t = -1, in which t = 0 is the first period
of low growth due to COVID-19. Excess savings are calculated as deviation from
-20
the predicted saving rate using a Hamilton trend.
High tourism
Other
–40
-60
0
10
20
30
40
with a year earlier--outperforming forecasts, including
Tourism activities, 2019 (percent of GDP)
those in the April 2023 WEO. Te resilience reflected
strong consumption amid tight labor markets in the
Sources: Haver Analytics; World Travel & Tourism Council; and IMF staff
calculations.
United States and robust activity in economies with
Note: In panel 1, series is the normalized sum of arrivals for each region based on
large travel and tourism sectors, such as Italy, Mexico,
data for 41 economies. In panel 2, the x-axis measures the direct share of travel
and tourism in GDP in 2019. The growth surprise on the y-axis measures the
and Spain. Tese developments offset a slowdown in
difference between the cumulative GDP growth in 2021-23 and its projected value
more interest-rate-sensitive manufacturing sectors.
in the January 2020 World Economic Outlook Update. Data labels in the figure use
Tat said, there are signs the rebound is fading:
International Organization for Standardization (ISO) country codes. excl. =
excluding.
••
Diminishing pandemic-era savings: The stock of
savings built during the pandemic, which has so
far supported consumers, is declining in advanced
(Figure 1.4, panel 2). These economies had suffered
economies, especially the United States, as illus-
especially sharp contractions in GDP at the onset of
trated in Figure 1.3.1 This implies fewer resources
the pandemic (Milesi-Ferretti 2021). But with the
for households to draw on as they contend with a
recovery in tourism maturing, the boost to growth
still-elevated cost of living and more restricted credit
is waning.2 Leading indicators for services now indi-
availability in the context of monetary tightening
cate weaker growth or declining output (Figure 1.5,
aimed at reducing inflation.
panel 2) in economies that previously enjoyed a
••
Slowing catch-up in services, including travel: Interna-
strong rebound.
tional tourist arrivals are approaching prepandemic
••
Persistent manufacturing slowdown: Recent data
levels in most regions (Figure 1.4, panel 1). The
releases point to a wide-ranging slowdown or con-
recovery of travel during 2021-23 has come with
traction in the manufacturing sector, with related
especially strong economic growth in economies
declines in industrial production, investment, and
with a large share of tourism activities in GDP
international trade in goods. This weakness reflects
1Estimates of the stock of excess household savings—the cumu-
2A tourism share that is higher by 10 percentage points of GDP
lation of saving beyond the prepandemic trend—come with a range
comes with cumulative growth that is higher by 12 percentage points
of uncertainty and can differ across methodological approaches. For
in 2021-23 (Figure 1.4, panel 2), but for 2023 alone, the relation-
the United States, they generally show a consistent pattern, with the
ship is less than half as strong. Higher-tourism-share economies
stock declining (see, for example, Abdelrahman and Oliveira 2023).
suffered sharper contractions in 2020 (Milesi-Ferretti 2021).
International Monetary Fund | October 2023
3
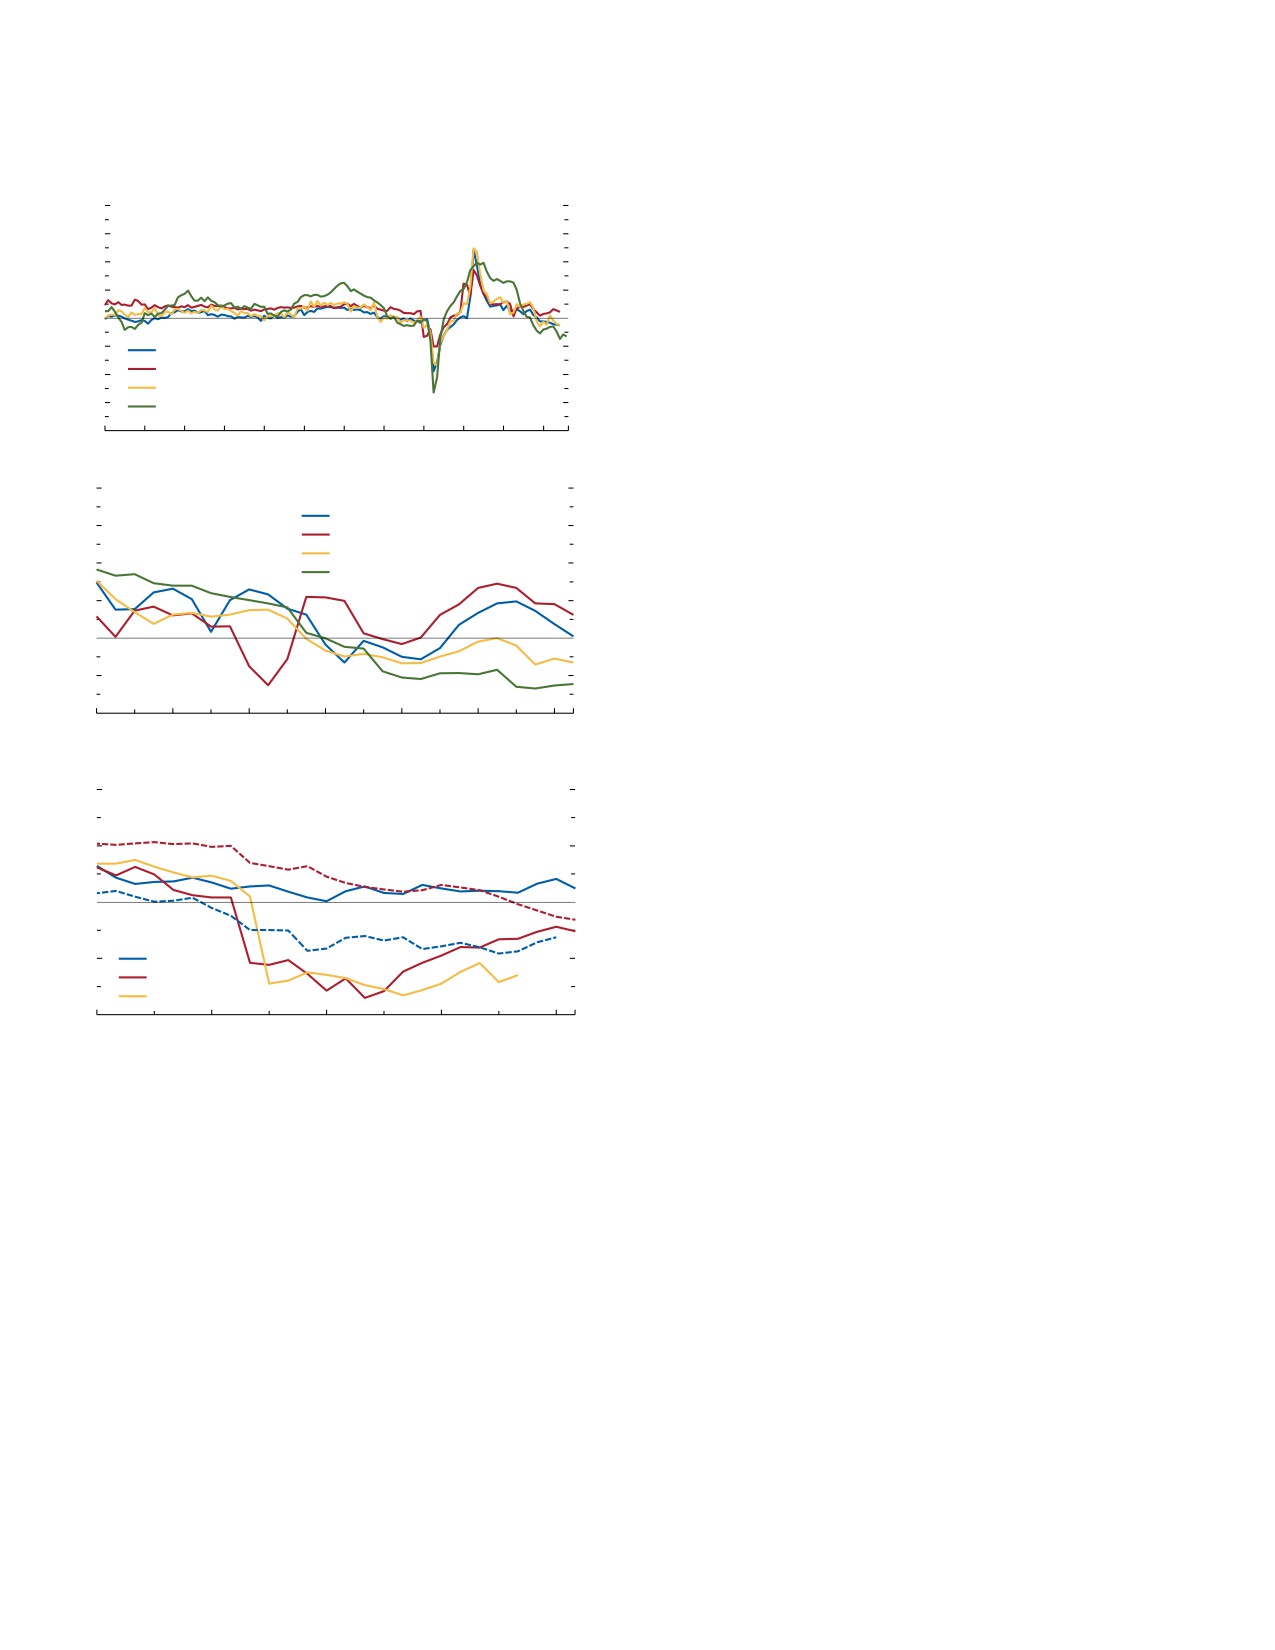
WORLD ECONOMIC OUTLOOK: Navigating Global Divergences
Figure 1.5. Slower Growth Momentum Ahead
Signs that tightening efforts are paying off are increas-
ingly apparent, with global inflation steadily declining
40
1. Industrial Production and Trade to Weaken Further
70
from its multidecade peak in 2022 amid tighter credit
(Percent, year over year; index, 50+ = expansion,
30
65
on right scale)
availability and cooling housing markets. Part of the
20
60
slowdown also reflects more idiosyncratic develop-
10
55
ments, such as the property sector crisis in China.
0
50
–10
AEs: industrial production
45
EMDEs: industrial production
China: Slower Growth
–20
40
World trade volume
–30
AEs: PMI manufacturing (right scale)
35
China’s growth momentum is fading following a
-40
30
COVID-19 reopening surge in early 2023. Growth
2012
13
14
15
16
17
18
19
20
21
22
23
slowed from 8.9 percent in the first quarter of 2023
70
2. Services Rebound Fading, Manufacturing Weak
(seasonally adjusted annualized quarterly rate) to
(Index, 50+ = expansion)
AEs: PMI services
4.0 percent in the second quarter. With ample eco-
65
EMDEs: PMI services
nomic slack and declining energy and food prices,
AEs: PMI mfg output index
60
inflation fell to an estimated 0.2 percent (year over
AEs: PMI mfg backlog of work index
year) in the second quarter of 2023.
55
High-frequency indicators suggest further weakness
50
with the property sector crisis in the country leading
45
the factors hampering growth. Country Garden—
China’s largest property developer and a major benefi-
40
July
Nov.
Mar
July
Nov.
Mar.
Aug.
ciary of government support—is facing severe liquidity
2021
21
22
22
22
23
23
stress, a sign that real estate distress is spreading to
stronger developers, despite policy easing measures.
4
3. Consumer and Business Confidence Still Low
(Standard deviations from average value)
Property developers face severe funding constraints,
preventing them from completing presold homes. Tis
2
is undermining home buyer confidence and prolonging
the property sector downturn. Meanwhile, real estate
0
investment and housing prices continue to decline,
putting pressure on local governments’ revenues
-2
United States
Euro area
from land sales and threatening already fragile public
China
finances (Figure 1.6, panel 1).
–4
July
Jan.
July
Jan.
Aug.
Tese developments, together with labor market
2021
22
22
23
23
uncertainty—as reflected in elevated youth unemploy-
ment that reached more than 20 percent in June 2023
Sources: Haver Analytics; and IMF staff calculations.
Note: Solid lines in panel 3 show consumer confidence, and dashed lines denote
(Figure 1.6, panel 2)—have weighed on consumption.
business confidence. AEs = advanced economies; EMDEs = emerging market and
Consumer confidence remains subdued despite the
developing economies; mfg = manufacturing; PMIs = purchasing managers’
indexes.
economy’s reopening in the first quarter. Industrial
production, business investment, and exports are also
weakening, reflecting a combination of waning foreign
the combined effects of the postpandemic shift in
demand and geopolitical uncertainty. Commodity
consumption back toward services, weaker demand
exporters and countries that are part of the Asian
stemming from a higher cost of living, the unwind-
industrial supply chain are the most exposed to China’s
ing of crisis policy support, tighter credit conditions,
loss of momentum.
and general uncertainty amid intensified geoeco-
nomic fragmentation (Figure 1.5, panel 1).
Inflation: Nearer, but Not Quite There
Part of the slowdown is policy induced--the result
Global headline inflation has more than halved,
of the globally synchronous central bank tighten-
from its peak of 11.6 percent in the second quarter of
ing of monetary conditions to restore price stability.
2022 (at a quarterly annualized rate) to 5.3 percent
4
International Monetary Fund | October 2023
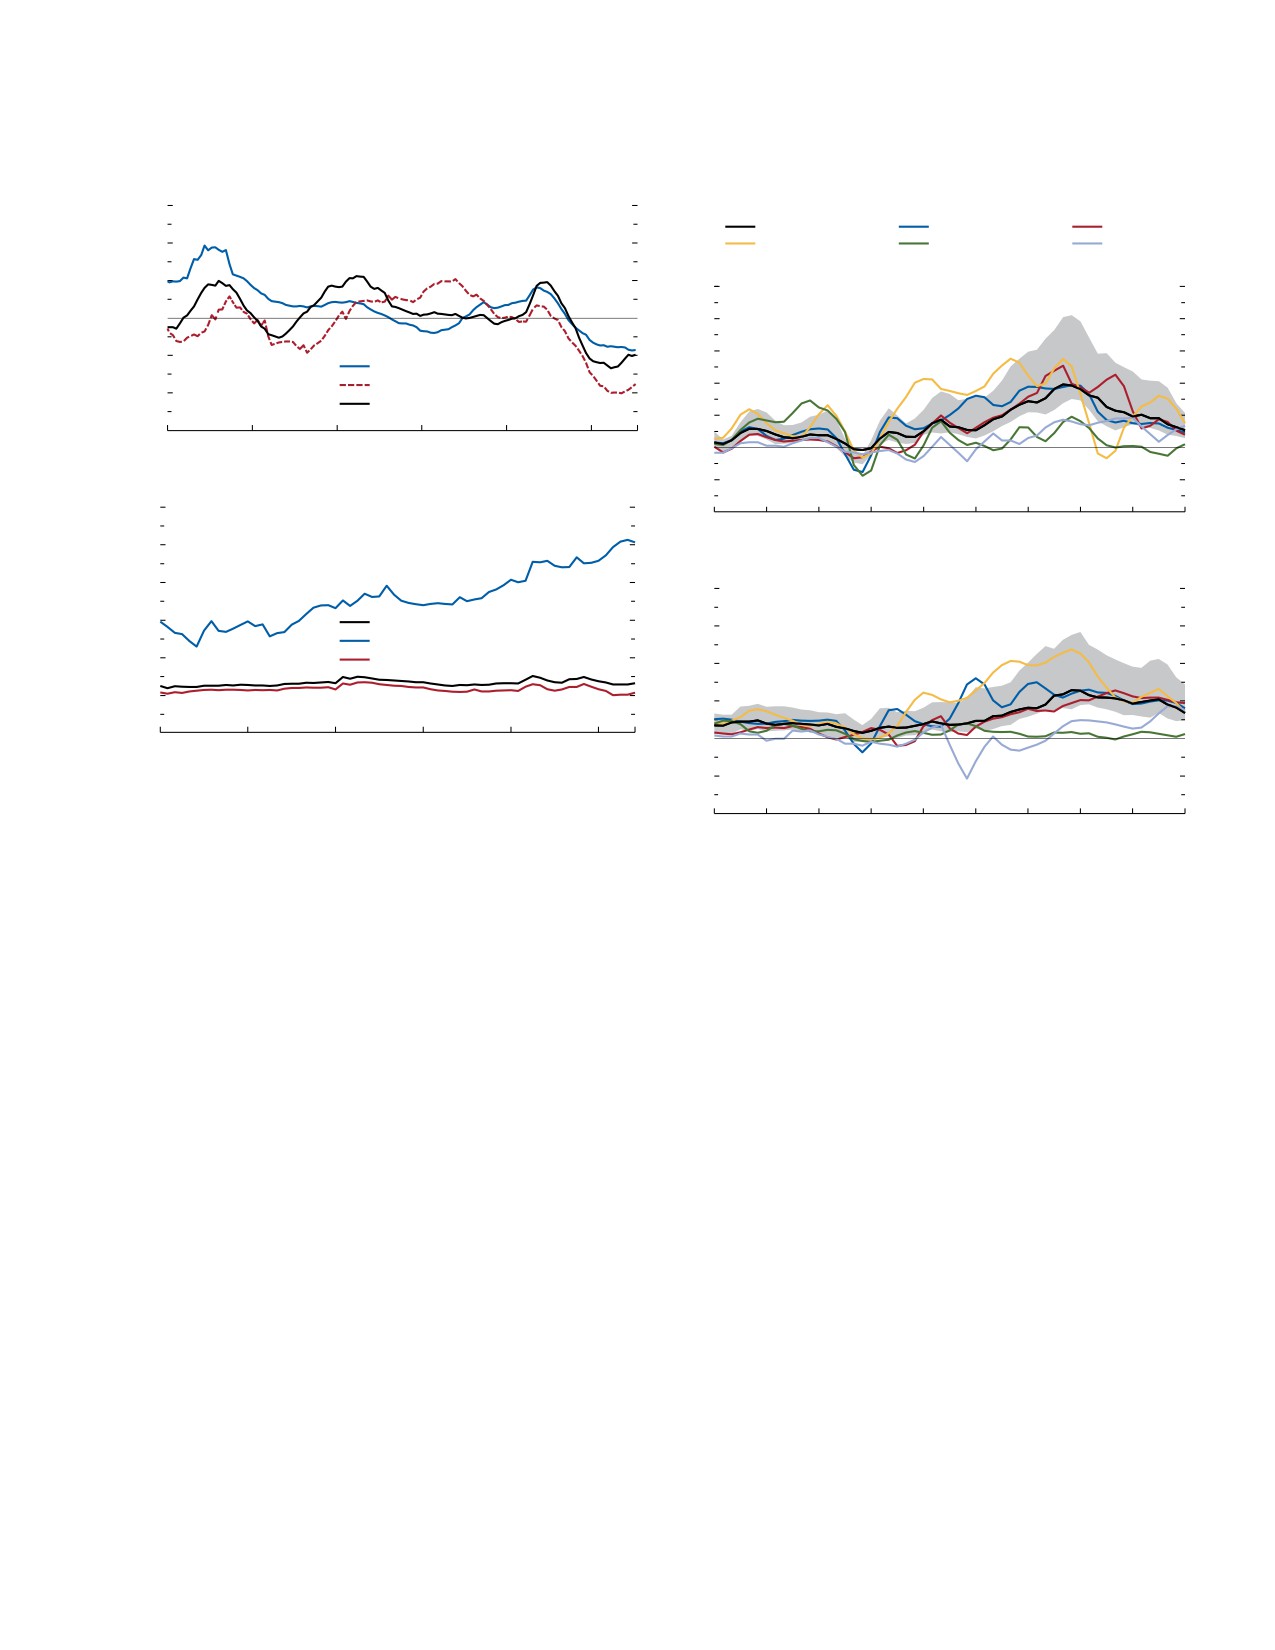
CHAPTER 1 Global Prospects and Policies
Figure 1.6. China’s Economy Losing Momentum
Figure 1.7. Inflation Turning the Corner
(Three-month annualized percent change, seasonally adjusted)
60
1. Deepening Real Estate Downturn
(Year-over-year percent change in 12-month moving sums)
Median country
United States
Euro area
40
Brazil
China
Japan
20
25
1. Headline Inflation
0
20
15
-20
Real investment (PPI-adjusted)
Starts
10
-40
Sales
5
-60
July
July
July
July
July
July July
0
2012
14
16
18
20
22
23
-5
24
2. Youth Unemployment Trending Up
-10
(Percent)
Jan.
July
Jan.
July
Jan.
July
Jan.
July
Jan.
July
20
2019
19
20
20
21
21
22
22
23
23
16
20
2. Core Inflation
12
Urban unemployment rate
15
Urban unemployment rate, ages 16-24
8
Urban unemployment rate, ages 25-59
10
4
5
0
0
Jan.
Jan.
Jan.
Jan.
Jan.
Jan. June
2018
19
20
21
22
23
23
-5
Sources: CEIC Data Company Limited; Haver Analytics; and IMF staff calculations.
-10
Note: In panel 1, real investment denotes PPI-adjusted fixed asset investment in
Jan.
July
Jan.
July
Jan.
July
Jan.
July
Jan.
July
real estate sector. The figure shows year-over-year percent change of housing
2019
19
20
20
21
21
22
22
23
23
starts and sales measured in square meters. PPI = producer price index.
Sources: Haver Analytics; and IMF staff calculations.
Note: The figure shows the developments in headline and core inflation across 17
emerging market and developing economies and 18 advanced economies. The 35
in the second quarter of 2023. About four-fifths of
sample economies account for approximately 81 percent of 2022 world output.
Core inflation is the change in prices for goods and services, excluding those for
the gap between the 2022 peak and the prepandemic
food and energy (or the closest available measure). For the euro area (and other
(2017-19) annual average level of 3.5 percent has
European countries for which data are available), energy, food, alcohol, and
closed. Among major economies, headline inflation in
tobacco are excluded. The grey band depicts the 25th to 75th percentiles of
inflation across countries.
the second quarter of 2023 ranged from -0.1 percent
in China (at a quarterly annualized rate) to 2.8 percent
in the euro area and 2.7 percent in the United States
(Organization of the Petroleum Exporting Countries
(Figure 1.7). A narrowing in the cross-country varia-
plus selected nonmember countries) were partly offset
tion in headline inflation has accompanied the decline.
by strong oil output growth in non-OPEC countries,
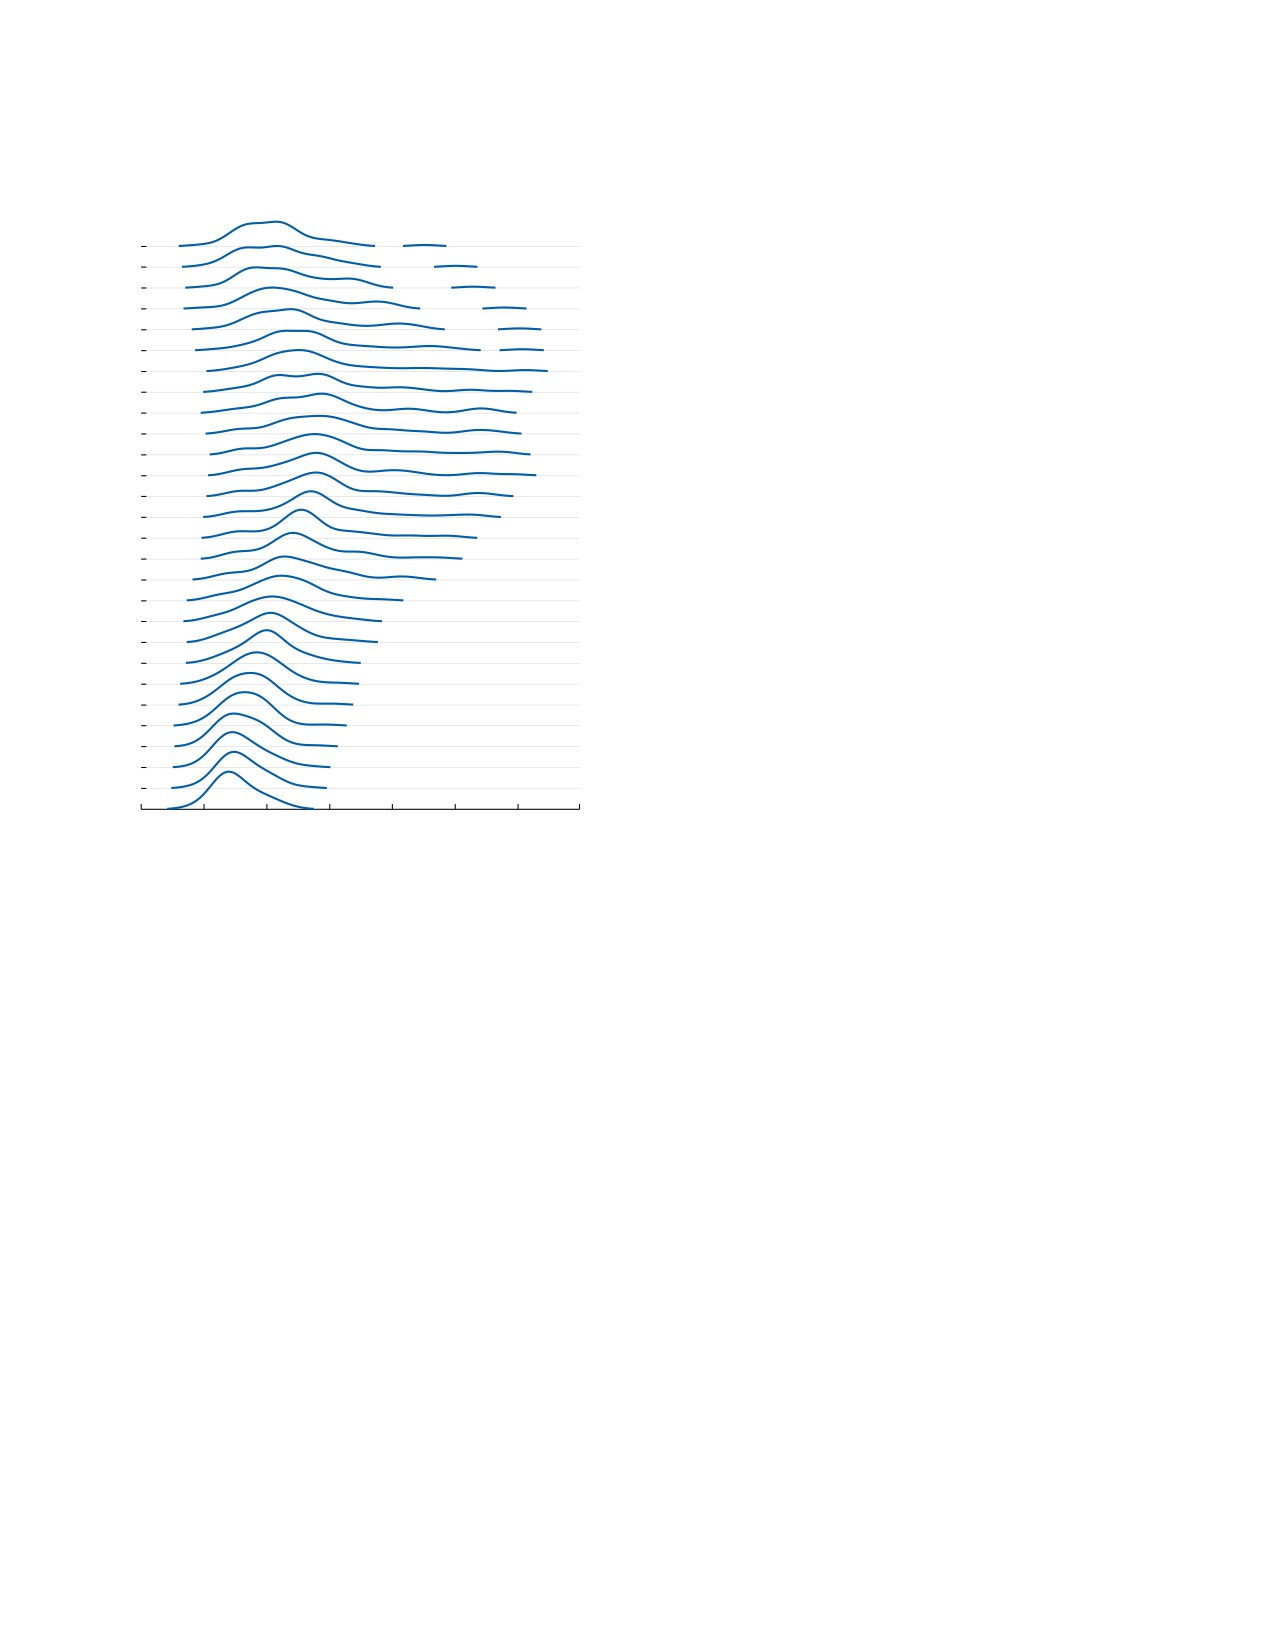
As Figure 1.8 reports, the international distribution
most notably the United States. Natural gas prices
of inflation rates widened during the 2022 inflation
also remain well below their 2022 peak, reflecting
surge, becoming skewed upward, but has since begun
ample storage and supplies from Norway and north-
to normalize.
ern Africa. Food prices have declined modestly in
A fall in energy prices and—to a lesser extent--in
2023, with lower demand offset by supply reductions,
food prices has driven the decline in headline inflation.
notably those resulting from Russia’s withdrawal from
As the Commodity Special Feature in this chapter
the Black Sea Grain Initiative in July, which reduced
reports, notwithstanding a rebound in July, crude oil
the supply of wheat to the global market. Te normal-
prices have declined during 2023 and are well below
ization of supply chains has further contributed to the
their June 2022 peak, on the back of lower global
decline in headline inflation in most countries.
demand partly driven by tighter global monetary
Underlying (core) inflation has also declined, but
policy affecting activity. Supply curbs by OPEC+
more gradually. Global inflation excluding food and
International Monetary Fund | October 2023
5
WORLD ECONOMIC OUTLOOK: Navigating Global Divergences
Figure 1.8. Headline Inflation Distribution
these factors have differed markedly across economies.
(Percent, year over year)
Demand pressures in some advanced economies arose
from significant COVID-19-era fiscal payments to
July 23
households, as well as from ample monetary policy
stimulus early in the pandemic, which supported the
recovery in consumer spending. Tese policy-induced
Apr. 23
pressures declined as policy support subsided.
Pass-through effects include the effects of past relative
Jan. 23
price shocks—notably those to the price of energy—
on prices and costs in other industries through
Oct. 22
supply chain inputs and wage demands. An important
pass-through channel is, as Chapter 2 explains, the
rise in near-term inflation expectations, which has
July 22
implications for both wage and price setting. IMF staff
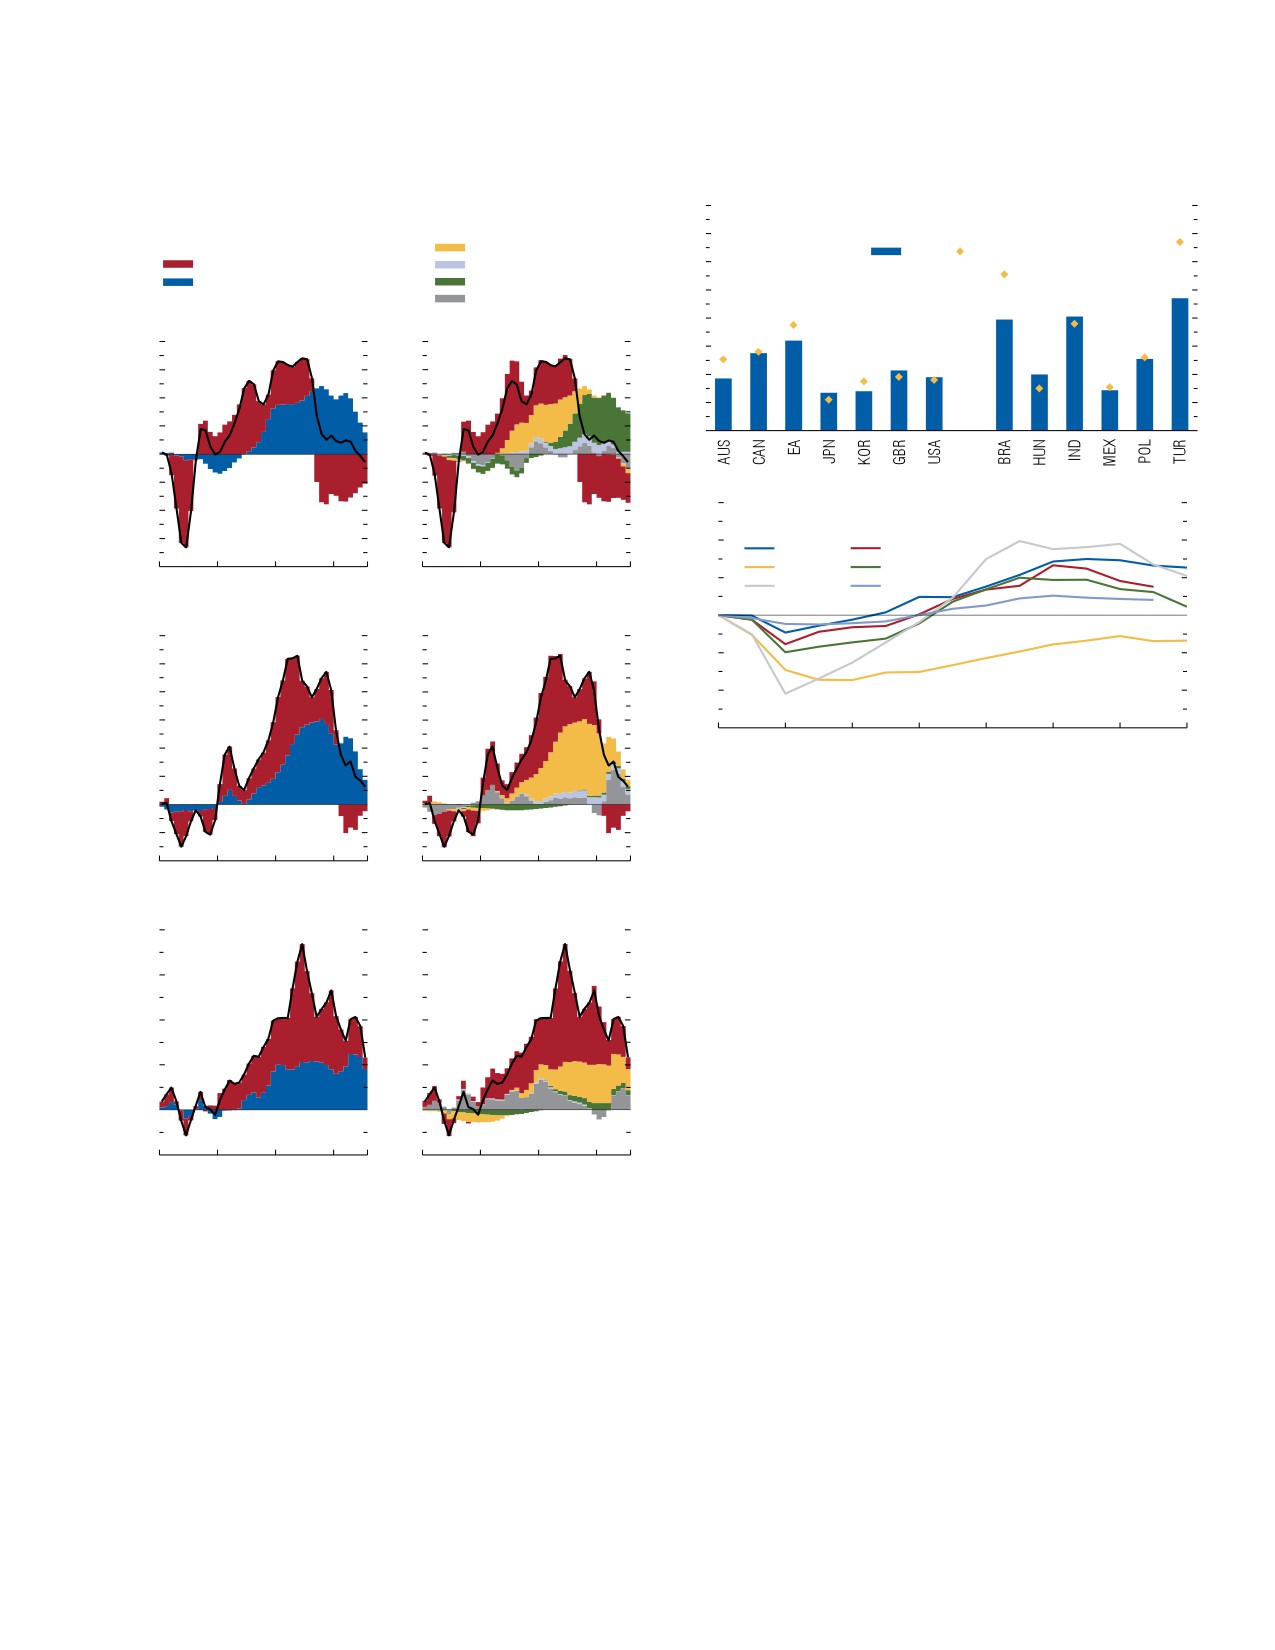
analysis (Figure 1.9) suggests that in the euro area and
Apr. 22
the United Kingdom, pass-through from past relative
price movements--in particular that from energy price
Jan. 22
shocks associated with external factors--has recently
played a larger role than in the United States in driving
core inflation (the staff’s methodology was the same as
Oct. 21
that used in Dao and others 2023).
In the United States, labor market tightness has
July 21
been an especially strong driver. Although labor
markets remain tight, especially in the United States,
Apr. 2021
the recent decline in the ratio of vacancies to the
-5
0
5
10
15
20
25
30
number of unemployed people suggests some easing
Sources: Organisation for Economic Co-operation and Development; and IMF staff
(Figure 1.10). Wage growth has remained contained,
calculations.
with wage-price spirals—in which prices and wages
Note: The figure shows the density distribution of headline inflation developments
across 29 advanced economies and 11 emerging market and developing
accelerate together for a sustained period—not gener-
economies.
ally taking hold in advanced economies (Figure 1.11).
At the same time, evidence shows that wages at the
bottom of the distribution have risen faster than
energy prices is down from a peak of 8.5 percent in
the average, compressing the wage distribution.
the first quarter of 2022 (at a quarterly annualized
Longer-term inflation expectations have remained well
rate) to 4.9 percent in the second quarter of 2023,
anchored and contributed little to recent movements
nearly two-thirds of the way back to the prepandemic
in core inflation (Figure 1.9; Chapter 2).
(2017-19) annual average of 2.8 percent. Among
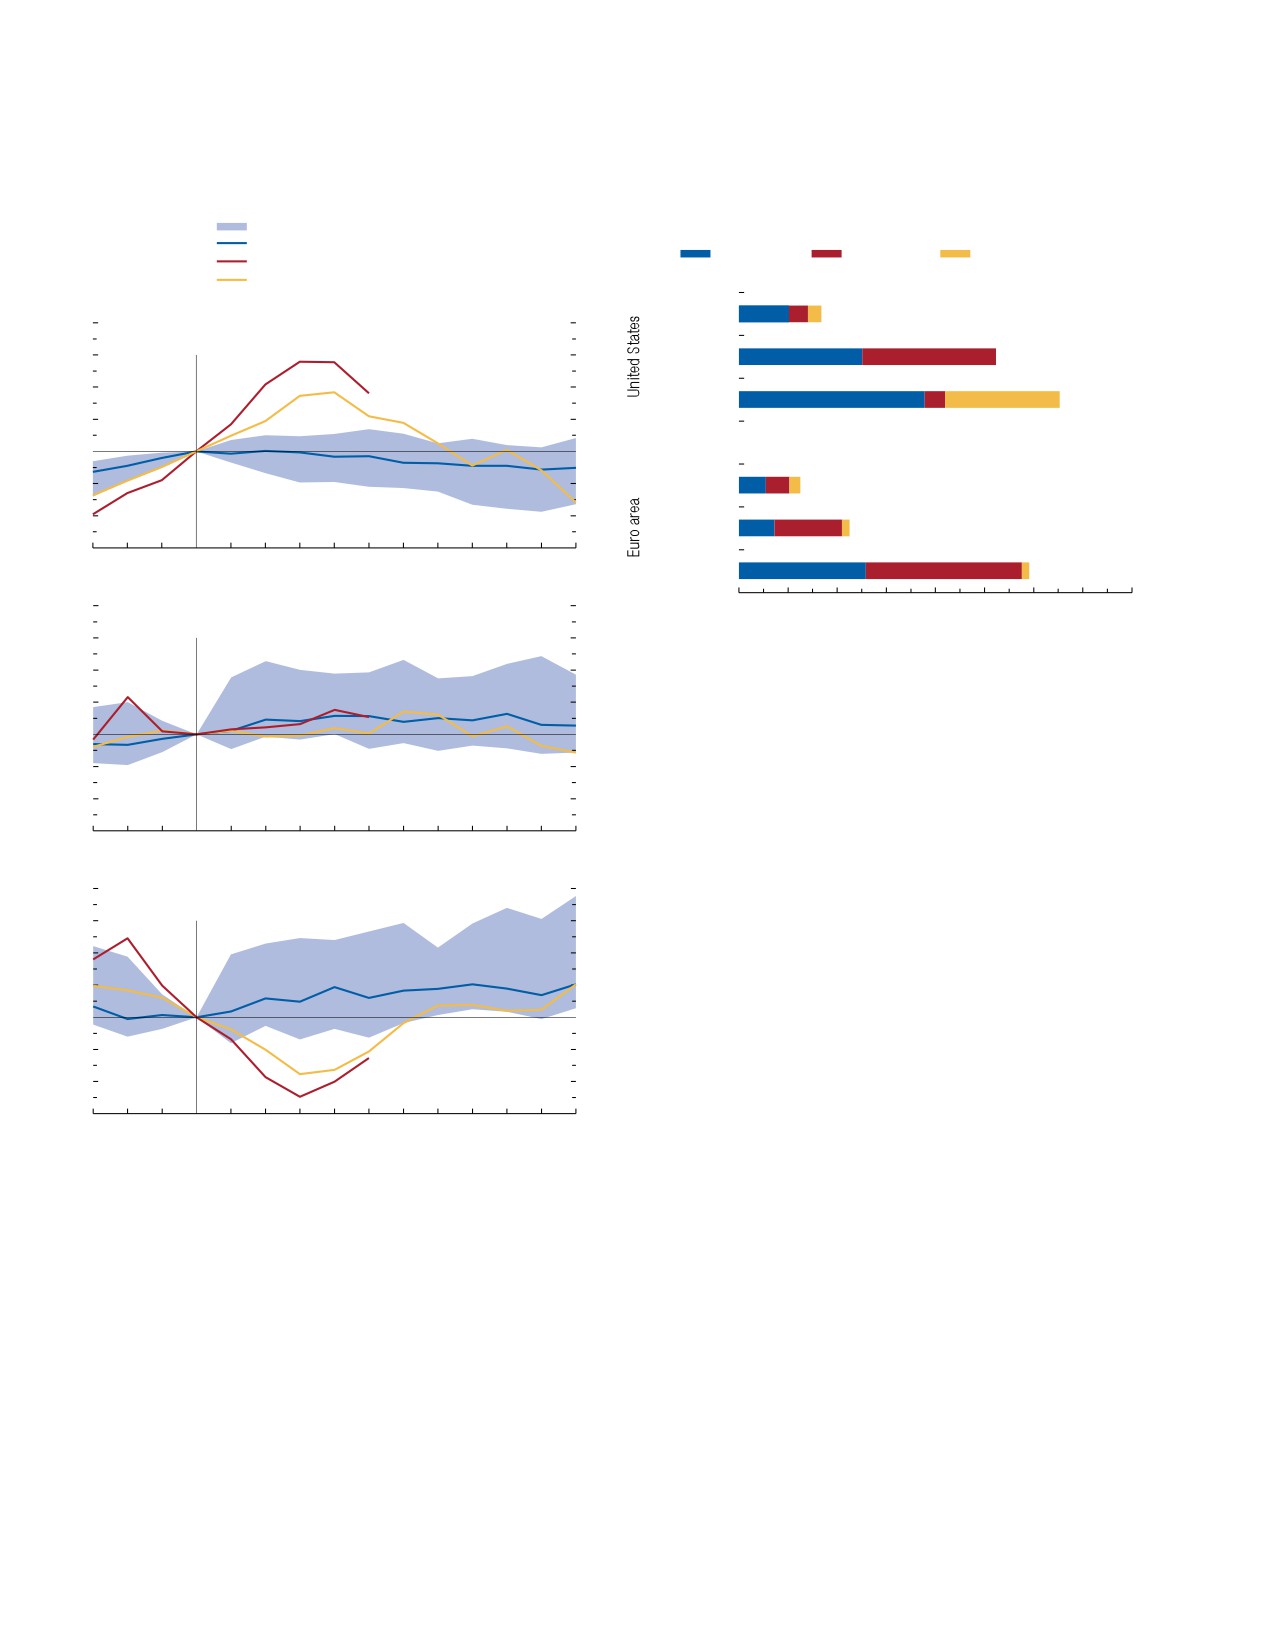
Company profits have increased robustly over the
major economies, in the second quarter of 2023,
past two years, with wages having risen more slowly
it ranged from 0.3 percent in China (at a quarterly
than prices (Figure 1.12). For the United States and
annualized rate) to 4.6 percent in the euro area
the euro area, a decomposition of the GDP deflator
and 4.7 percent in the United States. Data for July
into labor costs and profits shows that in the early
indicate a rise in inflation excluding food and energy
phase of the pandemic (2020-21), profits accounted
in most advanced economies; more data releases
for most of the rise in prices. But since 2022, labor
are needed to assess progress in reducing underly-
costs have contributed an increasing share to rising
ing inflation.
prices—particularly in the United States. Te rise
Te drivers of core inflation have reflected a combi-
in profits (sales revenue minus all costs) does not
nation of demand pressures, as shown in labor market
necessarily signal increased monopoly power, with
conditions and pass-through effects from past shocks
firms deliberately limiting supplies to raise prices in
to headline inflation shocks, including those arising
excess of the cost of producing an additional unit of
from supply shifts in various industries. Te roles of
output (marginal cost). Profits can rise when a surge
6
International Monetary Fund | October 2023
CHAPTER 1 Global Prospects and Policies
Figure 1.9. Different Drivers: Inflation in Selected Economies
Figure 1.10. Labor Markets Still Tight but Easing
(Percentage points; three-month annualized inflation; deviation from
December 2019)
16
1. Unemployment Rates
(Percent)
14
Pass-through effects
Latest
Dec. 2019
Headline inflation shocks
Longer-term expectations
12
Underlying (core) inflation
Labor market tightness
10
Residual
8
8
1. United States
8
6
6
6
4
4
4
2
2
2
0
0
0
-2
-2
1.2
2. Vacancy-to-Unemployment Ratios
-4
-4
(Change in vacancies per unemployed relative to 2019:Q4)
-6
-6
0.8
AUS
CAN
-8
-8
JPN
GBR
Jan.
Jan.
Jan.
Jan.
July
Jan.
Jan.
Jan.
Jan.
July
0.4
USA
EUR
2020
21
22
23
23
20
21
22
23
23
0.0
12
2. Euro Area
12
-0.4
10
10
8
8
-0.8
6
6
-1.2
2019:Q4
20:Q2
20:Q4
21:Q2
21:Q4
22:Q2
22:Q4
23:
4
4
Q2
2
2
0
0
Sources: Eurostat; Haver Analytics; national statistics agencies; Organisation for
Economic Co-operation and Development; and IMF staff calculations.
-2
-2
Note: Data labels in the figure use International Organization for Standardization
-4
-4
(ISO) country codes. EA = euro area; EUR = Europe.
Jan.
Jan.
Jan.
Jan.
July
Jan.
Jan.
Jan.
Jan.
July
2020
21
22
23
23
20
21
22
23
23
16
3. United Kingdom
16
marginal cost) across various sectors in major advanced
economies during 2019-22.3 Similarly, Colonna,
12
12
Torrini, and Viviano (2023) conclude that despite
8
8
profit share increases, firm markups were unchanged
or declined across several sectors in Germany and
4
4
Italy during 2022. Overall, these results suggest that
a rise in market power did not significantly contrib-
0
0
ute to the inflation surge of 2022. Moreover, there is
-4
-4
some evidence that since 2022, rising labor costs have
Jan.
Jan.
Jan.
Jan.
July
Jan.
Jan.
Jan.
Jan.
July
accounted for a significantly larger share of US price
2020
21
22
23
23
20
21
22
23
23
increases than profits.
Source: IMF staff calculations.
Even as central banks have taken decisive action,
Note: Underlying (core) inflation denotes weighted median inflation. Methodology
is as in Dao and others (2023) and Ball, Leigh, and Mishra (2022).
inflation remains above target in almost all economies
with an inflation target. Among major central banks
3Te IMF staff’s methodology is that illustrated in Box 1.2 of the
in demand meets supply constraints or when sup-
October 2022 World Economic Outlook. Te “economic markup”
ply constraints tighten, implying higher prices, and
(a producer’s price over true marginal costs, inclusive of the shadow
wages do not immediately adjust. As wages start to
cost of supply constraints) may be constant even while accounting
profits (total revenue minus costs) may show an increase. If supply
rise, profits can be expected to erode. Accordingly,
constraints remain, and nominal wages start to rise, prices could
IMF staff analysis based on firm-level data indicates
then remain unchanged, with the true markup remaining constant
little change in firms’ markups (prices in excess of
but accounting profits declining.
International Monetary Fund | October 2023
7
WORLD ECONOMIC OUTLOOK: Navigating Global Divergences
Figure 1.11. Little Evidence of Wage-Price Spirals
Figure 1.12. Profits and Labor Shares: Accounting for
(Percentage point deviation from t = 0)
Inflation
(Percent, annualized)
10th-90th percentile
Median
Labor share
Profit share
Other input share
COVID-19 average, 2021:Q4 = 0
US, 1979:Q2 = 0
2010-19
8
1. Consumer Price Inflation
6
2020-21
4
2022-23:Q1
2
0
-2
2010-19
-4
2020-21
-6
-3
-2
-1
0
1
2
3
4
5
6
7
8
9
10
11
2022-23:Q1
8
2. Nominal Wage Growth
0
1
2
3
4
5
6
7
8
6
Sources: Eurostat; US Bureau of Economic Analysis; and IMF staff calculations.
4
Note: US decomposition uses data on factor shares from the nonfinancial
corporate sector only. Euro area decomposition is based on whole-economy data.
2
0
-2
with inflation above target, the Bank of Canada, the
Bank of England, the European Central Bank, and
-4
the Federal Reserve all raised rates in July. Te Bank
-6
-3
-2
-1
0
1
2
3
4
5
6
7
8
9
10
11
of Japan has continued with monetary easing but in
July decided to allow more flexibility in the conduct
8
3. Real Wage Growth
of yield curve control such that the 10-year yield
6
can now rise up to 1 percent. Te largest exception
4
to this pattern is China, where headline inflation is
2
subdued and below the authorities’ target and the
People’s Bank of China reduced interest rates in
0
June and August.
-2
-4
Tighter Monetary Policy, Tighter Credit
-6
-3
-2
-1
0
1
2
3
4
5
6
7
8
9
10
11
Acute stress in the banking sector has receded.
Sources: International Labour Organization; Organisation for Economic Cooperation
Te March 2023 banking scare remained contained
and Development; US Bureau of Economic Analysis; and IMF staff calculations.
and limited to problematic regional banks in the
Note: In panel 1, inflation is the year-over-year percent change in the CPI. In
panels 2 and 3, nominal and real wages are defined on a per-worker basis.
United States and Credit Suisse--a Swiss globally
Growth is calculated year over year. The real wage is the nominal wage divided by
systemically important bank--on account of swift
the CPI. The figure shows developments following episodes in which at least three
reaction by authorities in both countries. However,
of the preceding four quarters have (1) accelerating prices or rising price inflation,
(2) positive nominal wage growth, (3) falling or constant real wages, and (4) a
rapid rate hikes in major advanced economies over
declining or flat unemployment rate. Twenty-three such episodes are identified
the past 18 months, a necessary response to rapidly
within a sample of 33 advanced economies. Data for the COVID-19 episode are
the average of data for economies in the sample starting in 2021:Q4. The x-axis
rising inflationary pressures, have resulted in a tight
shows quarters after episodes. See Chapter 2 of the October 2022 World
monetary policy stance—real rates above neutral
Economic Outlook for details. CPI = consumer price index.
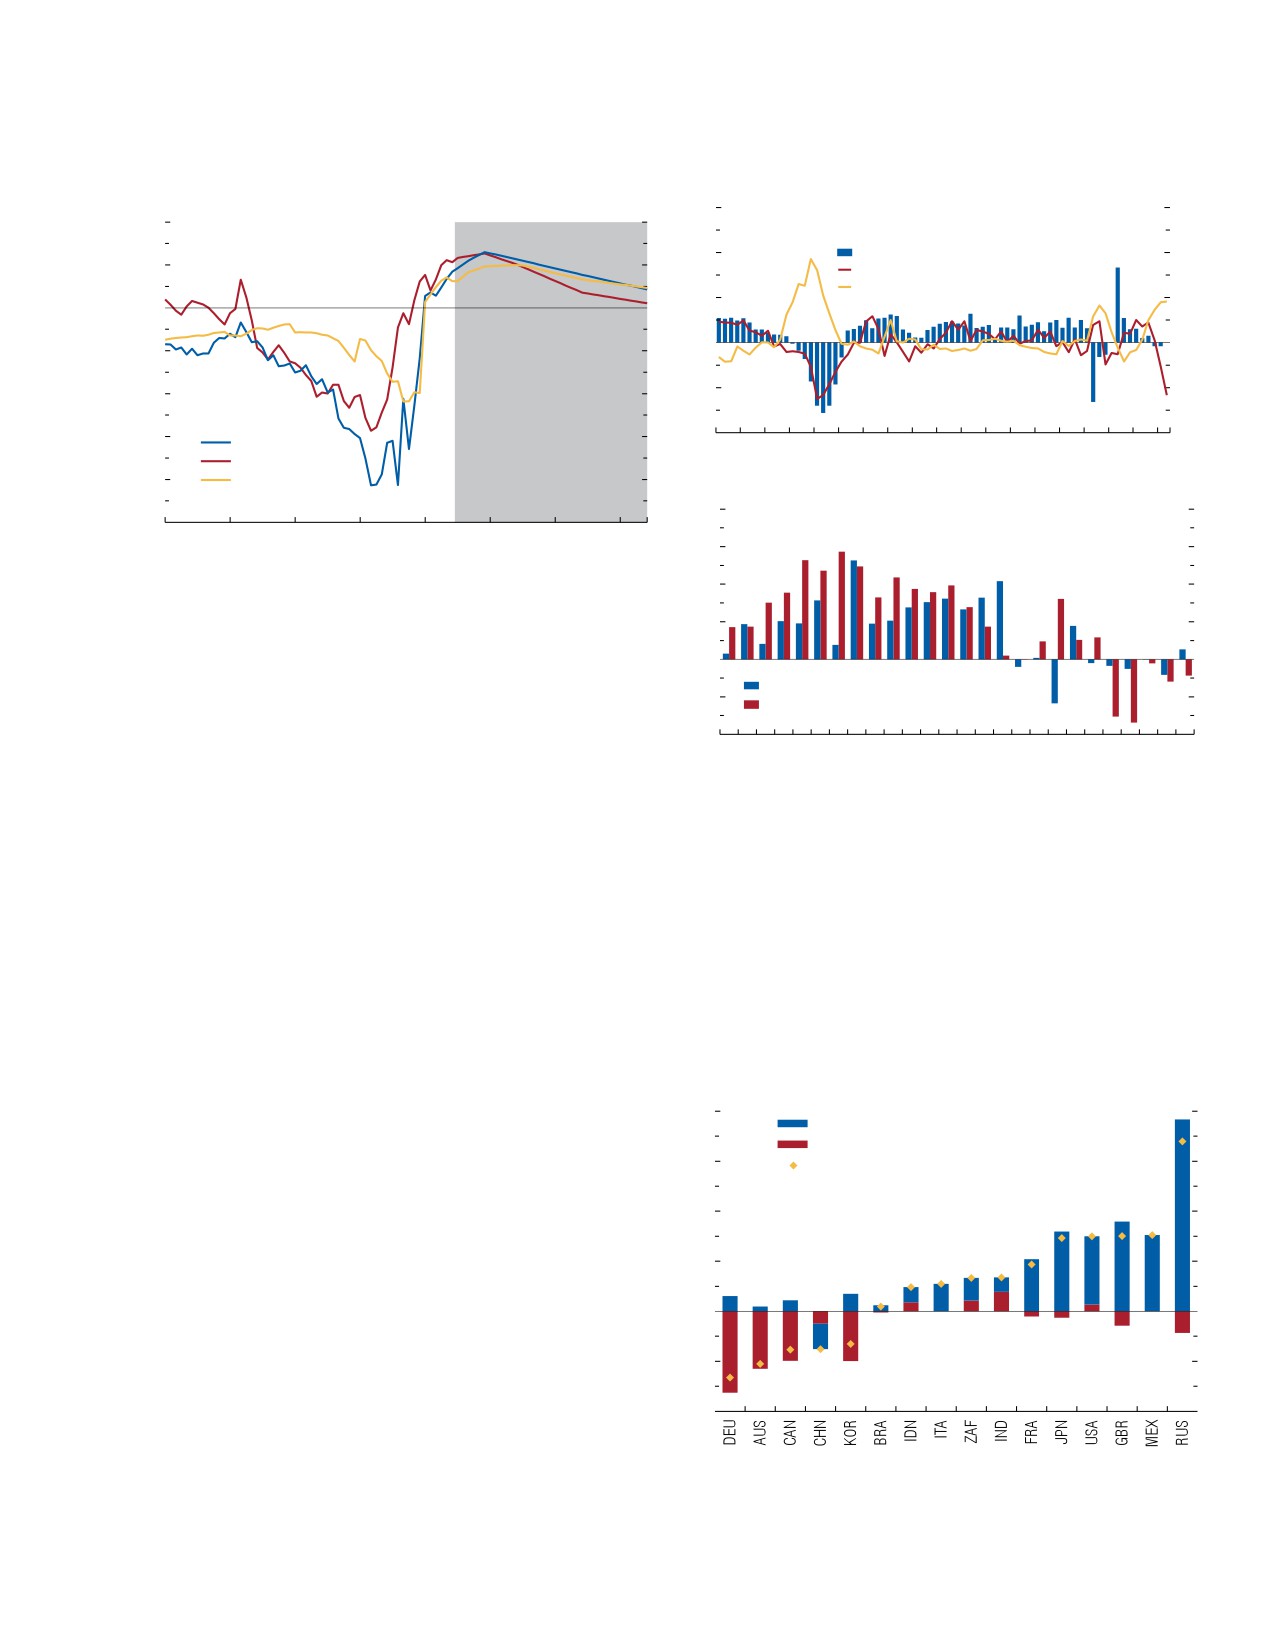
rates—that is expected to endure well into 2025
(Figure 1.13). And signs are that tighter monetary
policy has started to work its way through the finan-
cial system. Lending surveys in the United States and
Europe suggest that banks restricted access to credit
8
International Monetary Fund | October 2023
CHAPTER 1 Global Prospects and Policies
Figure 1.13. Monetary Policy to Remain Tight
Figure 1.14. Credit Channel Active in US and EA
(Percentage points)
120
1. Tighter Credit Standard, Lower Investment Demand
30
4
(Business loan index; percent change, year over year on
right scale)
80
Chg in real private fixed investment (right scale)
20
2
Business loan demand
Lending standards for business loans
40
10
0
0
0
-2
-40
-10
-4
-6
-80
-20
United Kingdom
2005
10
15
20
23:
United States
Q2
-8
Euro area
1.6
2. Contracting Credit
-10
(Percent change, month over month)
2019
20
21
22
23
24
25
26
1.2
Sources: Bloomberg Finance L.P.; Consensus Economics; Haver Analytics; Platzer
0.8
and Peruffo (2022); and IMF staff calculations.
Note: The figure shows the evolution of the monetary policy stance, defined as the
0.4
difference between real interest rates and the real natural rate of interest. The real
interest rate is defined as the difference between the policy rate (actual until June
0.0
2023 and market implied from Bloomberg after that) and one-year-ahead inflation
EA: Chg in credit to residents
expectations. For the United Kingdom and the United States, inflation expectations
-0.4
US: Chg in credit from all commercial banks
are market-based and computed from inflation swaps. For the euro area, inflation
expectations are from Consensus Economics surveys, and the real natural rate of
-0.8
interest is the weighted average of data for France and Germany.
June
Oct.
Feb.
June
Oct.
Feb.
July
2021
21
22
22
22
23
23
considerably over the past year and were expected
Sources: European Central Bank; Federal Reserve Board; Haver Analytics; and IMF
staff calculations.
to continue to do so in coming months. And there
Note: In panel 1, lending standards and loan demand are based on answers to the
are also clear signs that tighter credit conditions are
Federal Reserve Board’s Senior Loan Officer Opinion Survey on Bank Lending
Practices and its European counterpart; positive values indicate that lending
increasingly affecting real activity. In advanced econ-
standards have been tightened or credit demand has increased on balance in the
omies, credit and investment demand contracted in
preceding three months. Data for both business loan demand and lending
standards are simple averages of data from US and EA responses. Real private
the first half of the year, reflecting tighter supply as
fixed investment is the purchasing-power-parity-weighted average of data for US
well as lower demand for credit, as many businesses
and EA. Chg = change; EA = euro area.
began to deleverage in response to higher interest
rates and production overcapacity (Figure 1.14).
Figure 1.15. House Prices Slowing or Reversing, 2022-23
Higher interest rates are likely to put banks under
(Cumulated percent change)
increasing pressure in major economies, both directly
(through higher cost of funding) and indirectly (as
20
Change in house prices, 2021:Q4-2022:Q3
credit quality deteriorates). Housing markets have
Change in house prices, 2022:Q3-2023:Q1
15
already been reacting, with house prices slowing or
Total change in house prices, 2021:Q4-2023:Q1
reversing since the beginning of the tightening cycle
10
in several countries (Figure 1.15), and bankruptcy
rates have increased in some economies (increasing by
5
20 percent in the United States over the last year) as
pandemic-time forbearance measures are phased out.
0
Bankruptcies remain lower than before the pandemic
in most countries but are rising rapidly.
-5
Debt markets have started to reflect tighter mon-
etary policy, whereas spreads to risk-free government
-10
debt have stayed more or less constant. Tis suggests
that although credit conditions have tightened
Sources: Bank for International Settlements; and IMF staff calculations.
significantly, there is no immediate indication of a
Note: Data labels in the figure use International Organization for Standardization
credit crunch.
(ISO) country codes.
International Monetary Fund | October 2023
9
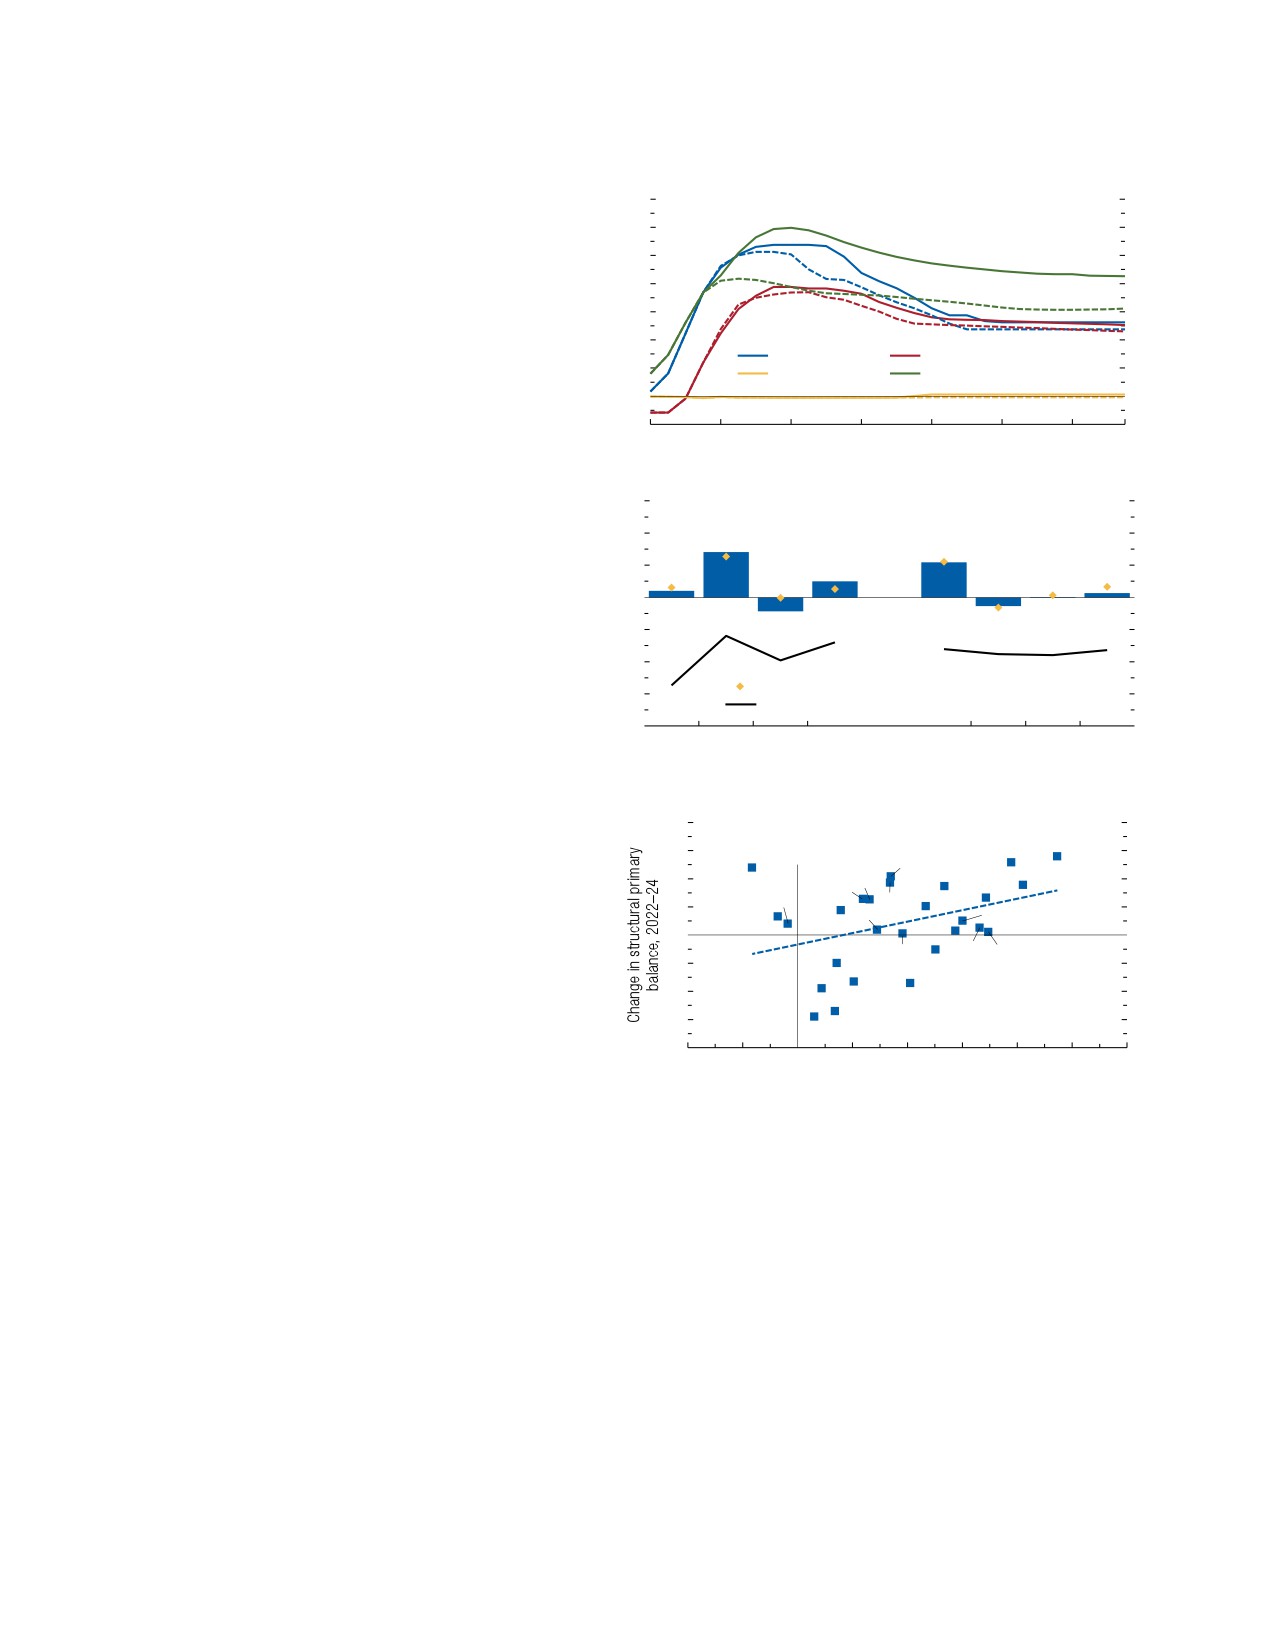
WORLD ECONOMIC OUTLOOK: Navigating Global Divergences
Outlook: Stable but Slow
Figure 1.16. Monetary and Fiscal Policy Assumptions
Te latest projections confirm that the global
7
1. Policy Rates in Selected Advanced Economies
(Percent, annualized)
economy is slowing as inflation declines from last
6
year’s multidecade peak. A contraction in global per
5
capita real GDP—which often happens in a global
4
recession—is not part of the baseline scenario. Growth
3
and employment in the first half of the year remained
2
United States
Euro area
more resilient than forecast in the April 2023 WEO.
1
Japan
United Kingdom
Although there is little change in the forecast for the
0
global average since the July 2023 WEO Update,
-1
several shifts in growth and inflation prospects are
2022:Q1
23:Q1
24:Q1
25:Q1
26:Q1
27:Q1
28:Q1
28:
Q4
observed across countries. In addition, medium-term
prospects for economic growth remain the lowest in
6
2. Change in Structural Primary Fiscal Balance, 2021-24
(Percent of potential GDP)
decades, with middle- and lower-income countries
4
facing a slower pace of convergence toward higher
2
living standards.
0
Te baseline forecasts for the global economy are
predicated on a number of assumptions (Figure 1.16),
-2
notably for fuel and nonfuel commodity prices, as well
-4
as the stances of monetary and fiscal policy:
April 2023 WEO
-6
Cyclically adjusted primary balance (percent of GDP)
••
Commodity price assumptions: Prices of fuel com-
-8
modities are projected to fall on average by 36 per-
2021
22
23
24
2021
22
23
24
Advanced economies
Emerging market and
cent and oil prices by about 17 percent, with the
developing economies
decreases reflecting mainly the slowdown in global
economic activity, and natural gas and coal prices
4
3. Government Debt versus Fiscal Adjustment
(Percentage points, unless otherwise noted)
to decline from their 2022 peaks by 61 percent
3
JPN
THA
ARG
MYS
and 51 percent, respectively. The forecast for non-
2
DEU
ESP
CAN
PHL
IND
KOR
TUR
EGY
fuel commodity prices is a decline of 6.3 percent,
1
BRA
AUS
EA
ZAF
on average, in 2023, with prices for base metals
FRA
0
IDN
CHN
GBR
expected to decrease by 4.7 percent, the decreases
–1
KAZ
USA
MEX
reflecting concerns regarding real estate investment
RUS
-2
ITA
in China. Food commodity prices, after rising by
POL
-3
NLD
14.8 percent in 2022, are predicted to decline by
-4
6.8 percent in 2023, with prices remaining well
-10
-5
0
5
10
15
20
25
30
Change in government debt, 2019-22 (percent of GDP)
above their 2021 levels. Compared with forecasts
in the July 2023 WEO Update, an upward revision
Source: IMF staff calculations.
to wheat prices following the suspension of the
Note: In panel 1, solid lines denote assumptions for the October 2023 WEO and
dashed lines for the April 2023 WEO. In panel 2, the cyclically adjusted
Black Sea Grain Initiative (which occurred after
primary balance is the general government balance (excluding interest income
the July 2023 WEO Update forecasting round) is
or expenses) adjusted for the economic cycle. The structural primary fiscal
balance is the cyclically adjusted primary balance corrected for a broader range
broadly offset by downward revisions to other food
of noncyclical factors, such as changes in asset and commodity prices. Data
commodity prices.
labels in the figure use International Organization for Standardization (ISO)
country codes. EA = euro area; WEO = World Economic Outlook.
••
Monetary policy assumptions: Global interest
rate assumptions are on average revised upward
compared with those in the April 2023 WEO,
European Central Bank to raise its to peak at
reflecting actual and signaled policy tightening
3.9 percent in 2023, before all three reduce rates
by major central banks. The Federal Reserve’s
in 2024. The higher policy path over the longer
policy rate is expected to peak at its current level
term has contributed to the rise in long-term
of about 5.4 percent, the Bank of England to
policy rate assumptions. For Japan, policy rates
raise its to peak at about 6.0 percent, and the
for the medium term (2026-28) are revised
10
International Monetary Fund | October 2023
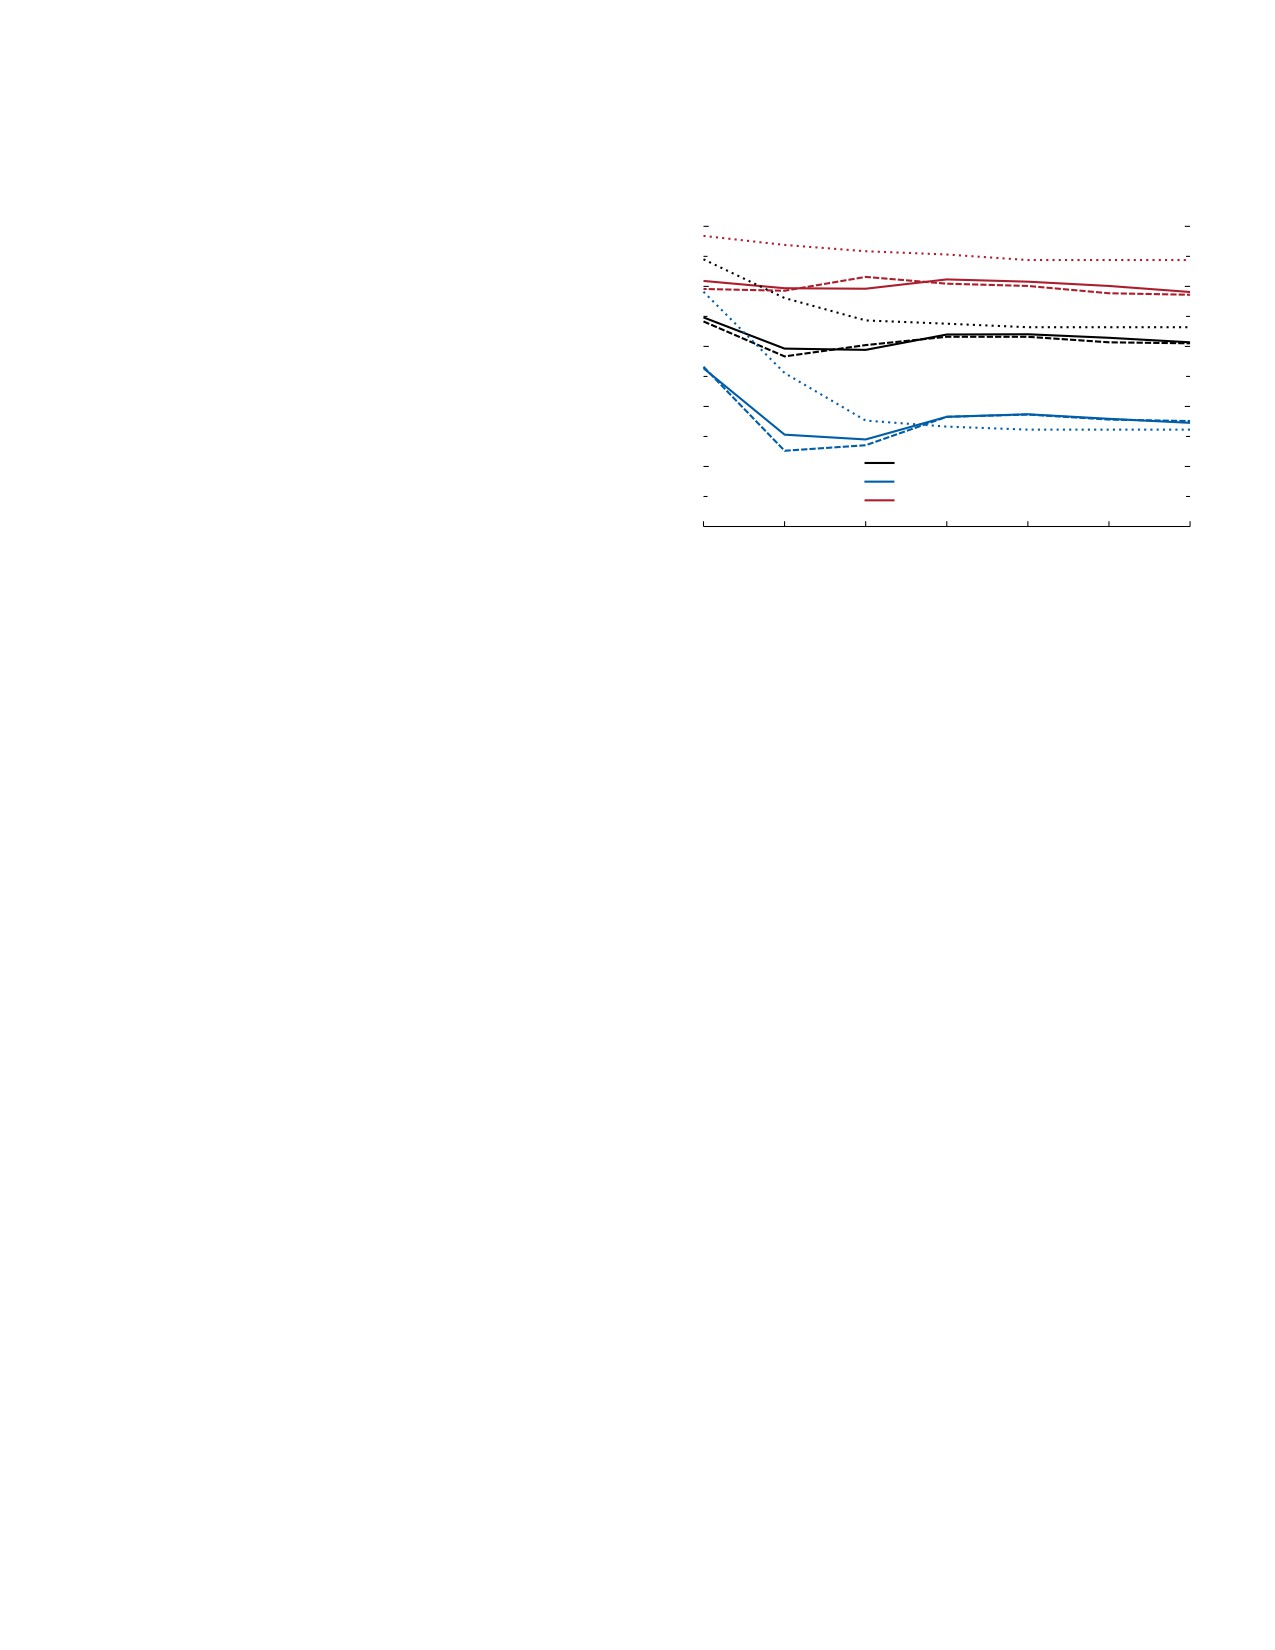
CHAPTER 1 Global Prospects and Policies
upward, reflecting changes to the country’s
Figure 1.17. Growth Outlook: Stable and Slow
yield-curve-control framework, and long-term
(Percent; dashes = April 2023; dots = January 2022)
rates are revised upward accordingly. As near-term
5
inflation expectations decline, real interest rates are
likely to stay elevated even after nominal rates start
4
to fall. In addition, changes in monetary policy
are becoming less synchronous, with some central
banks that tightened policy earlier (such as the
3
Central Bank of Brazil) initiating their easing cycle.
••
Fiscal policy assumptions: Governments in advanced
2
economies are on average expected to ease fiscal
policy in 2023, following a rise in fiscal balances in
World
1
2022, whereas in emerging market and developing
Advanced economies
Emerging market and developing economies
economies, the projected fiscal stance is on average
0
neutral. Fiscal consolidation is expected in 2024 in
2022
23
24
25
26
27
28
both groups of economies. Fiscal tightening is on
Source: IMF staff calculations.
average expected to be greater in economies that
Note: Solid lines denote GDP growth from the October 2023 WEO, and dashed
recently experienced a sharper rise in government
lines and dotted lines denote GDP growth forecasts from the April 2023 WEO and
the January 2022 WEO Update, respectively. WEO = World Economic Outlook.
debt (Figure 1.16, panel 3). A rise in government
debt amounting to 10 percentage points of GDP
during 2019-22 is associated on average with
fiscal consolidation (rise in the structural primary
global growth bottomed out in the fourth quarter
balance) of 0.8 percentage point of GDP during
of 2022. However, in some major economies, it is
2022-24. Exceptions to this pattern include, for
not expected to have bottomed out until the second
example, Argentina, where despite a decline, debt
half of 2023.
levels remain high, and the fiscal stance is expected
Advanced economies continue to drive the decline
to continue tightening to secure fiscal and debt
in annual average growth from 2022 to 2023, with
sustainability.
stronger services activity offset by weaker manufactur-
ing, as well as idiosyncratic factors. On average, these
economies are expected to have broadly stable growth
Growth Outlook: Offsetting Divergences
in 2024 with a pickup in 2025. By contrast, emerging
Global growth is projected to fall from 3.5 percent
market and developing economies, on average, are
in 2022 to 3.0 percent in 2023 and 2.9 percent in
projected to see stable growth over 2022-24, with
2024 on an annual average basis (Table 1.1). Tere
a slight pickup in 2025, although with sizable shifts
is a downward revision of 0.1 percentage point for
across regions.
2024 compared with the July 2023 WEO Update
projection. At the same time, there are more sizable
Growth Forecast for Advanced Economies
changes in the underlying growth trajectories of major
economies, with stronger projections for the United
For advanced economies, the growth slowdown
States and downward revisions for China and the euro
projected is significant—from 2.6 percent in 2022 to
area. Te forecasts for growth during 2023-24 are
1.5 percent in 2023 and 1.4 percent in 2024—with
also slower than those before the onset of the shocks
no overall revision from the July 2023 WEO Update,
of 2020-22 (Figure 1.17): the January 2022 WEO
amid stronger-than-expected US momentum and
Update projected global growth at 3.8 percent in 2023
weaker-than-expected growth in the euro area. About
and 3.4 percent in 2024. Te 2023-24 forecasts are
90 percent of advanced economies are projected to
also below the historical (2000-19) annual average of
see lower growth in 2023. With the projected slow-
3.8 percent. Growth is below the historical average
down in advanced economies, annual unemployment
across broad income groups, both in overall GDP as
is projected to rise by an average of 0.1 percentage
well as in per capita GDP. On a year-over-year basis,
point over 2022-24, although with more pronounced
International Monetary Fund | October 2023
11
WORLD ECONOMIC OUTLOOK: Navigating Global Divergences
Table 1.1. Overview of the World Economic Outlook Projections
(Percent change, unless noted otherwise)
Difference from July
Difference from April
Projections
2023 WEO Update1
2023 WEO1
2022
2023
2024
2023
2024
2023
2024
World Output
3.5
3.0
2.9
0.0
-0.1
0.2
-0.1
Advanced Economies
2.6
1.5
1.4
0.0
0.0
0.2
0.0
United States
2.1
2.1
1.5
0.3
0.5
0.5
0.4
Euro Area
3.3
0.7
1.2
-0.2
-0.3
-0.1
-0.2
Germany
1.8
-0.5
0.9
-0.2
-0.4
-0.4
-0.2
France
2.5
1.0
1.3
0.2
0.0
0.3
0.0
Italy2
3.7
0.7
0.7
-0.4
-0.2
0.0
-0.1
Spain
5.8
2.5
1.7
0.0
-0.3
1.0
-0.3
Japan
1.0
2.0
1.0
0.6
0.0
0.7
0.0
United Kingdom2
4.1
0.5
0.6
0.1
-0.4
0.8
-0.4
Canada
3.4
1.3
1.6
-0.4
0.2
-0.2
0.1
Other Advanced Economies3
2.6
1.8
2.2
-0.2
-0.1
0.0
0.0
Emerging Market and Developing Economies
4.1
4.0
4.0
0.0
-0.1
0.1
-0.2
Emerging and Developing Asia
4.5
5.2
4.8
-0.1
-0.2
-0.1
-0.3
China
3.0
5.0
4.2
-0.2
-0.3
-0.2
-0.3
India4
7.2
6.3
6.3
0.2
0.0
0.4
0.0
Emerging and Developing Europe
0.8
2.4
2.2
0.6
0.0
1.2
-0.3
Russia
-2.1
2.2
1.1
0.7
-0.2
1.5
-0.2
Latin America and the Caribbean
4.1
2.3
2.3
0.4
0.1
0.7
0.1
Brazil
2.9
3.1
1.5
1.0
0.3
2.2
0.0
Mexico
3.9
3.2
2.1
0.6
0.6
1.4
0.5
Middle East and Central Asia
5.6
2.0
3.4
-0.5
0.2
-0.9
-0.1
Saudi Arabia
8.7
0.8
4.0
-1.1
1.2
-2.3
0.9
Sub-Saharan Africa
4.0
3.3
4.0
-0.2
-0.1
-0.3
-0.2
Nigeria
3.3
2.9
3.1
-0.3
0.1
-0.3
0.1
South Africa
1.9
0.9
1.8
0.6
0.1
0.8
0.0
Memorandum
World Growth Based on Market Exchange Rates
3.0
2.5
2.4
0.0
0.0
0.1
0.0
European Union
3.6
0.7
1.5
-0.3
-0.2
0.0
-0.1
ASEAN-55
5.5
4.2
4.5
-0.4
0.0
-0.3
-0.1
Middle East and North Africa
5.6
2.0
3.4
-0.6
0.3
-1.1
0.0
Emerging Market and Middle-Income Economies
4.0
4.0
3.9
0.1
0.0
0.1
-0.1
Low-Income Developing Countries
5.2
4.0
5.1
-0.5
-0.1
-0.7
-0.3
World Trade Volume (goods and services)
5.1
0.9
3.5
-1.1
-0.2
-1.5
0.0
Imports
Advanced Economies
6.7
0.1
3.0
-1.8
-0.1
-1.7
0.3
Emerging Market and Developing Economies
3.2
1.7
4.4
-0.2
-0.5
-1.6
-0.7
Exports
Advanced Economies
5.3
1.8
3.1
-1.0
-0.1
-1.2
0.0
Emerging Market and Developing Economies
4.1
-0.1
4.2
-1.3
0.1
-1.7
-0.1
Commodity Prices (US dollars)
Oil6
39.2
-16.5
-0.7
4.2
5.5
7.6
5.1
Nonfuel (average based on world commodity import
weights)
7.9
-6.3
-2.7
-1.5
-1.3
-3.5
-1.7
World Consumer Prices7
8.7
6.9
5.8
0.1
0.6
-0.1
0.9
Advanced Economies8
7.3
4.6
3.0
-0.1
0.2
-0.1
0.4
Emerging Market and Developing Economies7
9.8
8.5
7.8
0.2
1.0
-0.1
1.3
Source: IMF staff estimates.
Note: Real effective exchange rates are assumed to remain constant at the levels prevailing during July 25, 2023-August 22, 2023. Economies are listed on
the basis of economic size. The aggregated quarterly data are seasonally adjusted. WEO = World Economic Outlook.
1Difference based on rounded figures for the current, July 2023 WEO Update, and April 2023 WEO forecasts.
2See the country-specific notes for Italy and the United Kingdom in the “Country Notes” section of the Statistical Appendix.
3Excludes the Group of Seven (Canada, France, Germany, Italy, Japan, United Kingdom, United States) and euro area countries.
4For India, data and forecasts are presented on a fiscal year basis, and GDP from 2011 onward is based on GDP at market prices with fiscal year 2011/12 as
a base year.
5Indonesia, Malaysia, the Philippines, Singapore, and Thailand.
12
International Monetary Fund | October 2023
CHAPTER 1 Global Prospects and Policies
Table 1.1. Overview of the World Economic Outlook Projections (continued)
(Percent change, unless noted otherwise)
Q4 over Q49
Difference from July
Difference from April
Projections
2023 WEO Update1
2023 WEO1
2022
2023
2024
2023
2024
2023
2024
World Output
2.2
2.9
3.2
0.0
0.3
0.0
0.1
Advanced Economies
1.2
1.5
1.5
0.1
0.1
0.4
-0.1
United States
0.9
1.9
1.4
0.5
0.3
0.9
0.1
Euro Area
1.7
0.7
1.4
-0.5
-0.1
0.0
-0.4
Germany
0.8
-0.2
1.7
-0.7
0.2
-0.4
-0.1
France
0.7
1.0
1.5
0.1
-0.1
0.2
0.1
Italy2
1.5
0.3
1.2
-0.6
0.1
-0.1
0.1
Spain
3.8
1.6
2.0
-0.2
-0.2
0.3
-0.1
Japan
0.5
2.1
1.0
0.6
0.0
0.8
0.0
United Kingdom2
0.6
0.6
0.8
0.1
-0.5
1.0
-1.2
Canada
2.1
1.2
2.1
-0.4
0.3
-0.2
0.3
Other Advanced Economies3
0.9
2.0
2.2
0.2
0.1
0.1
0.4
Emerging Market and Developing Economies
3.2
4.0
4.7
-0.1
0.6
-0.5
0.3
Emerging and Developing Asia
4.2
5.0
5.5
-0.3
0.6
-0.8
0.2
China
3.2
4.9
4.7
-0.9
0.6
-0.9
0.0
India4
6.1
5.5
7.7
1.2
1.3
-0.7
1.3
Emerging and Developing Europe
-1.2
2.8
2.5
0.1
0.5
0.4
0.0
Russia
-3.1
2.2
1.2
0.3
0.4
1.3
-0.2
Latin America and the Caribbean
2.8
1.5
3.2
0.7
0.3
0.3
1.1
Brazil
2.5
2.1
2.8
0.8
0.6
1.2
0.8
Mexico
4.3
2.6
1.9
0.7
0.2
1.4
0.0
Middle East and Central Asia
Saudi Arabia
5.5
0.9
4.0
-1.1
1.1
-2.2
0.8
Sub-Saharan Africa
Nigeria
3.2
2.6
3.6
0.0
0.0
-0.4
-0.1
South Africa
1.3
1.6
2.0
0.7
0.0
0.5
0.3
Memorandum
World Growth Based on Market Exchange Rates
1.8
2.5
2.6
0.0
0.2
0.1
0.0
European Union
1.8
1.0
1.6
-0.5
-0.1
0.0
-0.3
ASEAN-55
4.7
4.2
4.6
-0.4
-0.2
-0.1
-0.7
Middle East and North Africa
Emerging Market and Middle-Income Economies
3.1
4.0
4.6
-0.1
0.5
-0.5
0.3
Low-Income Developing Countries
Commodity Prices (US dollars)
Oil6
8.8
-2.5
-5.7
10.5
-0.8
14.8
-2.3
Nonfuel (average based on world commodity import
weights)
-0.4
-3.1
0.7
-3.1
-0.1
-6.6
1.2
World Consumer Prices7
9.2
5.9
4.8
0.4
0.9
0.3
1.1
Advanced Economies8
7.7
3.3
2.6
0.0
0.1
0.1
0.4
Emerging Market and Developing Economies7
10.5
8.1
6.6
0.7
1.5
0.5
1.6
6Simple average of prices of UK Brent, Dubai Fateh, and West Texas Intermediate crude oil. The average price of oil in US dollars a barrel was $96.36 in
2022; the assumed price, based on futures markets, is $80.49 in 2023 and $79.92 in 2024.
7Excludes Venezuela. See the country-specific note for Venezuela in the “Country Notes” section of the Statistical Appendix.
8The inflation rates for 2023 and 2024, respectively, are as follows: 5.6 percent and 3.3 percent for the euro area, 3.2 percent and 2.9 percent for Japan, and
4.1 percent and 2.8 percent for the United States.
9For world output, the quarterly estimates and projections account for approximately 90 percent of annual world output at purchasing-power-parity weights.
For emerging market and developing economies, the quarterly estimates and projections account for approximately 85 percent of annual emerging market and
developing economies’ output at purchasing-power-parity weights.
International Monetary Fund | October 2023
13
WORLD ECONOMIC OUTLOOK: Navigating Global Divergences
Table 1.2. Overview of the World Economic Outlook Projections at Market Exchange Rate Weights
(Percent change)
Difference from July
Difference from April
Projections
2023 WEO Update1
2023 WEO1
2022
2023
2024
2023
2024
2023
2024
World Output
3.0
2.5
2.4
0.0
0.0
0.1
0.0
Advanced Economies
2.6
1.5
1.4
0.0
0.1
0.3
0.1
Emerging Market and Developing Economies
3.7
4.0
3.8
0.0
-0.1
0.0
-0.2
Emerging and Developing Asia
3.9
5.1
4.6
-0.1
-0.2
-0.1
-0.2
Emerging and Developing Europe
0.4
2.2
2.1
0.6
-0.1
1.2
-0.2
Latin America and the Caribbean
3.9
2.2
2.2
0.4
0.2
0.7
0.1
Middle East and Central Asia
5.8
1.9
3.4
-0.5
0.2
-1.1
-0.1
Sub-Saharan Africa
3.9
3.2
3.9
-0.1
0.0
-0.2
-0.1
Memorandum
European Union
3.4
0.6
1.3
-0.3
-0.3
-0.1
-0.2
Middle East and North Africa
6.0
1.8
3.4
-0.6
0.3
-1.3
0.1
Emerging Market and Middle-Income Economies
3.6
4.0
3.7
0.0
-0.2
0.1
-0.2
Low-Income Developing Countries
5.1
4.0
5.1
-0.5
-0.1
-0.7
-0.3
Source: IMF staff estimates.
Note: The aggregate growth rates are calculated as a weighted average, in which a moving average of nominal GDP in US dollars for the preceding three years
is used as the weight. WEO = World Economic Outlook.
1Difference based on rounded figures for the current, July 2023 WEO Update, and April 2023 WEO forecasts.
increases in Canada (1.0 percentage point), the
rising to 1.2 percent in 2024. The forecast is revised
United Kingdom (0.9 percentage point), and the
downward by 0.2 percentage point and 0.3 per-
United States (0.2 percentage point). Neverthe-
centage point for 2023 and 2024, respectively,
less, the forecast for unemployment in 2024 is on
compared with July 2023 WEO Update projections.
average 0.4 percentage point lower than that in the
There is also a divergence in growth across major
April 2023 WEO, reflecting still-tight labor markets
euro area economies in 2023. For Germany, where
in a number of cases.
a slight economic contraction is now projected in
••
In the United States, growth is projected at 2.1 per-
the second half of 2023, amid weakness in inter-
cent in 2023 and 1.5 percent in 2024. The forecast
est-rate-sensitive sectors and slower trading-partner
is revised upward by 0.3 percentage point for 2023
demand, there is a downward revision of 0.2 per-
and by 0.5 percentage point for 2024, compared
centage point to growth of -0.5 percent. For France,
with July 2023 WEO Update projections, owing to
where there was catch-up in industrial production
stronger business investment in the second quarter
and external demand outperformed in the first half
and resilient consumption growth, a reflection of
of 2023, there is an upward 0.2 percentage point
a still-tight labor market. In addition, as already
revision to growth of 1.0 percent.
mentioned, the general government fiscal stance
••
Among other major advanced economies, there
is expected to be expansionary in 2023. However,
is also some divergence in growth. Growth in
with wage growth slowing, savings accumulated
the United Kingdom is projected to decline from
during the pandemic running out, and the Federal
4.1 percent in 2022 to 0.5 percent in 2023, with
Reserve maintaining tight monetary policy, growth
a 0.1 percentage point upward revision. The
is expected to slow in the second half of 2023 and
decline in growth reflects tighter monetary policies
in 2024. The unemployment rate is forecast to rise
to curb still-high inflation and lingering impacts
from 3.6 percent in the second quarter of 2023 to a
of the terms-of-trade shock from high energy
peak of 4.0 percent by the last quarter of 2024--a
prices. In Japan, growth is projected to rise from
lower peak than previously projected (5.2 percent in
1.0 percent in 2022 to 2.0 percent in 2023, with
the April 2023 WEO and 5.6 percent at the time of
a 0.6 percentage point upward revision, buoyed by
the October 2022 WEO), consistent with a softer
pent-up demand, a surge in inbound tourism, and
landing than earlier expected for the US economy.
accommodative policies, as well as by a rebound
••
Growth in the euro area is projected to fall from
in auto exports that had earlier been held back by
3.3 percent in 2022 to 0.7 percent in 2023, before
supply chain issues.
14
International Monetary Fund | October 2023
CHAPTER 1 Global Prospects and Policies
Growth Forecast for Emerging Market and
0.4 percentage point and 0.1 percentage point upward
Developing Economies
revisions for 2023 and 2024, respectively, since July.
The decline for 2023 reflects a normalization of
For emerging market and developing economies,
growth along with the effect of tighter policies, a
growth is projected to decline relatively modestly, from
weaker external environment, and lower commodity
4.1 percent in 2022 to 4.0 percent in both 2023 and
prices. The upward revision to 2023 since July reflects
2024, with a downward revision of 0.1 percentage
stronger-than-expected growth in Brazil, revised
point for 2024 compared with the July 2023 WEO
upward by 1.0 percentage point to 3.1 percent, driven
Update projection. However, this average path hides
by buoyant agriculture and resilient services in the
regional divergences, with growth in two of the five
first half of 2023. Consumption has also remained
main geographic regions rising in 2023 and then
strong, supported by fiscal stimulus. The upward revi-
falling in 2024.
sion for the region also reflects stronger-than-expected
••
Growth in emerging and developing Asia is projected
growth in Mexico, revised upward by 0.6 percentage
to rise from 4.5 percent in 2022 to 5.2 percent in
point to 3.2 percent, with the delayed postpandemic
2023, then to decline to 4.8 percent in 2024, with
recovery taking hold in construction and services and
downward revisions of 0.1 percentage point and
spillovers from resilient US demand.
0.2 percentage point for 2023 and 2024, respectively,
••
Growth in the Middle East and Central Asia is
compared with July projections. The revision reflects
projected to decline from 5.6 percent in 2022 to
a lower forecast for China, which is revised downward
2.0 percent in 2023, before picking up to 3.4 per-
by 0.2 percentage point for 2023 and by 0.3 percent-
cent in 2024, with a 0.5 percentage point downward
age point for 2024 to growth of 5.0 percent in 2023
revision for 2023 and a 0.2 percentage point upward
and 4.2 percent in 2024. With the property market
revision for 2024. The change for 2023 is attribut-
crisis in that country, lower investment is the main
contributor to the revision. Growth in India is pro-
able mainly to a steeper-than-expected growth slow-
jected to remain strong, at 6.3 percent in both 2023
down in Saudi Arabia, from 8.7 percent in 2022 to
and 2024, with an upward revision of 0.2 percentage
0.8 percent in 2023, with a negative revision to the
point for 2023, reflecting stronger-than-expected
latter of 1.1 percentage point. The downgrade for
consumption during April-June.
growth in Saudi Arabia in 2023 reflects announced
••
Growth in emerging and developing Europe is
production cuts, including unilateral cuts and
projected to rise to 2.4 percent in 2023, with an
those in line with an agreement through OPEC+.
upward revision of 0.6 percentage point since
Private investment, including that from “gigaproj-
July, before declining to 2.2 percent in 2024. The
ect” implementation, continues to support non-oil
forecast for Russia is for a rise from -2.1 percent
GDP growth, which remains strong and unchanged
in 2022 to 2.2 percent in 2023, with an upward
from previous projections. The downgrade for 2023
revision of 0.7 percentage point for 2023. The
also reflects cuts to the growth forecast for Sudan
rise in growth reflects a substantial fiscal stimulus,
to about -18.3 percent (a downward revision of
strong investment, and resilient consumption in
nearly 20 percentage points) reflecting the outbreak
the context of a tight labor market. The upward
of conflict, deteriorating domestic security, and the
revision for the region for 2023 also reflects an
worsening humanitarian situation. The upgrade
increase of 5.0 percentage points to the forecast
for 2024 reflects the unwinding of some of the
for Ukraine to growth of 2.0 percent; the increase
announced production cuts.
is due to stronger-than-expected domestic demand
••
In sub-Saharan Africa, growth is projected to decline
growth, with firms and households adapting to the
to 3.3 percent in 2023 before picking up to 4.0
war in that country amid sharply declining inflation
percent in 2024, with 0.2 percentage point and
and stable foreign exchange markets. It additionally
0.1 percentage point downward revisions for 2023
reflects a 1.0 percentage point upside revision to
and 2024, respectively, and with growth remaining
growth of 4.0 percent in Türkiye, on the back of
below the historical average of 4.8 percent. The
stronger-than-expected domestic demand.
projected decline reflects, in a number of cases,
••
Latin America and the Caribbean is expected to
worsening weather shocks, the global slowdown,
see growth decline from 4.1 percent in 2022 to
and domestic supply issues, including, notably, in
2.3 percent in both 2023 and 2024, although with
the electricity sector. Growth in Nigeria is projected
International Monetary Fund | October 2023
15
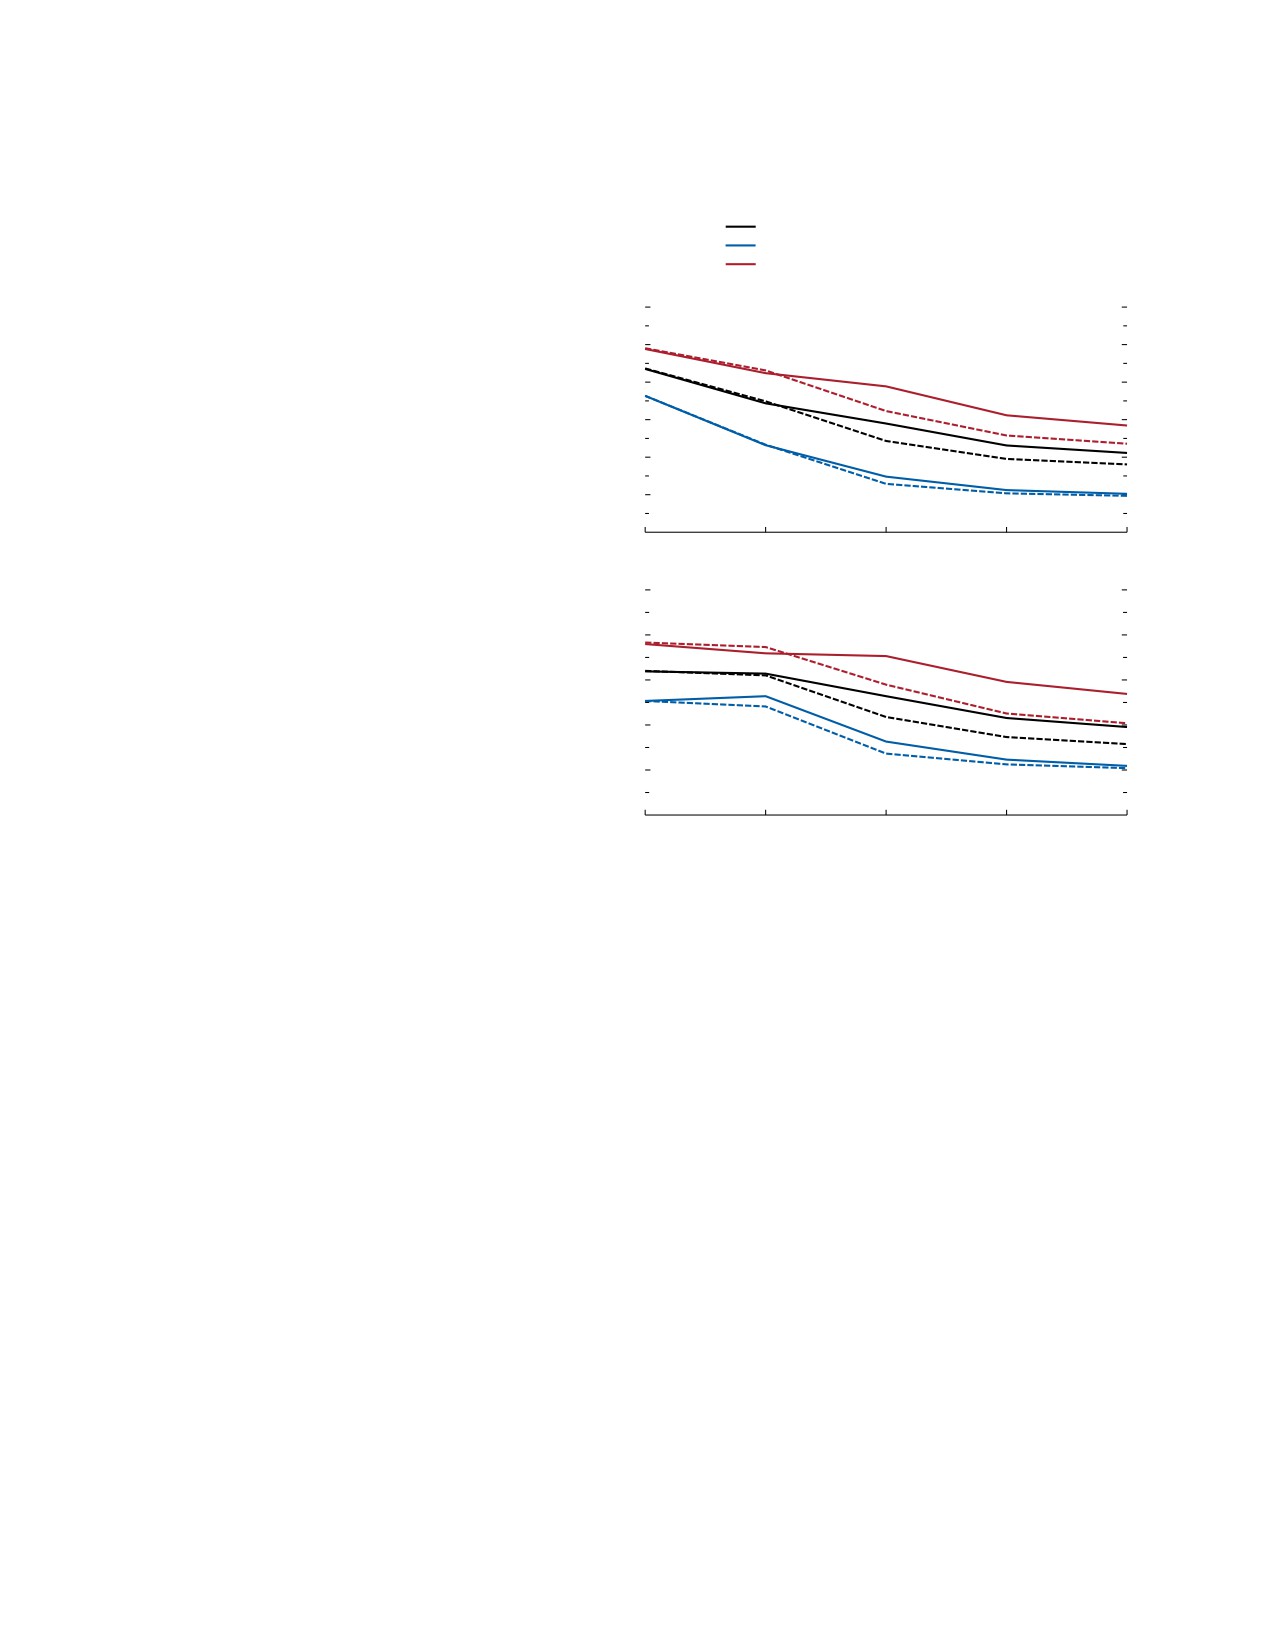
WORLD ECONOMIC OUTLOOK: Navigating Global Divergences
to decline from 3.3 percent in 2022 to 2.9 percent
Figure 1.18. Inflation Outlook: Falling
in 2023 and 3.1 percent in 2024, with negative
(Percent; dashes = April 2023)
effects of high inflation on consumption taking
World
hold. The forecast for 2023 is revised downward
Advanced economies
by 0.3 percentage point, reflecting weaker oil and
Emerging market and developing economies
gas production than expected, partially as a result
12
1. Headline Inflation
of maintenance work. In South Africa, growth is
10
expected to decline from 1.9 percent in 2022 to
0.9 percent in 2023, with the decline reflecting
8
power shortages, although with a 0.6 percentage
6
point upward revision thanks to the intensity of
power shortages in the second quarter of 2023 being
4
lower than expected.
2
0
2022
23
24
25
26
Inflation Outlook: Gradual Decline to Target
Global headline inflation is expected to steadily
10
2. Core Inflation
decline from its peak of 8.7 percent in 2022
8
(annual average) to 6.9 percent in 2023 and
5.8 percent in 2024 (Table 1.1). Te forecast for
6
2024 is revised upward by 0.6 percentage point,
reflecting higher-than-expected core inflation. On a
4
year-over-year basis, projected global headline inflation
2
peaked at 9.5 percent in the third quarter of 2022 and
is projected to reach 5.9 percent by the fourth quarter
0
2022
23
24
25
26
of 2023 before falling to 4.8 percent in the fourth
quarter of 2024, still above the prepandemic (2017-19)
Source: IMF staff calculations.
annual average of about 3.5 percent. Although mone-
Note: Solid lines denote inflation rates from the October 2023 WEO, and dashed
lines denote inflation rates from the April 2023 WEO. Core inflation excludes
tary tightening is starting to bear fruit, a central driver
volatile food and energy prices. WEO = World Economic Outlook.
of the fall in headline inflation projected for 2023 is
declining international commodity prices.
Nearly three-quarters of economies are expected
sharp fall in (year-over-year) inflation in 2023--of
to see lower headline inflation in 2023, but the pace
6.6 percentage points--from 9.9 percent in the fourth
of disinflation is especially pronounced for advanced
quarter of 2022 to 3.3 percent in the fourth quarter
economies (Figure 1.18). Tese economies are expected
of 2023, with the fall reflecting in part the decrease
to see (annual average) inflation fall by 2.7 percent-
in energy prices. In the United States, where inflation
age points in 2023, about double the (1.3 percentage
peaked earlier, the forecast is for a fall of 3.9 percent-
point) decline projected for emerging market and devel-
age points, from 7.1 percent in the fourth quarter of
oping economies. Part of this difference reflects advanced
2022 to 3.2 percent in the fourth quarter of 2023.
economies’ benefiting from stronger monetary policy
In China, where inflation declined to near zero in the
frameworks and communications, which facilitate
second quarter of 2023, a gradual rise--to still-low
disinflation (Chapter 2), but the difference also reflects
levels--is projected for the second half of 2023 as the
lower exposure to shocks to commodity prices and
drag from lower commodity prices wanes.
exchange rates. In low-income developing countries,
Core inflation is generally projected to decline more
inflation is on average projected to be in double digits
gradually than headline. Globally, it is set to decline
and is not expected to fall until 2024.
modestly, from 6.4 percent in 2022 (annual average)
Tere are also large differences in the expected pace
to 6.3 percent in 2023 and 5.3 percent in 2024. It is
of change in headline inflation across major economies,
proving more persistent than projected, with upward
as Figure 1.19 reports, reflecting different starting
revisions of 0.3 percentage point and 0.6 percent-
points. Te euro area is expected to see an especially
age point for 2023 and 2024, respectively, compared
16
International Monetary Fund | October 2023
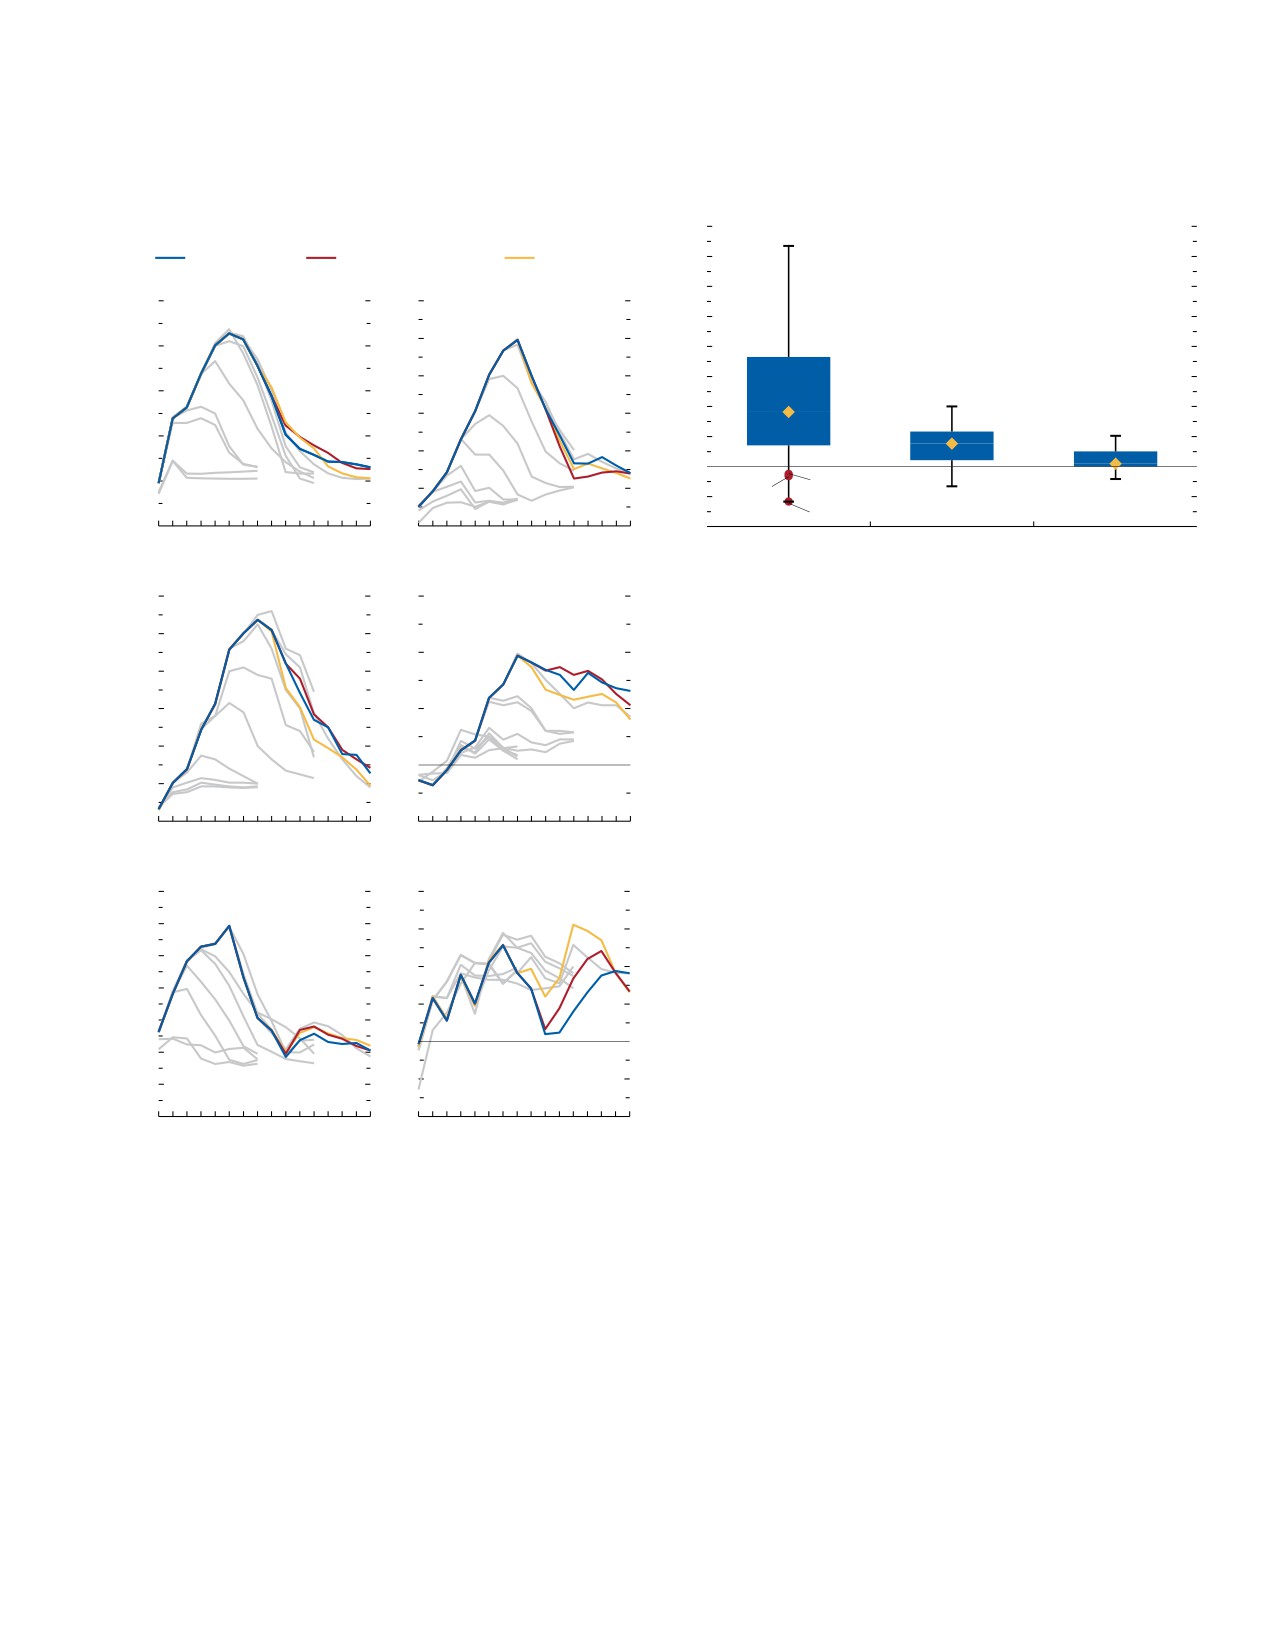
CHAPTER 1 Global Prospects and Policies
Figure 1.19. Headline Inflation Forecasts for Selected
Figure 1.20. Inflation Mostly above Target until 2025
Economies
(Percentage points; distribution of deviation from inflation target)
(Percent, year over year)
16
Oct. 2023 WEO
July 2023 WEO Update
Apr. 2023 WEO
14
12
10
1. United States
2. Euro Area
12
10
10
8
8
8
6
6
4
6
4
2
4
0
2
Thailand
2
Vietnam
-2
China
0
0
-4
2021:
22:
23:
24:
24:
21:
22:
23:
24:
24:
2023
24
25
Q1
Q1
Q1
Q1
Q4
Q1
Q1
Q1
Q1
Q4
Sources: Central bank websites; Haver Analytics; and IMF staff calculations.
12
3. United Kingdom
4. Japan
6
Note: The figure shows the distribution (box-whisker plot) by each year. The
diamonds in the middle of the boxes are the medians and the upper (lower) limits
10
of the boxes are the third (first) quartile. The whiskers show the maximum and
4
minimum within the boundary of 1.5 times the interquartile range from upper and
8
lower quartiles, respectively.
6
2
4
over half of economies are expected to see no decline in
0
2
core inflation in 2023. On a fourth-quarter-over-fourth-
quarter basis, however, about 86 percent of economies
0
-2
2021:
22:
23:
24:
24:
21:
22:
23:
24:
24:
(for which quarterly data are available) are projected to
Q1
Q1
Q1
Q1
Q4
Q1
Q1
Q1
Q1
Q4
see a decline. Overall, returning inflation to target is
14
5. Brazil
6. China
4
expected to take until at least 2025 in most cases. Com-
12
parison of official inflation targets with the latest forecasts
3
for 72 inflation-targeting economies (34 advanced
10
2
economies and 38 major emerging market and devel-
8
1
oping economies) suggests that annual average inflation
6
will exceed targets (or the midpoints of target ranges) in
0
4
93 percent of these economies in 2023 (Figure 1.20).
2
-1
Countries where inflation in 2023 is expected to average
below target include China, Tailand, and Vietnam. In
0
-2
2021:
22:
23:
24:
24:
21:
22:
23:
24:
24:
China, this projection reflects subdued core inflation in
Q1
Q1
Q1
Q1
Q4
Q1
Q1
Q1
Q1
Q4
the context of substantial economic slack, with rising
Source: IMF staff calculations.
youth unemployment and pass-through from lower
Note: Gray lines sketch past WEO forecasts from January 2021 until January 2023
energy costs. In Tailand, this prospective outcome
WEO Update. WEO = World Economic Outlook.
reflects strong pass-through from lower energy prices to
core inflation as well as lower house price inflation. In
with the July 2023 WEO Update projections. Te
Vietnam, it reflects a slowdown in economic activity and
drivers of the upside revisions differ by economy but
pass-through from lower energy prices. In 2024, inflation
reflect, in several cases, still tight labor markets and
is still expected to exceed targets (or the midpoints of tar-
stickier-than-expected services inflation, as well as, in
get ranges) in 89 percent of economies, with an expected
some cases, including Türkiye, which accounts for the
median deviation of about 1 percentage point. By 2025,
bulk of the global upside revision for 2024, the effects of
inflation is expected to be within only 0.2 percentage
past currency depreciations and the related pass-through
point of target (or the midpoints of target ranges) in
into underlying inflation. On an annual average basis,
most economies.
International Monetary Fund | October 2023
17
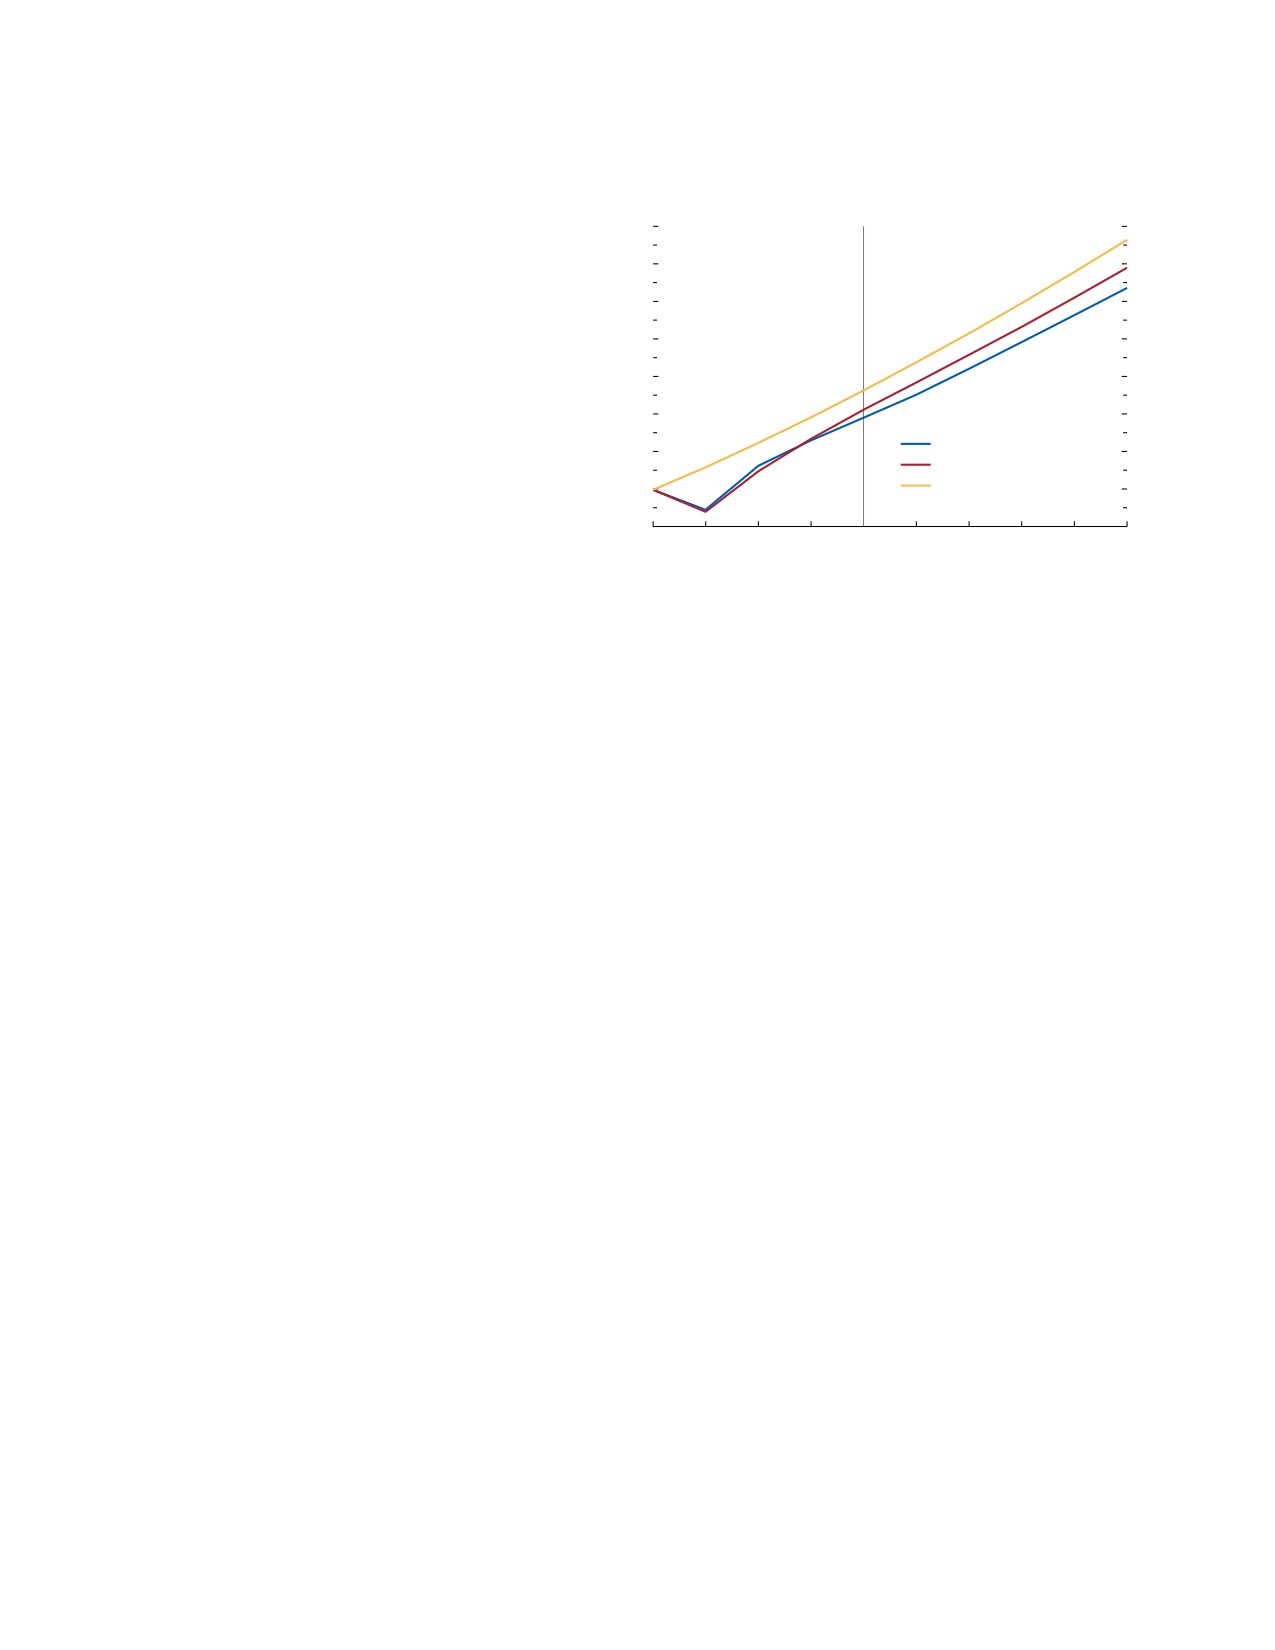
WORLD ECONOMIC OUTLOOK: Navigating Global Divergences
A Mediocre Medium Term
Figure 1.21. Forecasts of Global GDP
(Trillions of US dollars in 2023 prices)
Forecasts for the growth rate of global GDP over the
medium term are at their lowest in decades. As Box 1.1
130
explains, five-year-ahead forecasts for this rate from both
125
the WEO and Consensus Economics—which summa-
rizes the medium-term projections of leading forecasters
120
for more than 100 economies—have declined over the
115
past few decades. Te latest WEO forecast for global
110
growth in 2028 is 3.1 percent, as compared with a
medium-term growth projection of 3.6 percent just
105
before the onset of the pandemic (at the time of the
October 2023 WEO
100
January 2020 WEO Update) and 4.9 percent just before
January 2022 WEO Update
95
January 2020 WEO Update
the onset of the global financial crisis (at the time of the
April 2008 WEO). More than 80 percent of economies
90
2019
20
21
22
23
24
25
26
27
28
have seen a slowdown in their growth prospects from
15 years ago, at the time of the April 2008 WEO.
Source: IMF staff calculations.
Tree-quarters of this reduction in global growth comes
Note: For the January 2020 and January 2022 WEO Updates, calculations
assume that growth rate projections for 2025 and 2027 represent, respectively,
from weaker prospects for per capita GDP growth
the longer-term growth rate projections (for years beyond 2025 and 2027,
rather than merely slower population growth. A decom-
respectively). WEO = World Economic Outlook.
position of the drivers of weaker per capita growth pros-
pects points to slower prospective capital accumulation
per worker and slower total factor productivity growth
imply a global output loss of some 5.0 percent, with
as the largest contributors. Te slowdown in labor force
respect to prepandemic projections, or $6.4 trillion at
participation in advanced economies also contributed
2023 prices.
about a third of the overall decline in projected per
capita GDP growth, in the context of changing demo-
Trade Growth Historically Low
graphic trends because of population aging.
Prospects for income convergence across economies
World trade growth is expected to decline from
have also dimmed. At the time of the April 2008
5.1 percent in 2022 to 0.9 percent in 2023, before
WEO, poorer countries in terms of per capita income
rising to 3.5 percent in 2024, well below the 2000-19
were expected to grow significantly faster than richer
average of 4.9 percent. Te projected decline in 2023
ones. But this growth differential has declined over the
reflects not only the path of global demand, but also
subsequent 15 years. As a result, the expected number
shifts in its composition toward domestic services;
of years needed for poorer countries to close half the
lagged effects of dollar appreciation, which slows trade
gap in income per capita with richer countries has
owing to the widespread invoicing of products in
increased significantly since 15 years ago. Dimming
dollars; and rising trade barriers. In 2022, countries
global growth prospects imply fewer resources available
imposed almost 3,000 new restrictions on trade, up
to navigate a shock-prone world and attract needed
from fewer than 1,000 in 2019.
investments.
Meanwhile, global current account balances--the
Overall, based on current policies, a full recovery
sums of absolute surpluses and deficits--are expected
of global output to its prepandemic path is unlikely.
to narrow in 2023, following their significant increase
Figure 1.21 reports the latest medium-term forecast for
in 2022 (Figure 1.22). As reported in the IMF’s 2023
global GDP in trillions of dollars at 2023 prices. Even
External Sector Report, the rise in current account
before Russia’s invasion of Ukraine and the inflation
balances in 2022 reflected largely commodity price
surge of 2022, there was little prospect of returning
increases triggered by the war in Ukraine, which
to the prepandemic path (as reflected in the January
caused a widening in oil and other commodity trade
2020 forecasts), with expectations of longer-term
balances. Over the medium term, global balances are
scarring, particularly for emerging market and develop-
expected to narrow gradually as commodity prices
ing economies. Recovery to the prepandemic trend is
decline. Creditor and debtor stock positions reached
now even more elusive. Te latest projections for 2028
historically elevated levels in 2022, with the increases
18
International Monetary Fund | October 2023
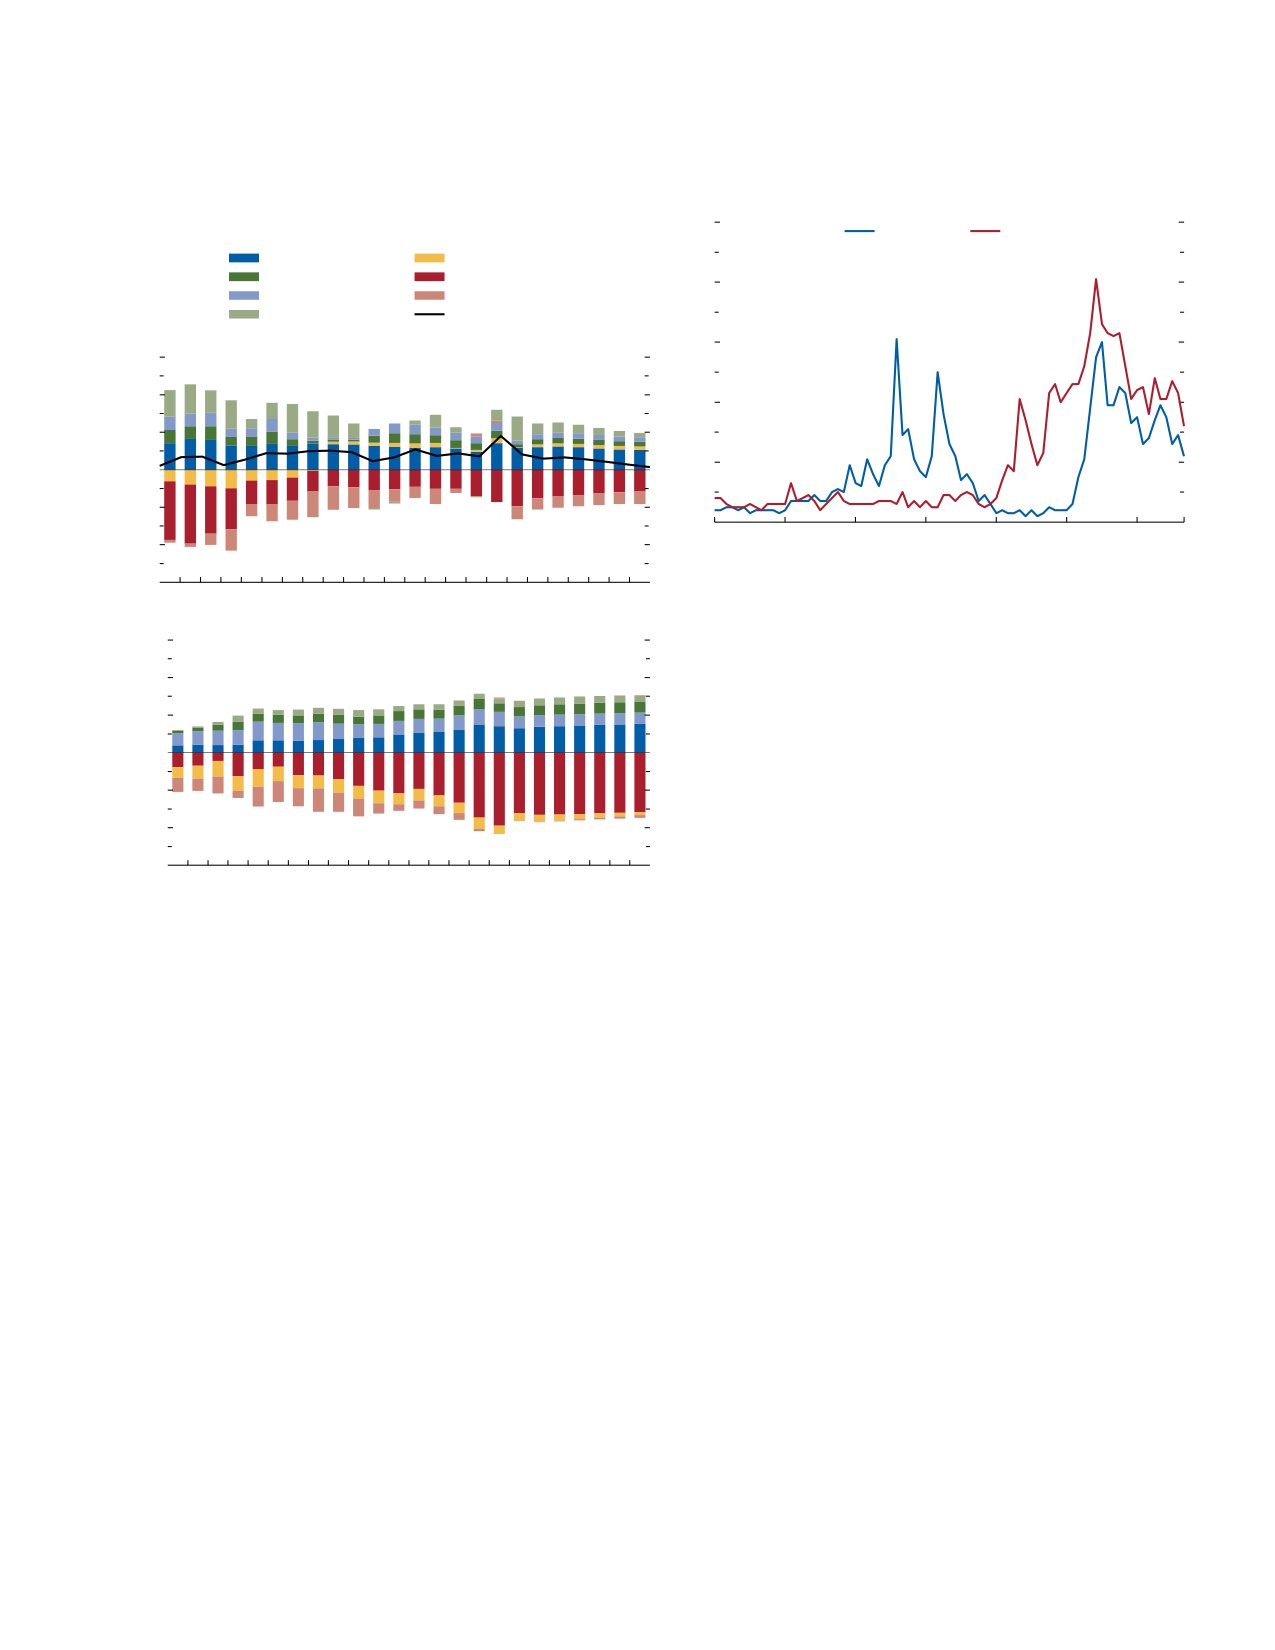
CHAPTER 1 Global Prospects and Policies
Figure 1.22. Current Account and International Investment
Figure 1.23. Recession and Inflation Concerns over Time
Positions
(Index, 100 = highest point worldwide during 2008-23)
(Percent of global GDP)
100
Recession
Inflation
European creditors
European debtors
China
United States
80
Japan
Others
Oil exporters
Discrepancy
60
3
1. Global Current Account Balance
2
40
1
20
0
-1
0
Jan.
Jan.
Jan.
Jan.
Jan.
Jan.
Jan. Sep.
-2
2017
18
19
20
21
22
23
23
-3
2005
07
09
11
13
15
17
19
21
23
25
27 28
Source: Google Trends.
Note: Figure reports Google search interest in the topics recession and inflation
30
2. Global International Investment Position
relative to the highest point (100) during 2008-23 worldwide.
20
10
year, the resolution of US debt ceiling tensions and
swift action by Swiss and US authorities to contain
0
banking sector turbulence reduced the immediate
-10
risks of broader financial stress. Nevertheless, concerns
regarding global inflation and recession remain high
-20
(Figure 1.23), reflecting the still-challenging envi-
-30
2005
07
09
11
13
15
17
19
21
23
25
27 28
ronment, and the balance of risks to global growth
remains tilted to the downside.
Source: IMF staff calculations.
Te most prominent risks and uncertainties
Note: European creditors are Austria, Belgium, Denmark, Finland, Germany,
Luxembourg, The Netherlands, Norway, Sweden, and Switzerland; European
surrounding the outlook are now discussed; a
debtors are Cyprus, Greece, Ireland, Italy, Portugal, Slovenia, and Spain; oil
model-based analysis that quantifies risks to the global
exporters are Algeria, Azerbaijan, Iran, Kazakhstan, Kuwait, Nigeria, Oman, Qatar,
outlook and plausible scenarios follows in Box 1.2.
the Russian Federation, Saudi Arabia, the United Arab Emirates, and Venezuela.
Upside Risks
reflecting mainly widening current account balances.
Tey are expected to moderate slightly over the
More favorable outcomes for global growth than
medium term as current account balances gradually
in the baseline forecast, which would strengthen the
narrow. In some economies, gross external liabilities
likelihood of a soft landing, are increasingly plausible:
remain large from a historical perspective and pose
••
Underlying inflation falls faster than expected. Factors
risks of external stress.
that could contribute to such an outcome include
stronger-than-expected pass-through from lower
energy prices or a compression of profit margins to
Risks to the Outlook: Tilted to the Downside
absorb cost increases. Declining job vacancies could
but More Balanced
also play a stronger-than-expected role in easing
Adverse risks have receded since the April 2023
labor markets, implying a downward shift in the
WEO, implying a more balanced distribution of risks
ratio of vacancies to unemployment and reducing
around the outlook for global growth. Economic
the need for further monetary tightening to curb
activity has proved more resilient than expected, and
inflation. As Box 1.2 explains, such developments
inflation is on a downward path, surprising on the
would support economic growth by restoring
downside in a number of cases. In addition, earlier this
purchasing power for households and allowing
International Monetary Fund | October 2023
19
WORLD ECONOMIC OUTLOOK: Navigating Global Divergences
central banks to bring forward an easing in their
and contagion through nonbank financial interme-
policy stances.
diaries (see Chapter 1 of the October 2023 Global
••
Domestic demand recovers faster. In numerous econo-
Financial Stability Report). Should concerns about
mies, the stock of excess savings accumulated during
financial stability in China fester, the impact could
the pandemic has not yet been drained and con-
be felt in other emerging market economies through
sumption remains below prepandemic trends, raising
exchange rate volatility and destabilizing capital
the possibility of a faster-than-expected consumption
flows. Box 1.2 provides a quantification of the prin-
recovery. The US labor market could again prove
cipal risks stemming from a deeper-than-expected
tighter than expected, supporting a more resilient
contraction in the real estate sector in the absence of
consumption path. Stronger policy support in China
swift action to restructure property developers and
than currently envisaged--through means-tested
unintended fiscal tightening in response to lower tax
transfers to households in particular--could bolster
revenues for local governments.
the recovery and generate positive global spillovers.
••
Commodity prices become more volatile amid cli-
Furthermore, as Box 1.2 explains, private investment
mate and geopolitical shocks. Intense heat waves and
could recover more strongly to prepandemic levels
droughts in the midst of record global temperatures
than currently expected in response to current policy
this year have provided a taste of a more inhospitable
initiatives. Recent breakthroughs in artificial intelli-
future blighted by global climate change. More fre-
gence and progress in green technologies could also
quent crop failures across countries are likely, causing
usher in a new period of strong productivity growth,
food price spikes and food insecurity. The ongoing
boosting investment and growth.
El Niño phenomenon, which in the past typically
has raised global food prices by more than 6 percent
in a year (European Central Bank calculations as
Downside Risks
cited in Schnabel 2023), poses further risks. The
Despite the recent favorable growth surprises,
war in Ukraine and geopolitical tensions elsewhere
numerous adverse risks to global growth
could intensify, triggering supply chain disruptions
remain plausible:
and renewed fluctuations in food, fuel, fertilizer, and
••
China’s economic growth slows further. Recent
other commodity prices. The suspension in July of
developments shift the distribution of China’s
the Black Sea Grain Initiative and recent attacks on
growth forecast risks to the downside, with negative
Ukraine’s grain facilities are concerns in this regard.
implications for trading partners. The extent of
In this context, a proliferation of export restrictions
the slowdown will depend largely on the Chinese
on agricultural products aimed at reducing domes-
government’s policy response. To be effective, that
tic prices complicates the delivery of commodities
response will have to preserve financial stability by
to global markets, with the potential to exacerbate
expediting the restructuring of struggling property
fluctuations in commodity prices. A rise in oil prices
developers, facilitating the completion of housing
driven by a reduction in oil supply could reduce
projects, and addressing the growing strain in local
global economic activity and raise inflation, with the
government finances, all of which would help restore
magnitude of the effects differing across regions.4
business and consumer confidence. Policy space has
Moreover, as Chapter 3 explains, intensifying geo-
shrunk but is not fully exhausted. Given the lack of
economic fragmentation could constrain the flow of
inflationary pressure, the People’s Bank of China has
commodities across regions, causing additional price
some room to ease. At the same time, fiscal expendi-
volatility. Commodities are particularly vulnerable to
tures can be reoriented toward spending, with higher
trade restrictions, as their production is highly con-
fiscal multipliers, keeping the overall fiscal stance
centrated as a result of natural endowments. Finally,
broadly neutral. For instance, targeted support to
shortages of energy resulting from lower investment
households can be provided while shifting away
in fossil fuel development that are not matched by
from increasingly ineffective and expensive invest-
ment in infrastructure. In the most fiscally fragile
4As reported in Box 1.3 of the October 2022 WEO, a 30 percent
rise in oil prices relative to baseline could reduce the level of global
provinces, financial stress in the real estate sector
GDP by about 0.5 percent and raise global inflation by about 1.3
could end up spilling over to the rest of the financial
percentage points, relative to baseline. Te analysis assumes mone-
sector via the sovereign-banking-corporate nexus
tary policy responds endogenously to movements in inflation.
20
International Monetary Fund | October 2023
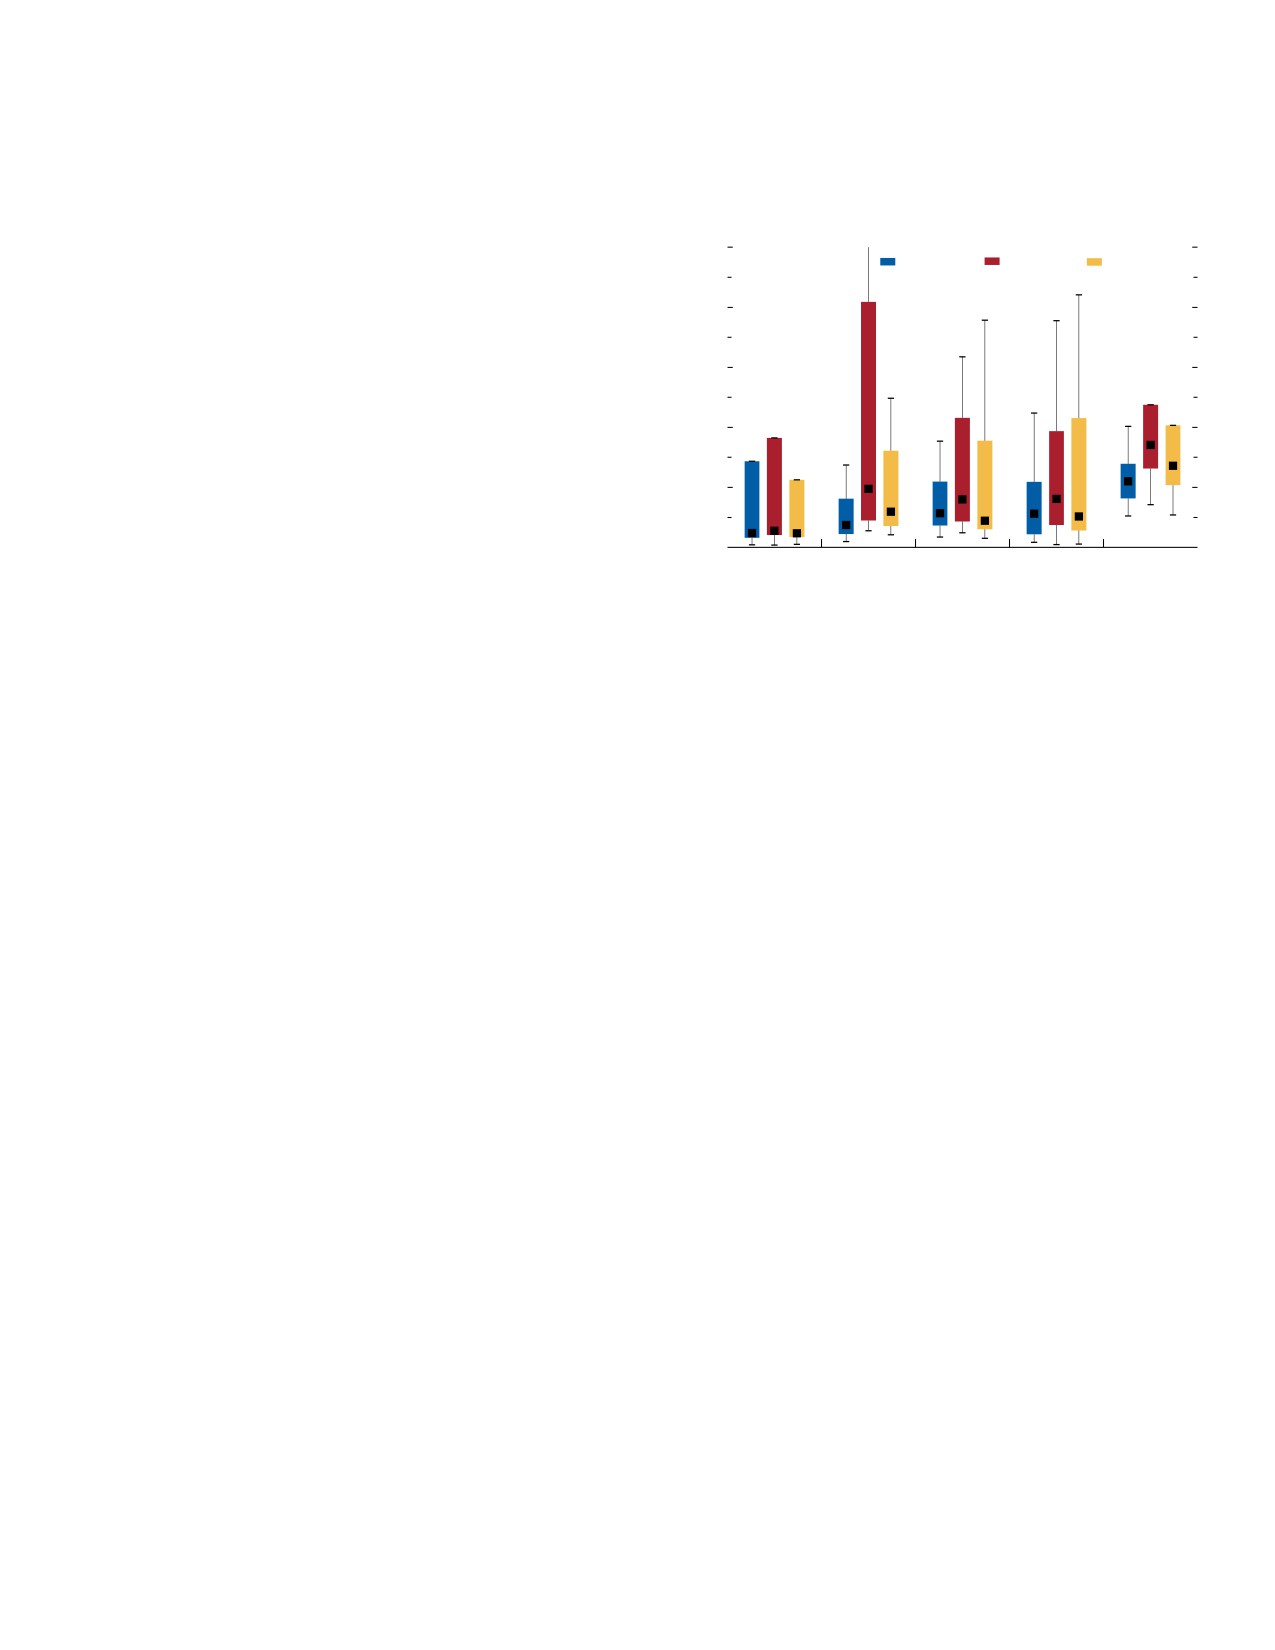
CHAPTER 1 Global Prospects and Policies
corresponding increases in alternative clean energy
Figure 1.24. Sovereign Spreads in Emerging Market and
supplies may cause more frequent energy crises. Such
Developing Economies
(Basis points, distribution by economy group)
adverse supply shocks may affect countries asymmet-
rically, with particularly acute effects on lower-income
2,500
August 2021
August 2022
August 2023
countries, where food and energy constitute a large
share of household consumption. Serious effects are
2,000
especially likely in sub-Saharan Africa, where food
averages about 40 percent of consumption.
1,500
••
Underlying inflation persists. Tight labor markets and
wage demands to compensate for past cost-of-living
increases could contribute to persistent underlying
1,000
inflationary pressures. In countries where companies’
profit margins have grown in the past two years,
500
there may be room to accommodate a rebound in
real wages without triggering further price increases.
0
With economic activity slowing, market pressures
EMDE
EMDE
LAC
ME&CA
SSA
Asia
Europe
could contain the pass-through from labor costs to
prices. However, as Chapter 2 explains, near-term
Sources: Bloomberg Finance L.P.; and IMF staff calculations.
Note: For each region, box denotes upper quartile, median, and lower quartile for
inflation expectations remain elevated and above
members, and whiskers show maximum and minimum values within boundary of
target inflation rates, which may contribute to more
1.5 times interquartile range from upper and lower quartiles. Y-axis is cut off at
persistent wage and price pressures. This would com-
2,500 basis points. EMDE = emerging market and developing economy;
LAC = Latin America and the Caribbean; ME&CA = Middle East and Central Asia;
plicate the task of monetary policy in restoring price
SSA = sub-Saharan Africa.
stability. The ample stock of excess household savings
in some economies could, where the surpluses are
still sizable, slow the effects of monetary policy tight-
the euro area, and some emerging market economies
ening on inflation. Greater-than-expected pressures
(see Chapter 1 of the October 2023 Global Finan-
on underlying inflation could then force central
cial Stability Report). Moreover, borrowing costs for
banks to—again—raise rates by more than expected.
emerging market and developing economies remain
••
Financial markets reprice. Financial markets have
high, constraining priority spending and raising the
adjusted upward their expectations in regard to mon-
risk of debt distress. The share of emerging market
etary policy tightening in recent months, but new
and developing economies with sovereign credit
upside inflation surprises would force a monetary
spreads above 1,000 basis points was 24 percent as of
policy reassessment and could trigger a sudden rise in
August: still much higher than two years ago (only
interest rate expectations and falling asset prices—as
9.3 percent). For sub-Saharan Africa, spreads still
happened in March. Movements such as these could
exceed 680 basis points in more than half of cases
further tighten financial conditions and stress banks
(Figure 1.24). The share of low-income countries
and nonbank financial institutions whose balance
(56 percent) and emerging markets (25 percent)
sheets remain vulnerable to interest rate risk, espe-
in or at high risk of debt distress this year remains
cially those highly exposed to commercial real estate.
elevated, as it was last year.
Contagion effects are possible. A flight to safety
••
Geoeconomic fragmentation intensifies, hampering
(Box 1.2), with an attendant appreciation of reserve
multilateral cooperation. The ongoing separation of
currencies, would trigger negative ripple effects for
the world economy into blocs amid Russia’s war
global trade and growth and raise inflation in emerg-
in Ukraine and other geopolitical tensions could
ing market and developing economies, especially
intensify—with more restrictions on trade (in
those highly dependent on imports of food and fuel.
particular, trade in strategic goods, such as critical
••
Debt distress increases. Global financial conditions,
minerals); cross-border movements of capital, tech-
which measure the cost of funding in capital markets,
nology, and workers; and international payments.
have generally eased since the March 2023 banking
Should this happen, the costs for global prosperity
stress episode, but lending standards have tightened
will be high. Over the long term, trade fragmenta-
and loan demand has declined in the United States,
tion alone—that is, the splintering of countries into
International Monetary Fund | October 2023
21
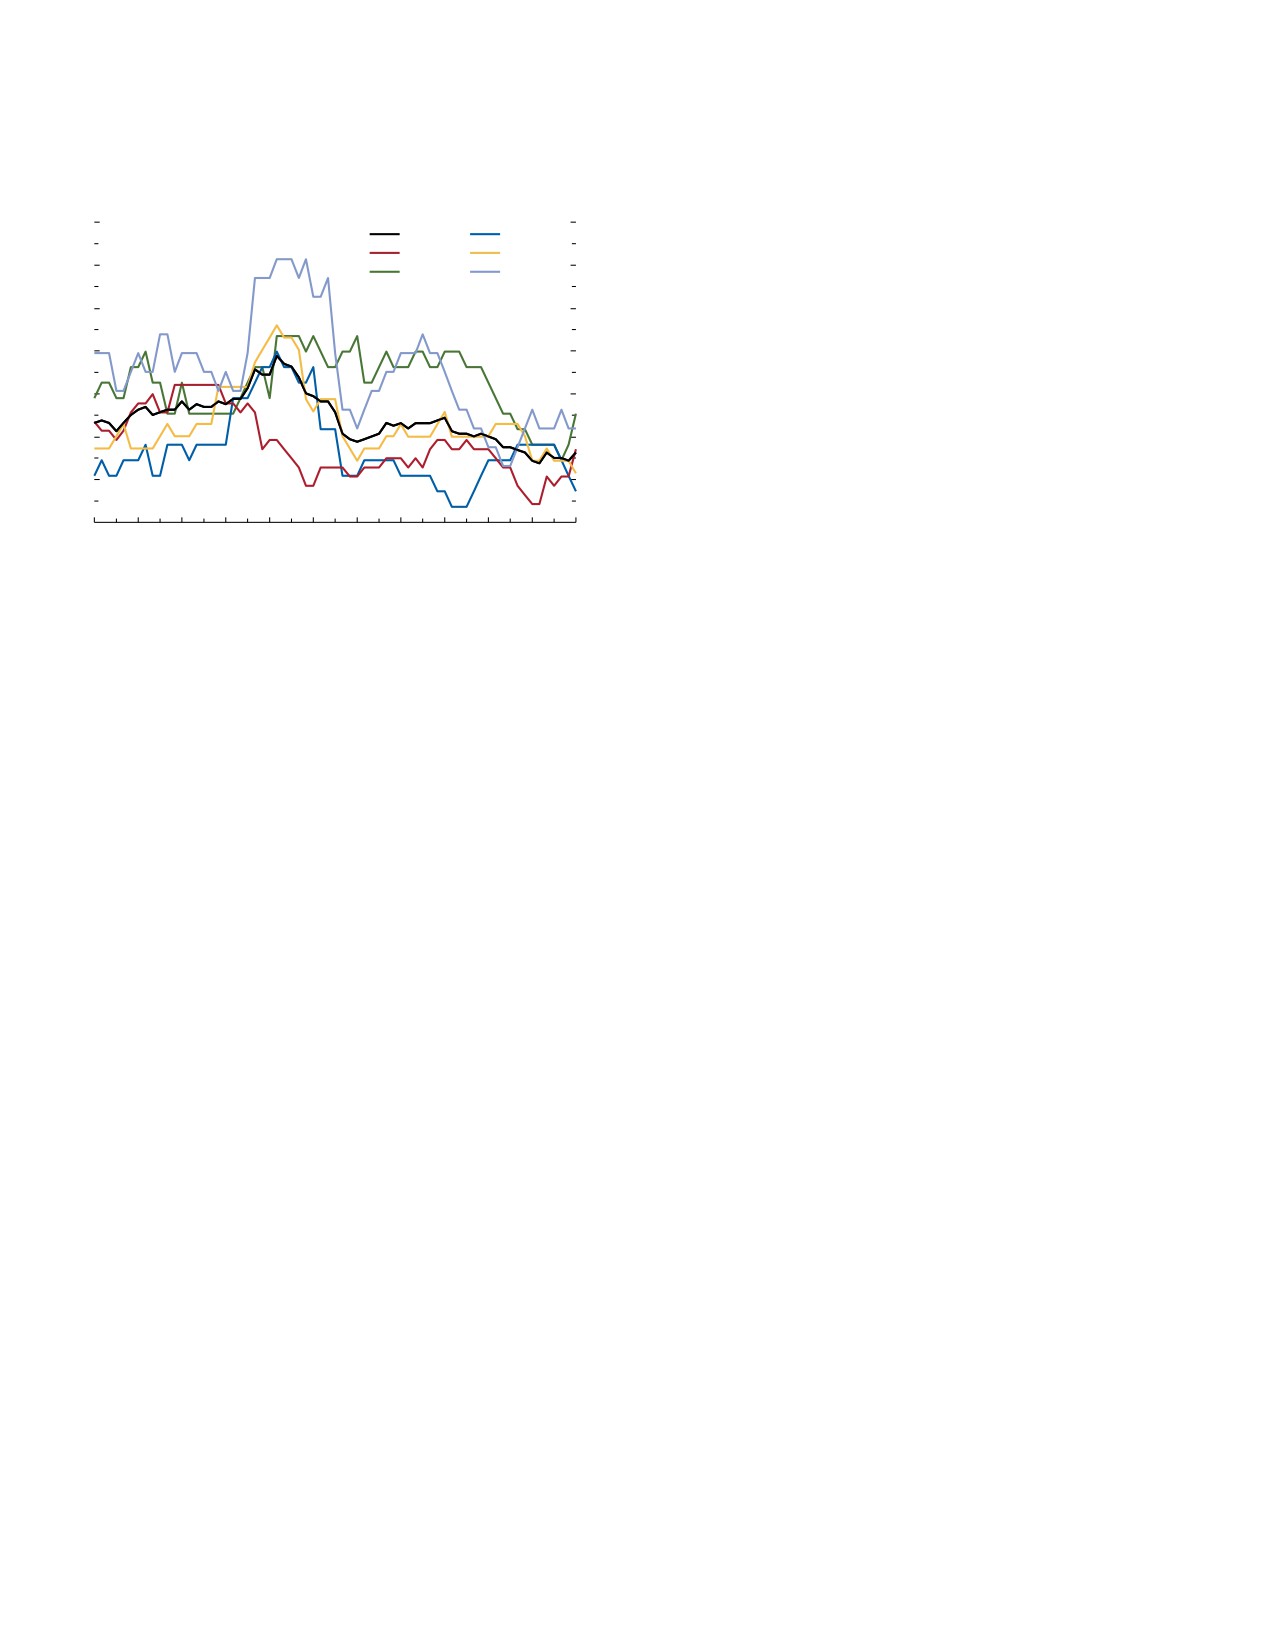
WORLD ECONOMIC OUTLOOK: Navigating Global Divergences
Figure 1.25. Social Unrest Stable at Low Level
Te estimated probability that global growth in 2023
(Percent of economies experiencing major social unrest)
will fall below 2.0 percent—an outcome that has
occurred only five times since 1970--is now about
7
All
APAC
5 percent, down from an estimated 25 percent at the
EUR
ME&CA
6
SSA
WH
time of the April 2023 WEO. For 2024, the probability
of such an outcome is about 15 percent, also down from
5
about 25 percent at the time of the April 2023 WEO.
4
A contraction in global per capita real GDP—which
often happens when there is a global recession—in 2024
3
has an estimated probability below 10 percent. At the
2
same time, the probability of global growth’s exceeding
3.8 percent (the historical average during 2000-19) is
1
also less than 20 percent for 2024, highlighting the rela-
tively slow outlook for global growth. Turning to prices,
0
2018
19
20
21
22
23
July
the probability that core inflation in 2024 will be higher
23
than in 2023, instead of declining to 5.3 percent from
Source: IMF staff calculations.
6.3 percent in 2023, is assessed at about 15 percent.
Note: The figure shows the fraction of countries within a world region experiencing
major events of social unrest (including protests, riots, and major demonstrations)
in the preceding 12 months. All = All economies; APAC = Asia-Pacific;
Policy Priorities: From Disinflation to
EUR = Europe; ME&CA = Middle East and Central Asia; SSA = sub-Saharan Africa;
WH = Western Hemisphere.
Sustained Growth
With inflation declining, policymakers are approach-
ing the final stage of the inflation cycle that started
blocs that trade exclusively with one another—could
in 2021. But despite the progress, persistent policy
reduce annual global GDP by up to 7 percent (Aiyar
challenges remain. Underlying inflation is still too high
and others 2023). Intensification of geoeconomic
in most countries and could easily persist, and bud-
fragmentation would also hamper multilateral
getary space for needed investments is constrained in
cooperation in providing crucial public goods, such
many cases, particularly in lower- and middle-income
as fighting climate change and future pandemics and
countries saddled with unsustainable debts. Putting a
ensuring energy and food security.
priority on supply-enhancing reforms that front-load
••
Social unrest resumes. Reports of social unrest—
gains and foster buy-in would narrow the large output
including protests, riots, and major demonstrations—
losses projected under current policies, especially for
have declined internationally since reaching elevated
emerging market and developing economies. Mit-
levels in late 2019 (Figure 1.25, which updates
igating the negative effects of climate change and
the index of Barrett and others 2022). However, a
geoeconomic fragmentation and protecting the most
resumption of social turmoil, potentially as a result of
vulnerable will require swift and internationally coordi-
future food and fuel price spikes, could hurt eco-
nated policy actions.
nomic activity, particularly in countries with more
limited scope to cushion the impact through policies
Policies with Near-Term Impact
(Hadzi-Vaskov, Pienknagura, and Ricci 2021).
Social unrest could also complicate the passage and
Durably restoring price stability: With global core
implementation of necessary reforms, including those
inflation still high and declining slowly, central banks
relating to the energy transition.
should generally maintain a tight stance and avoid
prematurely easing monetary policy. At the same time,
there are fewer cases in which sizable interest rate hikes
Globally Consistent Risk Assessment of the World
are warranted, with increasing differentiation across
Economic Outlook Forecast
countries’ policy needs for ensuring price stability.
Te risk of a hard landing has clearly receded since
••
Returning inflation to target: In economies in which
April, as the quantitative analysis in Box 1.2, based on
inflation is still elevated and persistent, a restrictive
the IMF’s Group of Twenty (G20) Model, illustrates.
stance—with real rates above neutral—is needed until
22
International Monetary Fund | October 2023
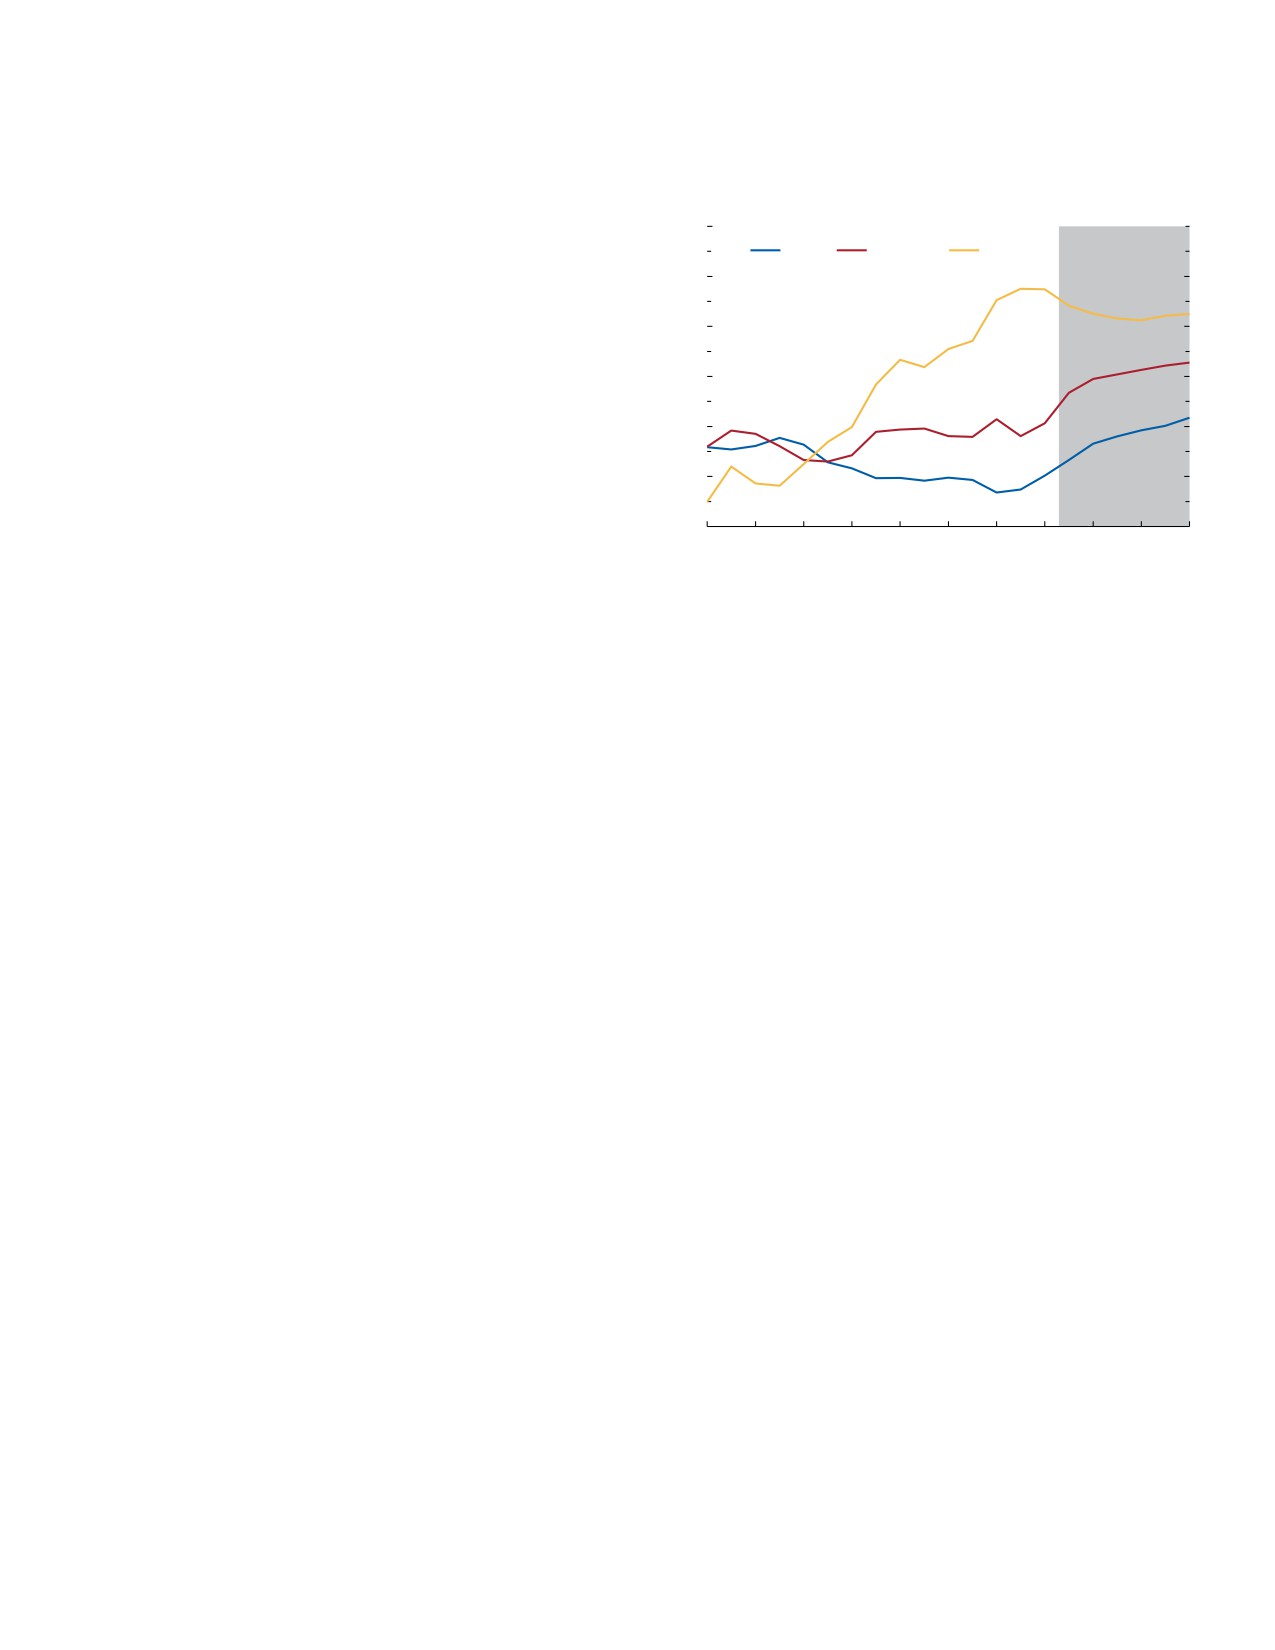
CHAPTER 1 Global Prospects and Policies
clear signs emerge that underlying inflation is durably
Figure 1.26. General Government Interest Payments
cooling. This is critical to safeguarding the success of
(Percent of general government revenues)
many central banks in keeping longer-term inflation
16
expectations anchored. As Chapter 2 explains, strong
AEs
EMMIEs
LIDCs
monetary policy frameworks and effective commu-
14
nication are vital for minimizing the output costs
of disinflation. Once underlying inflation is clearly
12
cooling, with inflation and inflation expectations
approaching the target, moving rates gradually to a
10
more neutral policy stance may be warranted, while
signaling continued commitment to price stability.
8
For countries with inflation already below target,
6
easing policies may be necessary to reduce the risks of
inflation expectations de-anchoring.
4
••
Navigating uncertainty along the disinflation path:
2008
10
12
14
16
18
20
22
24
26
28
The task for central banks is complicated by the
Source: IMF staff calculations.
difficulty of estimating with confidence levels of
Note: AEs = advanced economies; EMMIEs = emerging market and middle-
neutral rates of interest and of unemployment, as
income economies; LIDCs = low-income developing countries.
well as by lags in policy transmission (see Box 1.2
of the April 2023 WEO), uncertainties associated
with forecasting inflation in this environment, and
tain signs of market strain (Adrian, Gopinath, and
the differing potency of the transmission mecha-
Gourinchas 2023).
nism across economic sectors. Calibrating monetary
policy will require weighing the costs of lowering
Strengthening financial supervision and addressing
nominal rates prematurely versus those of delay-
stress: Te fast pace of monetary policy tightening
ing too much.
continues to put the financial sector under pressure.
••
Coordinating monetary and fiscal policies: Although
Strengthened supervision (through implementation
the primary responsibility for restoring price stabil-
of Basel III and removal of forbearance measures) and
ity lies with central banks, legislated government
the monitoring of risks to anticipate further episodes
spending cuts or tax increases aimed at ensuring
of banking sector stress are warranted. Te intensity of
public debt sustainability can, by reducing aggregate
supervision should be commensurate with banks’ risks
demand and reinforcing the overall credibility of
and systemic importance, and it is essential to rapidly
disinflation strategies, further ease inflation. This
close oversight gaps in the nonbank financial sector.
is especially the case in countries with overheated
Macroprudential policy measures could be employed
economies and steep inflation-unemployment
preemptively to tackle emerging risks in banks and
trade-offs. By the same token, in economies with
nonbank financial institutions. Where market strains
inflation below target, fiscal expansion or a tilting of
emerge, deploying tools that provide liquidity support
government spending toward items more supportive
promptly and forcefully, while mitigating the risk of
of demand, such as targeted household transfers,
moral hazard, would limit contagion. In China, where
may be necessary, subject to available budgetary
continued financial stress in the property sector pres-
room for maneuver.
ents a downside risk to global growth, stronger action
••
Monitoring financing conditions: Financing condi-
by the central government is needed to avert macrofi-
tions in capital markets have eased in the United
nancial feedback loops. Tis action should include fur-
States and the euro area (Adrian, Natalucci, and
ther efforts to facilitate the exit of insolvent developers
Wu 2023), which may complicate the task of
while protecting home buyers’ interests, which would
fighting inflation. Careful monitoring of serious
also help restore home buyer confidence. Countries at
misalignment in financing conditions is warranted
risk of external shocks can make full use of the global
given the potential repercussions from a sudden
financial safety net afforded by international financial
repricing of risk. Central banks should be ready to
institutions, including IMF precautionary financial
deploy necessary financial stability tools to con-
arrangements.
International Monetary Fund | October 2023
23
WORLD ECONOMIC OUTLOOK: Navigating Global Divergences
Normalizing fiscal policy: With fiscal deficits
Strengthened multilateral cooperation on food security
and government debt above prepandemic levels
is needed, with strengthened rules-based frameworks for
and debt-service costs as a share of GDP rising
restrictions on food exports (see Chapter 3).
(Figure 1.26), tightening the fiscal stance is warranted
Enhancing labor supply: Reforms that reduce labor
in numerous cases to restore room for budgetary
market tightness—by encouraging participation and
maneuver. In low-income and developing countries,
reducing job search and job matching frictions—would
interest payments constitute nearly one-eighth of
facilitate fiscal consolidation and contribute gradually
general government revenues. For countries with lim-
to easing inflation. Such reforms include short-term
ited fiscal space, shifting the composition of spending
training programs for professions experiencing short-
toward items that provide targeted support to house-
ages and labor laws and regulations that increase work
holds can support activity. Careful communication of
flexibility through telework and leave policies. Policies
medium-term fiscal policy plans is needed to support
that encourage more women and older people to join
credibility and avert disruptive market responses. Where
the workforce, reduce labor market duality, and improve
countries are in or at high risk of debt distress, achiev-
mobility would further enhance labor supply. Active
ing debt sustainability may require not only well-timed
immigration policies in advanced economies can address
fiscal consolidation, but also debt restructuring (see
labor shortages as well as longer-term headwinds to
Chapter 3 of the April 2023 WEO). Domestic revenue
growth, including those from population aging.
mobilization, more efficient spending, and improved
institutional fiscal frameworks are increasingly pertinent
Policies with Medium-Term Payoffs
for emerging market and developing economies given
high debt levels and sizable spending needs.
Intensifying macrostructural reforms: Targeted and
Supporting the vulnerable: Te composition of fiscal
carefully sequenced structural reforms can equip policy-
adjustment should protect the most vulnerable, by
makers with additional levers to reinforce productivity
means of targeted support to households, among other
growth despite constrained policy space. Tis is all the
methods, especially in the context of large swings in
more important given the decline in medium-term
energy and food prices. Phasing out untargeted fiscal
growth prospects (Box 1.1). Making a priority of and
measures, especially those that blunt price signals—
bundling reforms that alleviate the most critical binding
such as energy subsidies—is warranted as energy prices
constraints to economic activity—such as governance,
return to prepandemic levels.
business regulation, and external sector reforms—can
Avoiding debt distress: Large short-term external
help front-load the resulting output gains, which helps
financing needs are stretching the ability of numerous
ensure public buy-in. IMF staff analysis for emerg-
emerging market economies and low-income coun-
ing market and developing economies (Budina and
tries to service their debt. Sovereign spreads remain
others 2023) suggests that output gains from reforms
elevated, impeding access to credit for many economies
can be substantial, even in the short term. In cases
reliant on short-term borrowing. Faster and more
with large initial gaps in structural indicators relative
efficient coordination on debt resolution, through the
to the best performance, a bundled and sequenced
G20 Common Framework and the Global Sovereign
reform package is estimated to lift the level of output
Debt Roundtable, among other options, would help
by 4 percent in two years and 8 percent in four years.
mitigate the risk of debt distress spreading. Te recent
Gains of this magnitude would significantly narrow the
agreement between Zambia and its official creditor
aforementioned output losses from the pandemic for
committee is a welcome step in that direction.
these economies. More broadly, reforms ranging from
Improving food security: Extreme weather conditions—
enhancing human capital by expanding health care
heat waves, floods, and wildfires—are exacerbating risks
coverage and increasing access to early childhood and
to the global supply of staple crops, including risks from
higher education, to reducing barriers to competition
the war in Ukraine, and threaten food security for mil-
and supporting start-ups, to deepening digitalization
lions of people. In this context, trade restrictions aimed
would, depending on the economy in which they were
at reducing domestic prices could worsen global food
enacted, enhance productivity. By accelerating growth,
insecurity and create shortages for the world’s poorest
such reforms can also help assuage concerns about
people. Bans on food exports should be lifted as soon
potential short-term growth costs of ambitious green
as feasible to safeguard the global flow of food supplies.
reforms, including those that operate through energy
24
International Monetary Fund | October 2023
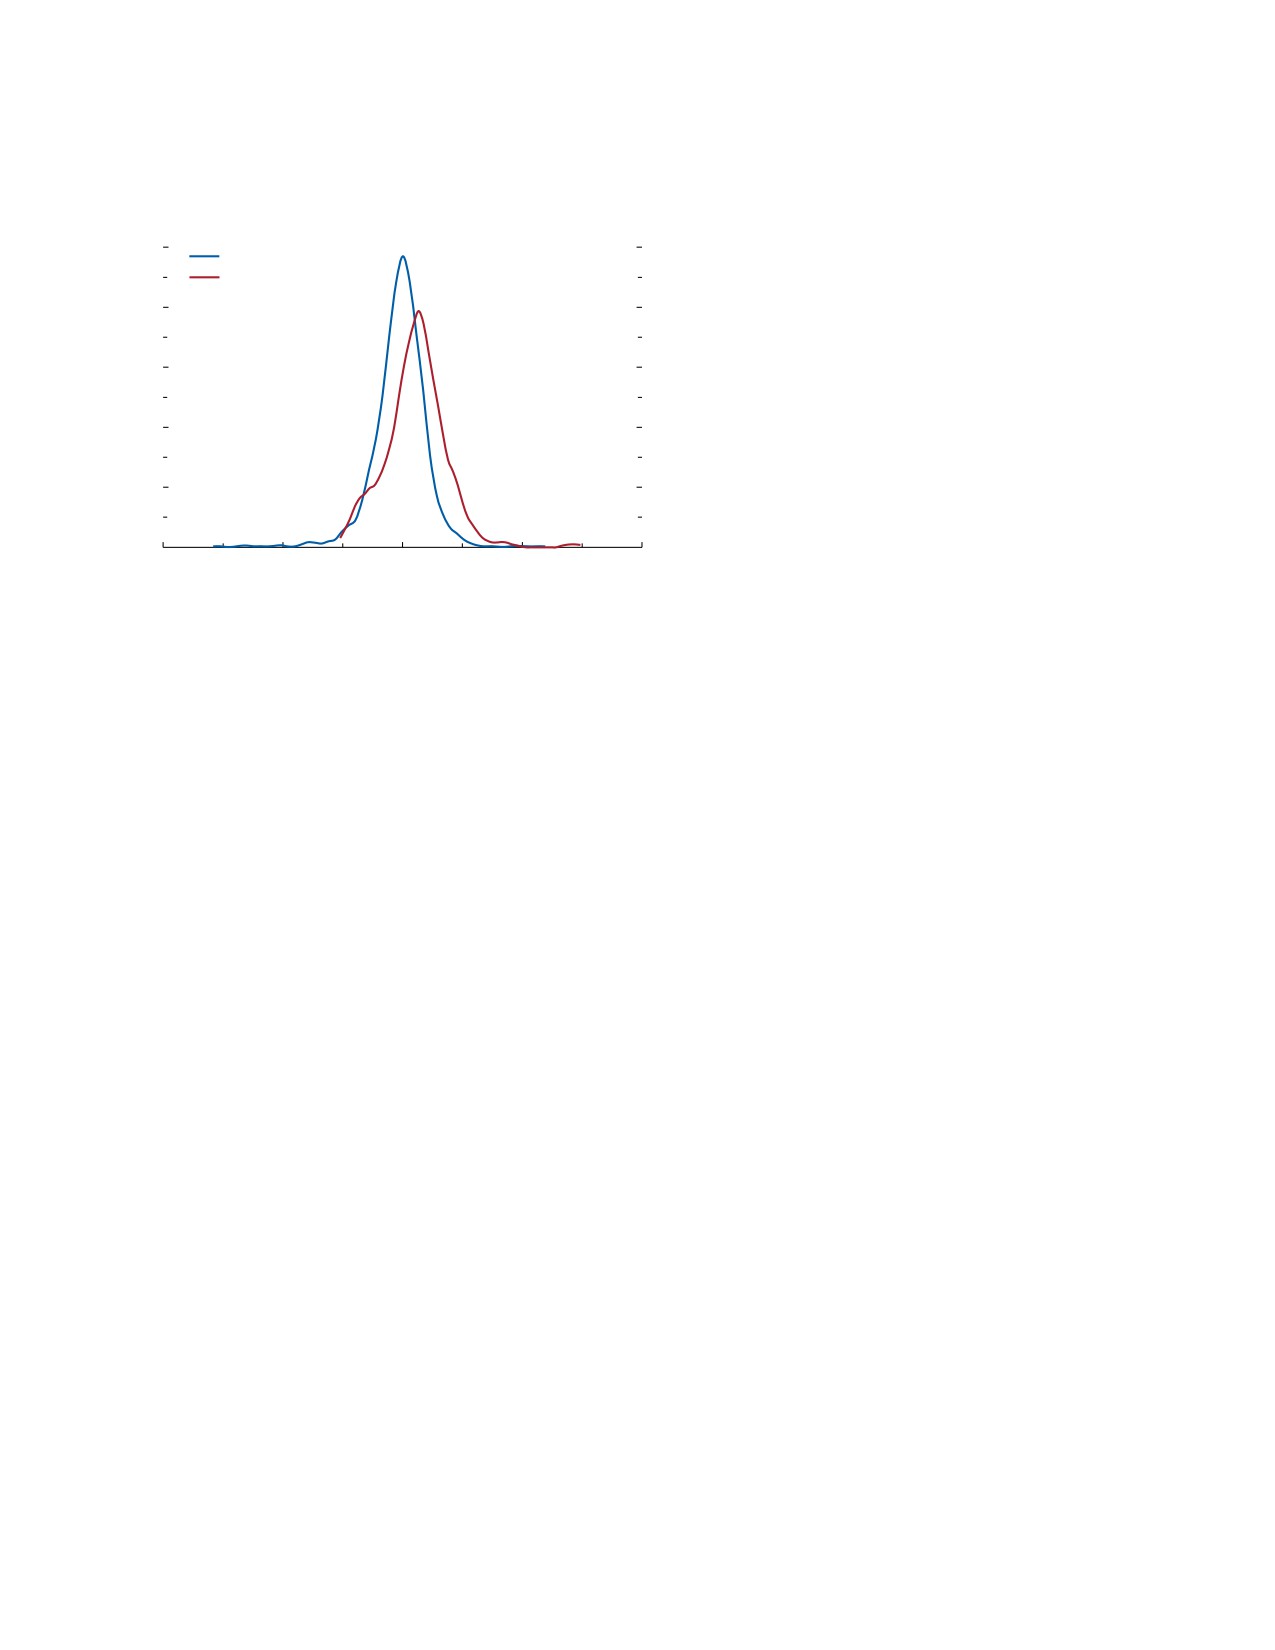
CHAPTER 1 Global Prospects and Policies
Figure 1.27. Firms Less Green in Emerging Market
mechanisms can encourage trading partners to decar-
Economies
bonize and can ensure an equal footing for domestic
(Density)
producers and those in countries with less ambitious
carbon-emissions-reduction targets, but they must be
0.5
Advanced economies
designed carefully to support consistency with WTO
Emerging market and
developing economies
rules. Green industrial policies—currently pursued in
0.4
China, the United States, and the European Union—
complement carbon pricing to speed the transition.
0.3
However, they also should be designed in a manner
that avoids distortions to international trade (such
0.2
as domestic-content provisions) and investment, also
in line with WTO rules. In parallel, investments in
0.1
climate adaptation activities and infrastructure are
needed, especially for the regions most vulnerable to
climate shocks. Enhancing climate-risk-monitoring
0.0
-10
-5
0
5
10
systems and risk management frameworks and stronger
Log of emissions-to-revenues ratio
safety nets and insurance are also needed to enhance
Source: IMF staff calculations.
climate resilience (October 2023 Fiscal Monitor).
Note: The figure plots the kernel density of the log of the emissions-to-revenues
Establishing a “green corridor” and increasing data
ratio separately for firms headquartered in advanced economies and in emerging
sharing: A green corridor agreement is necessary to
market and developing economies, after controlling for industry fixed effects
(4-digit SIC). Data for 2019 are used, and finance, utilities, and energy sectors are
safeguard the international flow of critical miner-
excluded. The calculations are based on Capelle and others (forthcoming).
als needed for the green transition. It should tran-
SIC = Standard Industrial Classification.
scend geopolitical boundaries and be guided by the
principles of common climate goals rather than
prices (see Chapter 2 of the October 2022 WEO), and
beggar-thy-neighbor policies. Similar agreements could
create the necessary fiscal space for implementation. In
stabilize essential agricultural commodity markets by
general, mitigating the potential adverse distributional
dampening supply volatility in the wake of adverse
effects of reforms across economic groups (including
shocks. Prudent risk management also calls for
those relating to gender and age) requires complemen-
investing in diversified supply sources to minimize the
tary policies, including targeted support and regulations
potential fallout in case of further fragmentation in
to ensure that the reform benefits are shared. Industrial
commodity markets. A lack of data on critical minerals
policies could be pursued where externalities or market
for the green transition raises uncertainty for producers
failures are well established and other policies are not
and consumers and leads to price volatility. An inter-
available but should avoid protectionist provisions and
national platform or organization could improve data
be consistent with international agreements and World
sharing and standardization (see Chapter 3).
Trade Organization (WTO) rules.
Strengthening multilateral cooperation and mitigating
Speeding the green transition and mitigating the
the effects of fragmentation: Multilateral cooperation is
effects of climate change: Reductions in global emis-
vital for achieving progress in dealing with the inter-
sions are needed to mitigate climate change. Envi-
locking challenges holding back global recovery. Joint
ronmental performance varies widely across firms
action is needed on many fronts, and further geo-
within industries (Figure 1.27). Laggards—firms with
economic fragmentation would trigger costly delays.
high emissions per unit of output relative to indus-
Restoring trust in multilateral frameworks is urgently
try peers—operate older physical capital and are less
needed to revive a rules-based platform of international
knowledge-intensive and productive (Capelle and
cooperation, to foster shared global prosperity, and to
others, forthcoming). Significant emissions cuts could
regulate potentially disruptive emerging technologies
be achieved by helping these firms approach current
such as artificial intelligence. At the center of such
technological frontiers. Carbon pricing and subsidies
reforms, enhancing trade policy certainty should be a
for green investments would support the adoption of
priority. Necessary first steps should include restoring
frontier technologies, helping make production both
binding dispute settlement in the WTO and clarifying
greener and more efficient. Carbon border-adjustment
the application of key WTO rules to climate measures.
International Monetary Fund | October 2023
25
//////////////////////////////////////////