Technology of watch production - part 12
 

  Index      Books     Technology of watch production (Tarasov) 1964 year


Search            


Content   ..  10  11  12  13   ..


Technology of watch production - part 12


specimen  is  s t retched  under the  continuously  increasing load,  its  length 
increas e s ,

and  its  cross  section  decreases . 

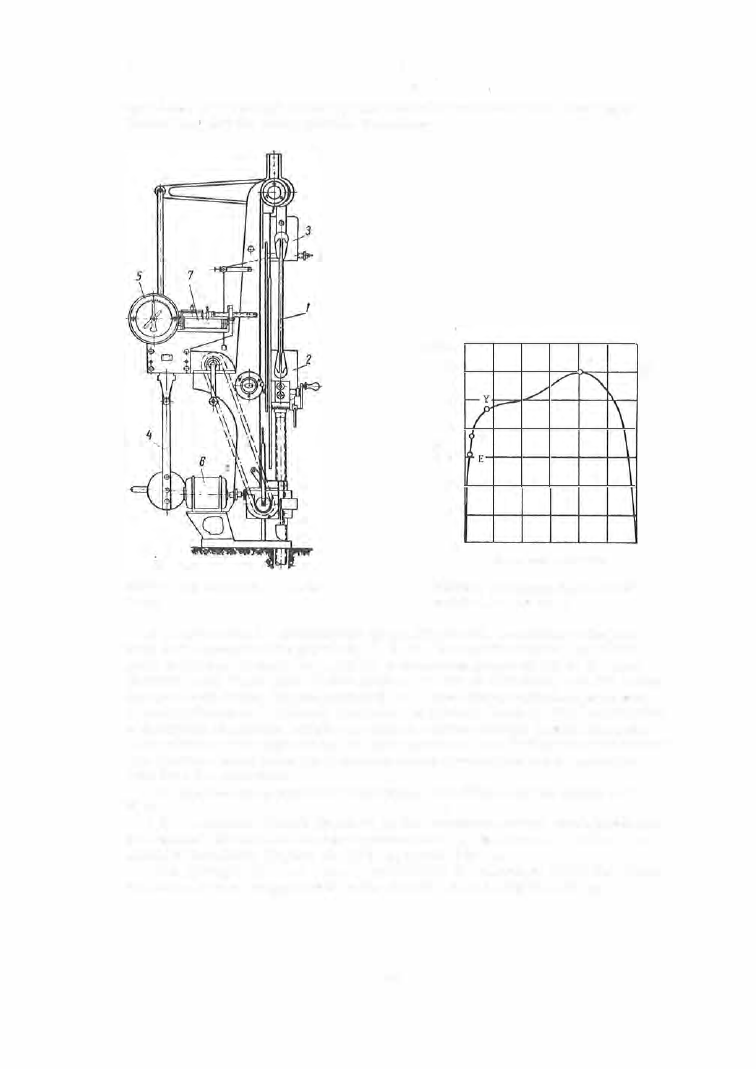
FIGURE 

2.  The 

P-5 

machine for tensile 

testing 

kg/mm2 

GO 

30 

40 

"0 

"' 

30 

,.., 

20 

10 

mm 

Deformation (extension) 

FIGURE 

3.  Deformation diagram of 

U1 OA 

steel (in the annealed state) 

If  we  plot a load  - defo rmation  graph  (Figure  3 ),  we  obtain a  diagram 

60 

with  four characteristic points  E,  P ,   Y,  S .   A  s traight section,  up  to  the 
point E  follows  Hooke ' s  law  with the  deformation p roportional  to  the load . 

Between point  E  and  point  Y  this  p roportionality  is  dis turbed,  and  the  curve 

inclines to the right.  B eyond point Y the tes t-specim en length increases with 

almost no increas e in the load,  the m etal,  as it were,  flowing.  The load reaches 

a  maximum  at point  S,  which corresponds  to  the  ultimate  tens ile  s trength, 

after which a  neck  app ears  on the  test  specimen,  and finally fracture  occurs . 

The  fracture  takes  place  on  a  smalle r  cross  se ction  and  under a  s malle r 

load  than  the  maximum . 

The  m echanical  p roperties  of  the  metal  are  defined by  the  points  E ,   P, 

Y,  S. 

T h e   e l a s t i c   l i m i t   (point  E)  is the  maximum  s tress  which produces 

no  resid ual  defo rm ation  or some p redete rmined,  very small,  value  of  re­

sidual  deformation  (Figure  3 ) .   It is  designated by 

E· 

T h e   p r o p o r t i o n a l   l i m i t   (point P )  is  the  s tress  at which  the  elonga­

tion  ceases  to  be  p roportional  to  the  s tres s .   It is  designated by 

a p. 

45 

T h e   y i e l d   s t r e n g t h   o r   p o i n t   (point Y )  is  the  stress  at which 

further deformation  (elongation )  of the  specimen be gins  to  take  place  with 

no  further increas e  in load .  It is  designated by 

o y. 

T h e   u l t i m a t e   t e n s i l e   s t r e n g t h   (point S )  is  defined as  the  ratio 

of the  maximum  load  recorded during  the  tes t,  to  the  initial  cross  section 

of the  test  specimen.  It is  designated by 

a s 

and  defined by the formula 

where 

max 

=  maxim urn  load; 

Pmax 

OS 

= fo '  

fo 

= initial  cross  section of  the  test specim en. 

T h e   p e r c e n t a g e  e l o n g a t i o n   is the  residual  deformation as  a  per­

centage  ratio  of the  initial  test- specim en  length .  It is  designated by 

and 

defined by  the  formula 

whe re 

=  length  of the  deformed test  specimen; 

[0 

= initial (gage )  length  of the  test  specimen. 

The  P - 5  tensile  testing m achine  (Figure  2) was  designed for the s tatic 

compression and  tensile  tes ting  of metals .  It  can  be  adapted,  by  means  of 

special  attachments ,  to s hearing,  bending,  and extrusion tests .  The uppe r  
chuck of the  machine is  connected t o  a  lever-pendulum  dynamomete r  (4 ), 

on  whose  scale  ( 5 )  the  value of the load  can be  read .  The  operating loads 
of the  machine are from  2 0 0  to  5000 kg.  The  machine  has  four s cales ;  

0- 50  kg, 

1vith a scale division of 

. . . . . . . .

.

2  kg 

0-1 00  kg, 

.. 

.. 

.. 

..  . . . . . . . . . .  5  .. 

0-250 kg, 

.. . . . . . . . . . .  10  " 

0-500 kg, 

.. . . . . . . . . . .  10  .. 

The  lower  chuck  is  powered by means  of the  electric  motor ( 7 )  and  a 

manual  drive  is  als o  p rovided.  The  recorder  (7) records  the  deformation 
of the  specimen  on paper. 

The  allowable  error in  the  readings  is  1 %  of the  load . 

T h e   h a r d n e s s  t e s t  is  widely applied  in m echanical  tests .  Both 

nonhardened  and  ha rdened  pa rts  are  tested for hardness .  Chemical  analysis 

and  tensile  tests are tim e - and work - consuming proces ses ,  and  are  destruc ­
tive  of  the  specimens .  Hardness  tests ,  on  the  othe r  hand,  take  only  several 

minutes  and  are  basically  nondes tructive .  The  ins trum ents  used  for  ha rd­

nes s  tests  are  s imple  and do  not  require foundations .  The  tests  can be 

run  inside  the  storeroom  or in the  heat-treatm ent  shop . 

The  basic  hardness  tests  are  the  B rinell  test,  conducted  on  the  PBM 

tester,  and the  Rockwell  test,  carried out on the  RV apparatus .  The PBM 

tester is us ed for testing nonhardened  metal s .   In the  Brinell  test, accord­

ing to OST 1 02 4 1 - 4 0 ,   a  s teel  ball  is press ed  into  the  m etal  to be tested,  and 

the  diameter o f  the  indentation  is  measured by  m eans  of  a  magnifying  glass 

or a  microscop e .   The B rinell  hardness  is  defined  as  the load divided by 
the  spherical  surface  of  the  impression  (Figure 

).  It is  designated  as 

and  calculated  using the  following fo rmula: 

13 

- = 

( D -

02 - d2) 

46 

2P 

nO 

(D 

-

oz -

d2)  ' 

where 

Hs 

the  Brinell  hardne s s ,   in kg/mm 2 ; 

'

the  load  on  the  steel  ball,  in  kg; 

the  diameter of the  steel  ball,  in  mm; 

the  diamete r  of  the  imprint,  in mm; 

the  surface  of the  imprint; 

In  the  PBlVI  tester the  load  is  transmitted  from  the  weights  ( 5 )  to  the 

steel  ball  through  a  leve r  sys tem  (Figure  5 ). 

To  begin  with ,  the  beam  ( 1 )  rests  on  the  roll er of  the  connecting  rod (2 ) .  

When  the  electric  moto r i s  switched o n ,   the  conne cting  rod  drops  and  the 

load  ( 5 )  is  transferred  to  the  ball

"

(

3

which  indents  the  specimen  or  part 

tested.  The  surface  of the specimen  must be  flat 

in  order  that  the  edges  of  the  imprint  be  clearly 

visible  and  given to  accurate  measurement by means 
of  a  micros cope . 

The  magnitude  of  the  load ,  the  diameter of  the 

ball ,  and the length  of  the  time  during which the  spe­

cimen  is kept under load (i. e .   the  load- application 

tim e )  are  determined from  Table  1 1 .  

The  specimen to  be tested is  placed on the  table 

of the  PBlVI  tester and  applied  against the  ball  (to 

FIGURE 4.  Scheme of the Brinell 

a  given  depth )  by turning the  handwheel 

(4 ) .  

The 

hardness test 

electric  m otor is  then  s witched on  and  the  main load 
is  applied  to  the steel  ball .  At the end of the spe­

cified load - application time  the  electric  motor is  automatically  switched  off 

and  the  load  is  remove d .   The  table  is  lowe red by  means  of the  handwheel ,  

the  specimen  is  removed,  and  the  imprint  diameter m easured . 

FIGURE 

5. 

PBM  rester  for Brinell  hardness tests 

4 7  

The  need  for subsequent  calculations  can  be  avoided by  using tables  which 

give  the  values  of  H8  as  a  function  of the  imprint diameter for  given  values 
of loa-d  and  ball  diamete r .   The  values  of  H 

corresponding  to  a  load 

3000 kg  and  a  1 0  m m  diameter steel  ball  are  given in  Table  1 2 .  

TABLE  11 

Conditions for Brinell tests 

Hardness range, 

Thickness of the 

Ball  diameter, 

Load-application 

Metal 

test specimen, 

Load, kg 

kg/mm2 

mm 

time,  sec 

mm 

More than 6 

1 0  

3,000 

Ferrous metals 

.

. . . .  

140-450 

From 3 to  6 

750 

1 0  

Less than  3 

2.5 

187.5 

More than  6 

1 0  

3 , 000 

The same 

. . • . . . . . . 

Up tol40 

From 3 to  6 

750 

30 

Less than  3 

2.5 

187.5 

Nonferrous metals and 

31 .8-130 

More than  6 

1 0  

1 , 000 

30 

alloys (copper, brass, 

From 3 to  6 

250 

bronze,  etc . )  

Nonferrous metals and 

8-35 

Not less than 6 

1 0  

250 

60 

alloys ( aluminum , 

bearing alloys, etc . )  

When soft  m aterials  or thin  p arts  are  tested,  the  load and  the  diameter 

of the ball  are  reduced  s o  as  to  avoid p enetration  of the indenter through 

the  s pecimen.  B rinell  hardness  tests  give  reliable  results  for hardnesses 

up to  H8 

3 5 0 kg/ mm2 .  When m etals  of higher  hardness are tested the 

ball is  liable  to  become  defo rmed (owing to its  insufficient hardnes s ) . 

The  Rockwell  test  (see Figure  6 )  is  s uitable  for both s oft  and  hardened 

metals .  It consists  in  forcing into  the  m etal  eithe r a s teel ball of 1 . 588 mm 

diameter or a  conical  diamond indenter with an apex angle of  1 2 0°. 

The  ball  is  used for tes ting  s oft  metal s ,   and the  diamond cone for  meas ­

uring hardened parts . 

Rockwell  hardness  is  dete rmined from  the  difference between  the  depths 

of  penetration  of  the  diamond  cone  (or  the  s teel  ball )  under the action  of 

two  consecutive  loads - an initial and a  major load.  The  load  is  applied by 
the  beam  ( 1 )  on  which  weights  ( 2 )  are  suspended.  A  turn  of the c rank  ( 3 )  

connects  the  load  and  transfers  i t  t o  the  indente r  (diam ond  cone o r  s teel  ball ) 

(4 ),  which is  thus  forced into  the  surface being tested.  The  depth  of  p ene ­

tration  is  measured by  the  dial  indicator  ( 5 ). 

The  design  of  the  apparatus  permits  direct  reading of hardness  on  the 

indica tor scale . 

The  method for conducting  Rockwell  tests  has  been s tandardized  (OST 

1 02 4 2 - 4 0 ) .   The  tests  can  be  conducted using one  of the following three in­

dicator s cales  (Table  1 3  ) .  

The  exte rnal  (black) s cale  of  the indicator i s  used  for  readings  o n  s cale s  

and 

C .  

The  inte rnal  red scale  s e rves  fo r  scale 

B .  

Hardness  values  according 

to  these  scales  are  des ignated HRA ,  HRa •  HRc ':' . Scal e  

is  used  fo r  tes ting 

• 

[According to American usage :  RA , 

R8,  Rc. l  

4 8  


Content   ..  10  11  12  13   ..