DB2 Server for VSE. Operations Guide / Handbooks (2004-2007) - page 27
Notices
IBM may not offer the products, services, or features discussed in this document in
all countries. Consult your local IBM representative for information on the
products and services currently available in your area. Any reference to an IBM
product, program, or service is not intended to state or imply that only that IBM
product, program, or service may be used. Any functionally equivalent product,
program, or service that does not infringe any IBM intellectual property right may
be used instead. However, it is the user’s responsibility to evaluate and verify the
operation of any non-IBM product, program, or service.
IBM may have patents or pending patent applications covering subject matter
described in this document. The furnishing of this document does not give you
any license to these patents. You can send license inquiries, in writing, to:
IBM Director of Licensing
IBM Corporation
North Castle Drive
Armonk, NY 10594-1785
U.S.A.
For license inquiries regarding double-byte (DBCS) information, contact the IBM
Intellectual Property Department in your country or send inquiries, in writing, to:
IBM World Trade Asia Corporation
Licensing
2-31 Roppongi 3-chome, Minato-ku
Tokyo 106, Japan
The following paragraph does not apply to the United Kingdom or any other
country where such provisions are inconsistent with local law:
INTERNATIONAL BUSINESS MACHINES CORPORATION PROVIDES THIS
PUBLICATION “AS IS” WITHOUT WARRANTY OF ANY KIND, EITHER
EXPRESS OR IMPLIED, INCLUDING, BUT NOT LIMITED TO, THE IMPLIED
WARRANTIES OF NON-INFRINGEMENT, MERCHANTABILITY OR FITNESS
FOR A PARTICULAR PURPOSE. Some states do not allow disclaimer of express or
implied warranties in certain transactions, therefore, this statement may not apply
to you.
This information could include technical inaccuracies or typographical errors.
Changes are periodically made to the information herein; these changes will be
incorporated in new editions of the publication. IBM may make improvements
and/or changes in the product(s) and/or the program(s) described in this
publication at any time without notice.
Any references in this information to non-IBM Web sites are provided for
convenience only and do not in any manner serve as an endorsement of those Web
sites. The materials at those Web sites are not part of the materials for this IBM
product and use of those Web sites is at your own risk.
IBM may use or distribute any of the information you supply in any way it
believes appropriate without incurring any obligation to you.
217
Licensees of this program who wish to have information about it for the purpose
of enabling: (i) the exchange of information between independently created
programs and other programs (including this one) and (ii) the mutual use of the
information which has been exchanged, should contact:
IBM Corporation
Mail Station P300
522 South Road
Poughkeepsie, NY 12601-5400
U.S.A
Such information may be available, subject to appropriate terms and conditions,
including in some cases, payment of a fee.
The licensed program described in this information and all licensed material
available for it are provided by IBM under terms of the IBM Customer Agreement,
IBM International Program License Agreement, or any equivalent agreement
between us.
Any performance data contained herein was determined in a controlled
environment. Therefore, the results obtained in other operating environments may
vary significantly. Some measurements may have been made on development-level
systems and there is no guarantee that these measurements will be the same on
generally available systems. Furthermore, some measurement may have been
estimated through extrapolation. Actual results may vary. Users of this document
should verify the applicable data for their specific environment.
Information concerning non-IBM products was obtained from the suppliers of
those products, their published announcements, or other publicly available sources.
IBM has not tested those products and cannot confirm the accuracy of
performance, compatibility, or any other claims related to non-IBM products.
Questions on the capabilities of non-IBM products should be addressed to the
suppliers of those products.
All statements regarding IBM’s future direction or intent are subject to change or
withdrawal without notice, and represent goals and objectives only.
This information may contain examples of data and reports used in daily business
operations. To illustrate them as completely as possible, the examples include the
names of individuals, companies, brands, and products. All of these names are
fictitious and any similarity to the names and addresses used by an actual business
enterprise is entirely coincidental.
COPYRIGHT LICENSE:
This information may contain sample application programs in source language,
which illustrates programming techniques on various operating platforms. You
may copy, modify, and distribute these sample programs in any form without
payment to IBM, for the purposes of developing, using, marketing, or distributing
application programs conforming to the application programming interface for the
operating platform for which the sample programs are written. These examples
have not been thoroughly tested under all conditions. IBM, therefore, cannot
guarantee or imply reliability, serviceability, or function of these programs.
218
Operation
Trademarks
The following terms are trademarks of International Business Machines
Corporation in the United States and/or other countries:
AIX
CICS
CICS/VSE
DATABASE 2
DataPropagator
DB2
Distributed Relational Database Architecture
DRDA
IBM
IMS
OS/2
OS/400
OS/390
SQL/DS
System/370
System/390
VM/ESA
VSE/ESA
VTAM
QMF
Lotus and Lotus Notes are trademarks of Lotus Development Corporation in the
United States, other countries, or both.
Microsoft, Windows, Windows NT, and the Windows logo are trademarks of
Microsoft Corporation in the United States, other countries, or both.
Other company, product, and service names may be trademarks or service marks
of others.
Notices
219
DB2 Server for VSE & VM
IBM
Performance Tuning Handbook
Version 7 Release 5
GC09-2987-02
Contents
About This Manual
vii
Database catalog
38
Who Should Use This Manual
vii
Organization
vii
Chapter 3. Managing Storage and
Prerequisite Reading
viii
Configuring the Operating System . .
43
Syntax Notation Conventions
viii
Real and Virtual Storage
43
SQL Reserved Words
xii
Virtual Addressing
43
Conventions Used for Highlighting Examples . . . xii
Address Space Size
47
DASD Storage
58
Summary of Changes
xv
In VSE
58
Summary of Changes for DB2 Version 7 Release 5
xv
In VM
58
|
Enhancements, New Functions, and New
Mapping of Dbspaces to DASD
59
|
Capabilities
. xv
Logical To Physical Page Relationships . .
59
Storage Pools
59
Chapter 1. Improving Performance
1
Managing Storage Pool Space
59
Data Clustering
66
Elements of Performance
1
Reorganizing Data
70
Tuning Guidelines
1
Index Fragmentation
73
Performance Improvement Process
2
Invalid Indexes
74
How Much Can a System be Tuned?
3
DASD Balancing
75
Workload
3
Evenly Distributing Workload across Physical
Performance Indicators
3
Volumes
75
Establishing Performance Objectives
4
VM Specifics
78
Response Time
4
Fair Share Scheduling
78
Throughput
5
VSE Specifics
79
Availability
5
Dispatching Priority
79
A Less Formal Approach
5
Fast CCW Translation
79
Monitoring Performance
5
Virtual Addressability Extension (VAE) . .
79
Creating a Monitoring Plan
6
Compile Partition Size
80
Monitoring Interval
6
CICS Specifics
80
Cost of Monitoring
6
AMXT/MXT
80
Measurements
6
ISQL
80
Tools
7
Temporary storage
81
Factors Affecting Performance
9
Guest Sharing with VSE under VM
81
Resources
9
Distributed Configuration Considerations . .
81
Overhead
11
DB2 Server for non-DRDA Requestors can access:
81
Choosing Between Tuning Trade-offs
12
DB2 Server for VM non-DRDA Servers can be
accessed by:
81
Chapter 2. Measuring Performance . . 13
DB2 Server for VM DRDA Requestors can access:
82
Understanding Performance Measurements.
13
DB2 Server for VM DRDA Servers can be
Relative Measurements
13
accessed by:
82
Sampling Interval
14
DB2 Server for VSE non-DRDA Requestors can
Operating System Measurements
14
access:
82
Processor (CPU) Load
14
DB2 Server for VSE non-DRDA Servers can be
Real and Virtual Storage Load
14
accessed by:
82
System Paging DASD Load
14
DB2 Server for VSE DRDA Online (CICS)
Machine or Partition DASD I/O Load .
15
Requestors can access:
82
Individual Device Utilization
15
DB2 Server for VSE DRDA Batch Requestors can
Translating Performance Measurements to
access:
83
Indicators
15
DB2 Server for VSE DRDA Servers can be
CICS Monitoring (CICSPARS for VSE) .
17
accessed by:
83
DB2 Server for VSE & VM Tools
19
Performance Implications
83
Physical Data Locations
19
Applications Planning
83
Initialization Parameters
20
CIRD Transaction (CICS)
21
Chapter 4. Configuring the Application
COUNTER Operator Command
22
SHOW Commands
25
Server and Requester
85
iii
Database Manager Storage
85
Multiple Joins
136
Database I/O
85
Keeping Database Statistics Current
137
Package Cache
88
Using Catalog Statistics
139
Concurrency
88
Modelling your Production System
139
Agents
88
Determining the Cost of Access Methods
140
CICS
90
Processing Cost
140
Pseudo-Agents
91
I/O Cost
140
Dispatching Agents
92
Using Explanation Tables to Evaluate Performance
141
Startup Mode
93
Explain Processing
141
Locking
93
Estimating Sizes of Responses
153
Locking Contention
94
Using EXPLAIN for Database Design
154
Lock Escalation
99
Modifying Table Designs to Enhance Performance
154
Deadlock
101
Recovery
102
Chapter 6. Data Spaces Support for
Logical Units of Work
102
VM/ESA
157
Checkpoints
103
Improving DB2 Server for VM Performance . .
157
Logging and Archiving
105
Understanding VM Data Spaces
157
Communications
108
Understanding how VMDSS uses Data Spaces
159
DRDA Performance Considerations (VM) .
108
Storage Pools
163
Fetch and Insert Blocking
110
Internal Dbspaces
163
Synchronous Communications (VM)
112
Directory
164
Considerations for ISQL and Adhoc Queries .
112
Managing Main and Expanded Storage. .
166
AUTOCOMMIT
113
Striping
167
Isolation Levels
113
Performance Counters
168
Temporary Tables
113
Planning Structure by Storage Pool
169
Views
113
Logical and Physical Mapping
170
DBS Utility Considerations
114
VSE Guest Sharing
171
Automatic Statistics Collection
114
Enabling Requirements
171
Suppressing Automatic Statistics Collection
114
Operating System Overview
171
TAPE Blocking
114
Virtual Machine Overview
171
Lock Escalation
114
Software Requirements
172
UNLOAD and RELOAD PACKAGE
Virtual Storage Requirements
172
Considerations
115
Real Storage Requirements
172
DASD Storage Requirements
173
Chapter 5. Improving Data Access
Hardware Requirements
175
Performance
117
Before Enabling
175
Access Paths and Indexes
117
Program Directory for DB2 Server for VM .
175
Dbspace Scans
118
Preventive Service Planning
175
Index Scans
118
Corrective Service
175
Index-Only Access Scans
119
Enabling Options
175
Unique Index with Key Matching Predicate(s)
120
Enabling
176
Indexes for Sorting
120
Pre-Enable Checklist
176
Recommendations for Indexes
120
Enable Checklist
176
Disadvantages of Indexes
121
Backing Up, Configuring and Enabling Your
Placing Tables into Dbspaces
121
Database Machine
177
Organizing Referential Structures
121
Disabling VMDSS
188
Predicate Processing
122
Operating
188
Column Attributes
123
Storage Pool Specifications
188
Key-matching Predicates
123
Changing Storage Pool Specifications at Startup
189
Sargable and Residual Predicates
125
Checking Your Current Storage Pool
Join Predicates
126
Specifications
191
Search Conditions and Their Processing
Changing Storage Pool Specifications
Characteristics
126
Dynamically
191
Filter Factors
130
Using Data Spaces with Internal Dbspaces . . .
192
Examples of Predicate Processing
131
Unmapped Internal Dbspaces
192
Impact of CCSIDs on Sargability
131
Mapped Internal Dbspaces
192
Tuning Queries with Several Tables
132
Using Data Spaces with the Directory
193
Methods of Joining Two or More Tables . .
133
Reblocking the Database Directory
193
Nested Loop Join (Type 1)
133
Using Data Spaces Support with a New
Merge Scan Join (Type 2)
134
Database
195
Choosing an Access Method
135
iv Performance Tuning Handbook
Chapter 7. Tuning Performance for
Ordering Data Lines
208
Specification File Example
208
Data Spaces Support
197
Deciding When to Use Data Spaces
197
Advantages
197
Appendix B. Determining Number of
Storage Pool
199
Data Spaces
211
Internal Dbspaces
199
Maximum Number of Data Spaces
211
Directory
200
Logical Mapping
211
Managing Your Working Storage Size
200
Physical Mapping
212
Choosing the Target Working Storage Size.
200
Maximum Total Size
214
Choosing Storage Residence Priorities . .
201
Displaying Current Data Spaces
214
Unmapped Internal Dbspaces
202
Managing Checkpoints
202
Appendix C. Why is the TARGETWS
Choosing the Checkpoint Interval
203
Value Frequently Exceeded?
215
Choosing the Save Interval
203
VMDSS Usage Scenario
215
Using Striping
204
With One Dbextent Per Pool
204
Notices
219
One Dbextent Per Device
204
Dbextent Size
204
Trademarks
221
Number of Dbextents
205
Using Striping with Existing Data
205
Bibliography
223
Choosing Logical or Physical Mapping
205
Real Storage Requirements for Data Spaces .
205
Index
227
Appendix A. Storage Pool
Contacting IBM
239
Specification File Format
207
Product information
239
File Format
207
Data Line Syntax
207
Contents v
About This Manual
Who Should Use This Manual
This manual will help you analyze and tune the performance of the DB2® VSE &
VM product in an IBM VM system or in VSE. It is designed for the person who
designs or customizes any of the following:
v Operating systems that support the DB2 Server for VSE & VM product
v DB2 Server for VSE & VM application servers
v DB2 Server for VSE & VM databases
v DB2 Server for VSE & VM application programs
Organization
Before you can make effective judgements about how to tune the DB2 Server for
VSE & VM product, you need to understand what happens inside each part of the
product. This manual will help you understand:
v How each part of the DB2 Server for VSE & VM product works
v How each of those parts affects performance
v How to tune the performance of each part
v How to monitor how it is performing.
This manual does not provide diagnostic information. (For the symptoms of
common performance problems and potential cures, refer to the DB2 Server for VSE
& VM Diagnosis Guide and Reference manual.)
The chapters of this manual are arranged as follows:
Summary of Changes: Lists the changes made to the product since Version 6
Release 1.
Chapter 1, “Improving Performance”: This is an introduction to the subjects of
performance design and tuning. It discusses the basic process including the
development of goals, strategies and plans.
Chapter 2, “Measuring Performance”: This is an overview of the various tools
available to measure the performance of the application server itself and as a part
of the entire VM or VSE system.
Chapter 3, “Managing Storage and Configuring the Operating System”: This
discusses how to effectively manage physical (DASD) and virtual storage. It also
explains various operating system parameters and how to set them to optimize the
performance of a system that includes a DB2 Server for VSE & VM application
server.
Chapter 4, “Configuring the Application Server and Requester”: This explains the
various subsystems in the application server and requester and how they can affect
performance. It discusses how each initialization parameter governs how each
subsystem operates, and where to look for performance indicators that describe
how well each subsystem is performing.
vii
Chapter 5, “Improving Data Access Performance”: This discusses how to improve
performance by changing either how the data is accessed or by changing the
structure of the data itself. The first method involves analyzing and rewriting SQL
statements, while the second method involves reorganizing data, effectively
managing indexes, and working with database statistics.
Chapter 6, “Data Spaces Support for VM/ESA”: This discusses how to improve the
performance of your application server, by using the Data Spaces facility in
VM/ESA.
Chapter 7, “Tuning Performance for Data Spaces Support”: This discusses the
various tuning actions which can be used to improve Data Spaces Support
performance.
Prerequisite Reading
This manual assumes that you are familiar with at least one of the following IBM
publications:
v DB2 Server for VSE & VM Application Programming
v DB2 Server for VM System Administration
v DB2 Server for VSE System Administration
v DB2 Server for VSE & VM Operation
v DB2 Server for VSE & VM Database Administration
v DB2 Server for VSE & VM Diagnosis Guide and Reference
v DB2 Server for VSE & VM SQL Reference.
It also assumes you are familiar with IBM VM systems, CMS commands, and
EXECs; or VSE, job control language, and CICS®.
Syntax Notation Conventions
Throughout this manual, syntax is described using the structure defined below.
v Read the syntax diagrams from left to right and from top to bottom, following
the path of the line.
The ►►─── symbol indicates the beginning of a statement or command.
The ───► symbol indicates that the statement syntax is continued on the next
line.
The ►─── symbol indicates that a statement is continued from the previous line.
The ───►◄ symbol indicates the end of a statement.
Diagrams of syntactical units that are not complete statements start with the
►─── symbol and end with the ───► symbol.
v Some SQL statements, Interactive SQL (ISQL) commands, or database services
utility (DBS Utility) commands can stand alone. For example:
►► SAVE
►◄
Others must be followed by one or more keywords or variables. For example:
viii Performance Tuning Handbook

►► SET AUTOCOMMIT OFF
►◄
v Keywords may have parameters associated with them which represent
user-supplied names or values. These names or values can be specified as either
constants or as user-defined variables called host_variables (host_variables can only
be used in programs).
►► DROP SYNONYM synonym
►◄
v Keywords appear in either uppercase (for example, SAVE) or mixed case (for
example, CHARacter). All uppercase characters in keywords must be present;
you can omit those in lowercase.
v Parameters appear in lowercase and in italics (for example, synonym).
v If such symbols as punctuation marks, parentheses, or arithmetic operators are
shown, you must use them as indicated by the syntax diagram.
v All items (parameters and keywords) must be separated by one or more blanks.
v Required items appear on the same horizontal line (the main path). For example,
the parameter integer is a required item in the following command:
►► SHOW DBSPACE integer
►◄
This command might appear as:
SHOW DBSPACE 1
v Optional items appear below the main path. For example:
►► CREATE
INDEX
►◄
UNIQUE
This statement could appear as either:
CREATE INDEX
or
CREATE UNIQUE INDEX
v If you can choose from two or more items, they appear vertically in a stack.
If you must choose one of the items, one item appears on the main path. For
example:
►► SHOW LOCK DBSPACE
ALL
►◄
integer
About This Manual ix
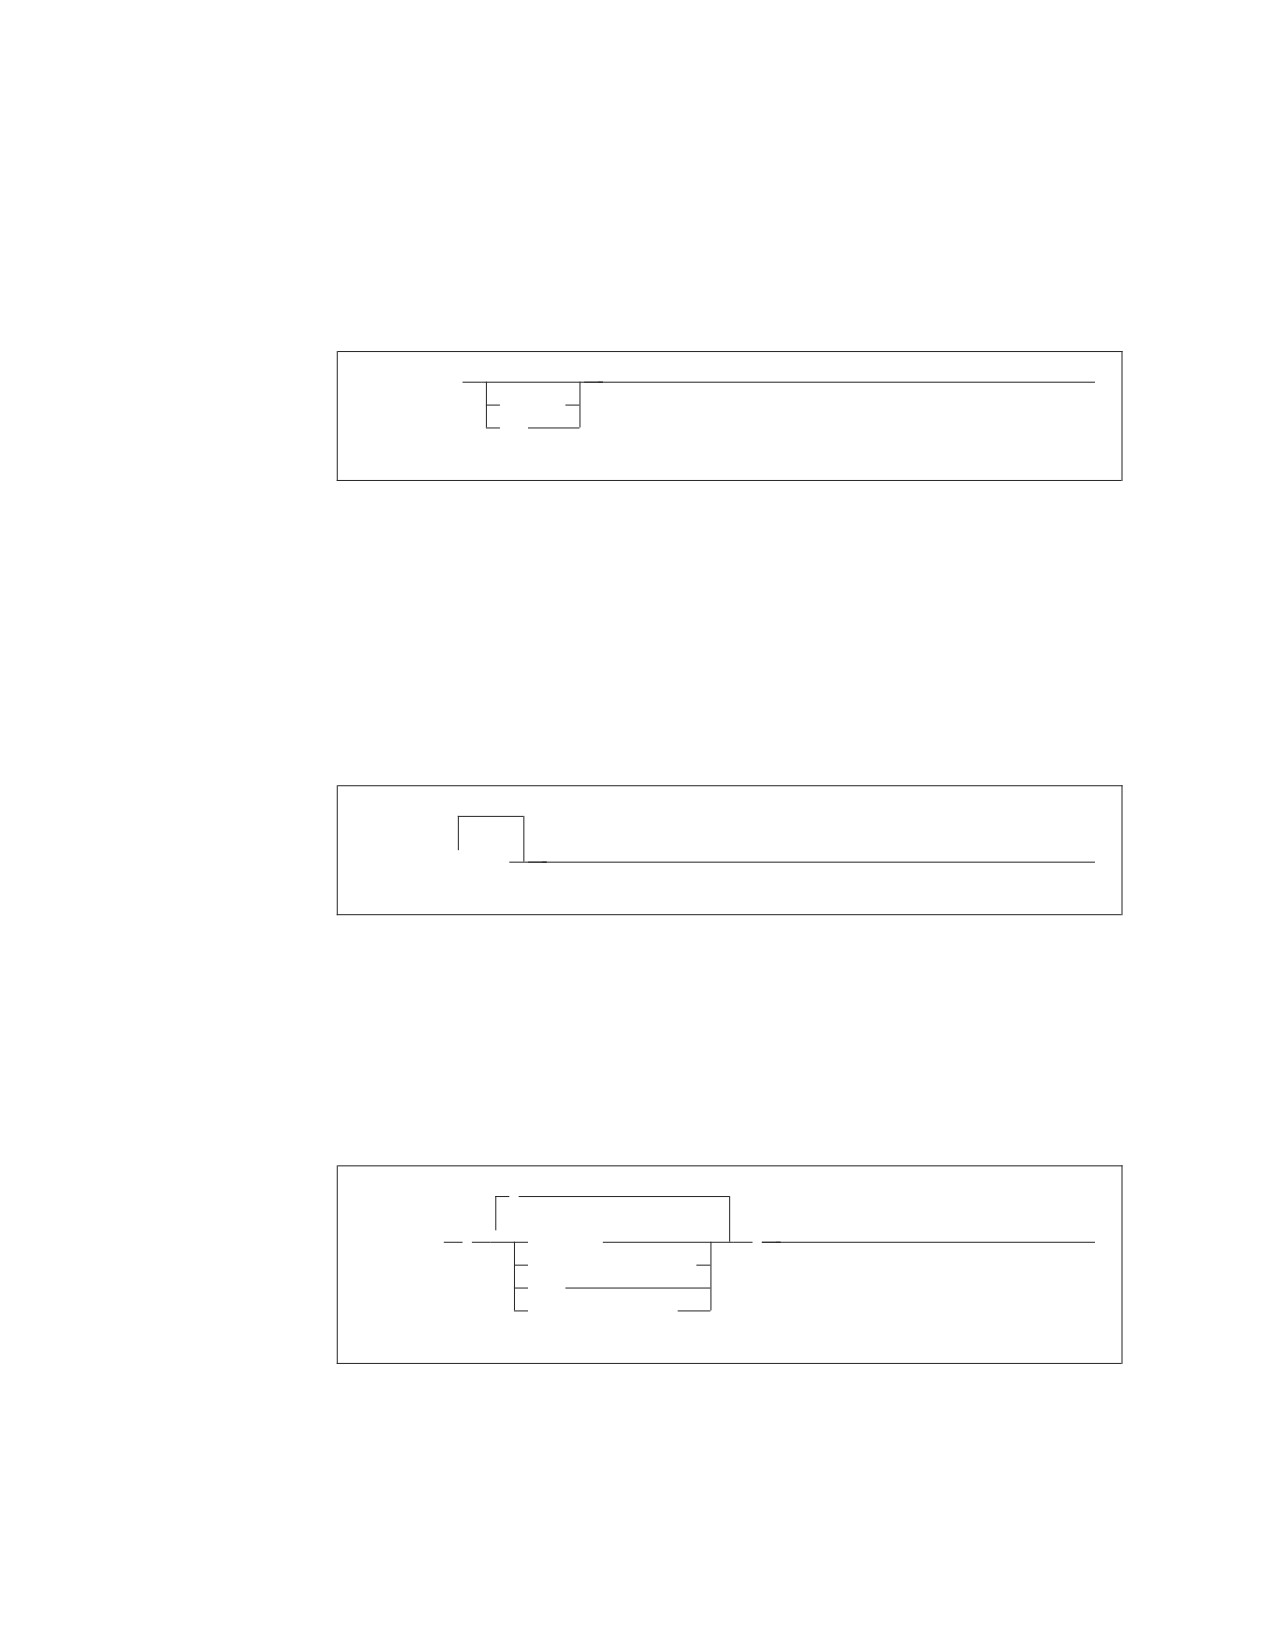
Here, the command could be either:
SHOW LOCK DBSPACE ALL
or
SHOW LOCK DBSPACE 1
If choosing one of the items is optional, the entire stack appears below the main
path. For example:
►► BACKWARD
►◄
integer
MAX
Here, the command could be:
BACKWARD
or
BACKWARD 2
or
BACKWARD MAX
v The repeat symbol indicates that an item can be repeated. For example:
▼
►► ERASE
name
►◄
This statement could appear as:
ERASE NAME1
or
ERASE NAME1 NAME2
A repeat symbol above a stack indicates that you can make more than one
choice from the stacked items, or repeat a choice. For example:
,
▼
►► VALUES
(
constant
)
►◄
host_variable_list
NULL
special_register
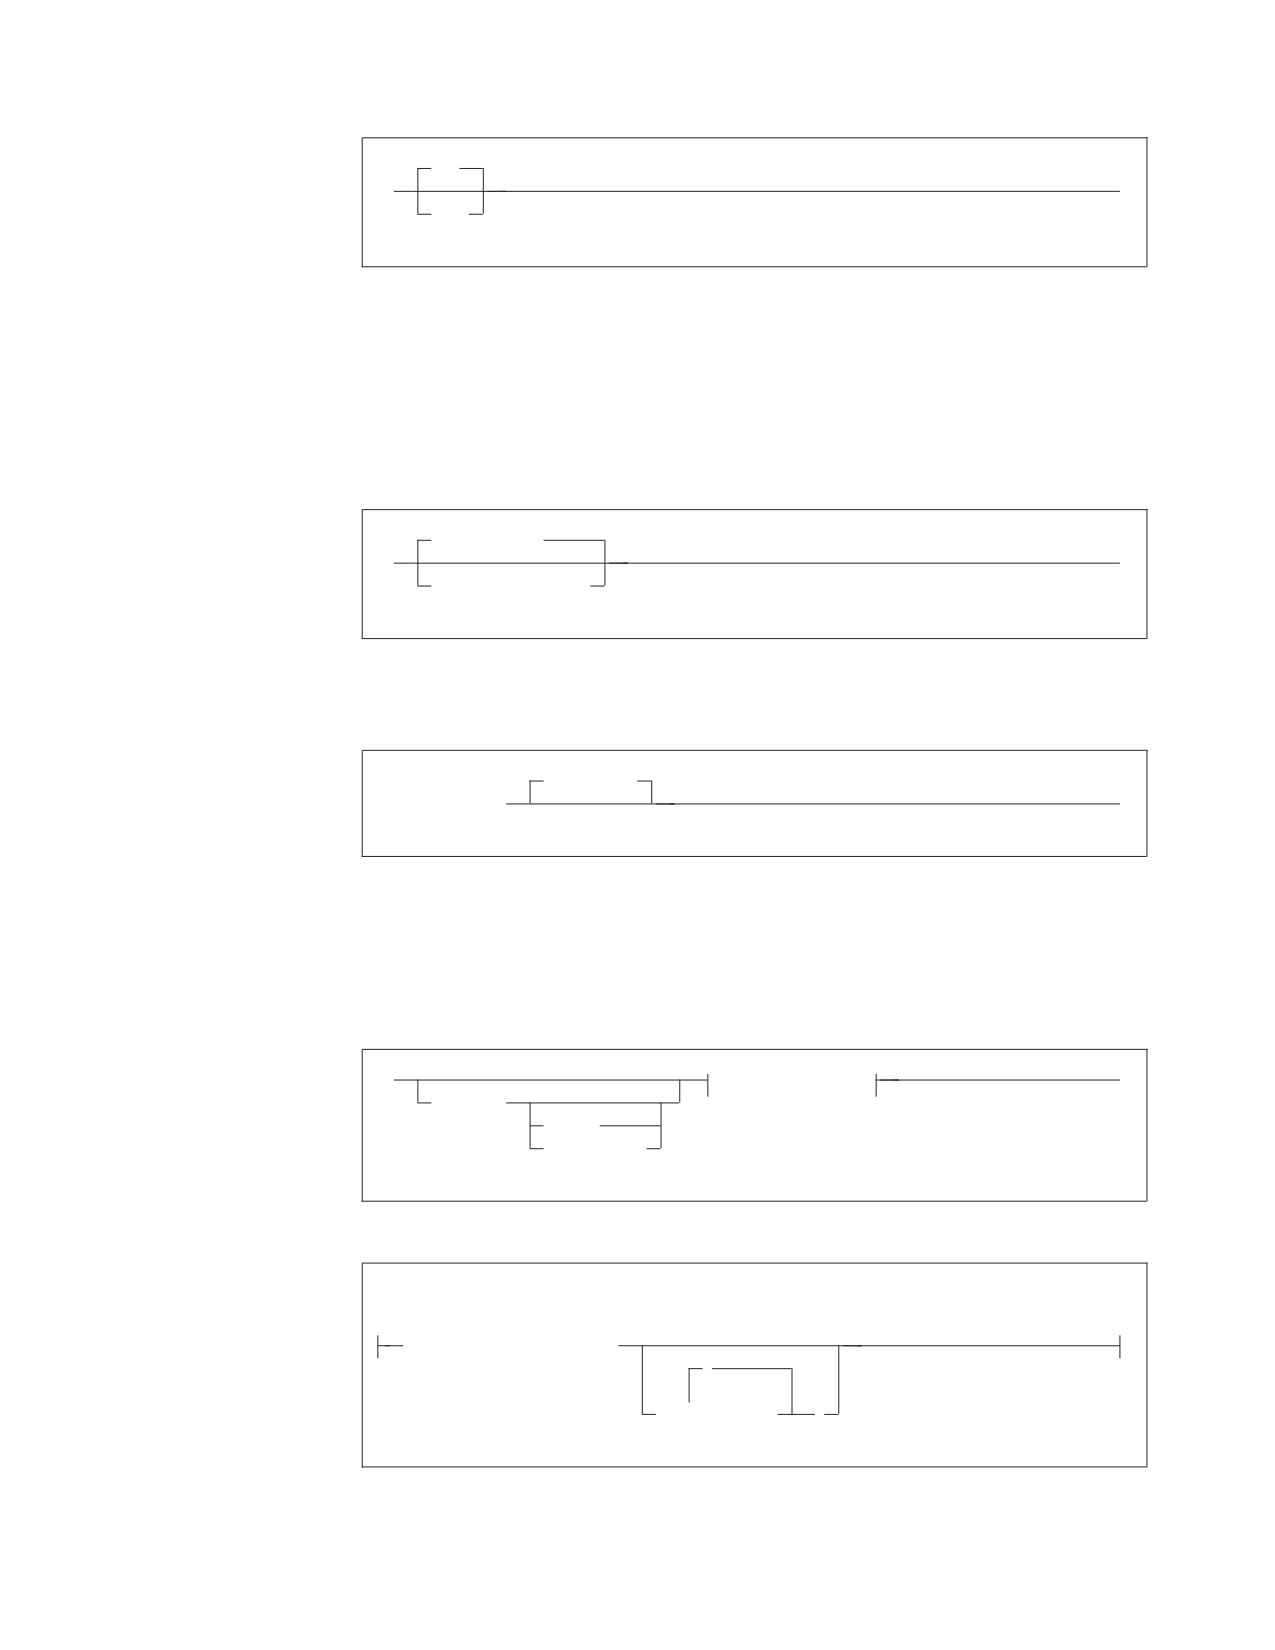
v If an item is above the main line, it represents a default, which means that it will
be used if no other item is specified. In the following example, the ASC keyword
appears above the line in a stack with DESC. If neither of these values is
specified, the command would be processed with option ASC.
x Performance Tuning Handbook
ASC
►►
►◄
DESC
v When an optional keyword is followed on the same path by an optional default
parameter, the default parameter is assumed if the keyword is not entered.
However, if this keyword is entered, one of its associated optional parameters
must also be specified.
In the following example, if you enter the optional keyword PCTFREE =, you
also have to specify one of its associated optional parameters. If you do not
enter PCTFREE =, the database manager will set it to the default value of 10.
PCTFREE = 10
►►
►◄
PCTFREE = integer
v Words that are only used for readability and have no effect on the execution of
the statement are shown as a single uppercase default. For example:
PRIVILEGES
►► REVOKE ALL
►◄
Here, specifying either REVOKE ALL or REVOKE ALL PRIVILEGES means the
same thing.
v Sometimes a single parameter represents a fragment of syntax that is expanded
below. In the following example, fieldproc_block is such a fragment and it is
expanded following the syntax diagram containing it.
►►
fieldproc_block
►◄
NOT NULL
UNIQUE
PRIMARY KEY
fieldproc_block:
FIELDPROC program_name
,
(
▼
constant
)
About This Manual xi
SQL Reserved Words
The following words are reserved in the SQL language. They cannot be used in
SQL statements except for their defined meaning in the SQL syntax or as host
variables, preceded by a colon.
In particular, they cannot be used as names for tables, indexes, columns, views, or
dbspaces unless they are enclosed in double quotation marks (").
ACQUIRE
GRANT
RESOURCE
ADD
GRAPHIC
REVOKE
ALL
GROUP
ROLLBACK
ALTER
ROW
AND
HAVING
RUN
ANY
AS
IDENTIFIED
SCHEDULE
ASC
IN
SELECT
AVG
INDEX
SET
INSERT
SHARE
BETWEEN
INTO
SOME
BY
IS
STATISTICS
STORPOOL
CALL
LIKE
SUM
CHAR
LOCK
SYNONYM
CHARACTER
LONG
COLUMN
TABLE
COMMENT
MAX
TO
COMMIT
MIN
CONCAT
MODE
UNION
CONNECT
UNIQUE
COUNT
NAMED
UPDATE
CREATE
NHEADER
USER
CURRENT
NOT
NULL
VALUES
DBA
VIEW
DBSPACE
OF
DELETE
ON
WHERE
DESC
OPTION
WITH
DISTINCT
OR
WORK
DOUBLE
ORDER
DROP
PACKAGE
EXCLUSIVE
PAGE
EXECUTE
PAGES
EXISTS
PCTFREE
EXPLAIN
PCTINDEX
PRIVATE
FIELDPROC
PRIVILEGES
FOR
PROGRAM
FROM
PUBLIC
Conventions Used for Highlighting Examples
Sample commands and messages are provided throughout this manual. While you
will not see highlighting on your screen, it is included in this manual for emphasis:
v Commands are highlighted using bold type.
v Messages are not highlighted
v Important parts of some messages are emphasized with underlining.
xii Performance Tuning Handbook
For example:
set pool 1 seq
ARI0065I Operator command processing is complete.
show pool 1
POOL NO.
1:
NUMBER OF EXTENTS = 2
DS3 SEQ
EXTENT TOTAL NO. OF
NO. OF
NO. OF
%
NO.
PAGES PAGES USED FREE PAGES RESV PAGES USED
1
855
74
781
8
2
855
47
808
5
TOTAL
1710
121
1589
20
7
ARI0065I Operator command processing is complete.
About This Manual xiii
Summary of Changes
|
This is a summary of the technical changes to the DB2 Server for VSE & VM
|
database management system for this edition of the book. Several manuals are
|
affected by some or all of the changes discussed here. For your convenience, the
|
changes made in this edition are identified in the text by a vertical bar (|) in the
|
left margin. This edition may also include minor corrections and editorial changes
|
that are not identified.
This summary does not list incompatibilities between releases of the DB2 Server
for VSE & VM product; see either the DB2 Server for VSE & VM SQL Reference, DB2
Server for VM System Administration, or the DB2 Server for VSE System
Administration manuals for a discussion of incompatibilities.
Summary of Changes for DB2 Version 7 Release 5
Version 7 Release 5 of the DB2 Server for VSE & VM database management
system is intended to run on the Z/VM Version 5 Release 2 or later environment
and on the Z/VSE(®) Version 3 Release 1 or later environment.
|
Enhancements, New Functions, and New Capabilities
|
The following have been added to DB2 Version 7 Release 5:
|
Explain Option on DBSU REBIND PACKAGE Command
|
This new functionality allows the EXPLAIN(YES/NO) option on REBIND
|
PACKAGE command. If EXPLAIN(YES) is issued, then all four update tables
|
(structure, plan, cost, reference) will be updated. If EXPLAIN(NO) is issued, then
|
none of the four update tables will be updated.
|
For more information, see the following DB2 Server for VSE & VM documentation:
|
v DB2 Server for VSE & VM Database Services Utility
|
v DB2 Server for VSE & VM Performance Tuning Handbook
|
v DB2 Server for VSE & VM Quick Reference
|
v DB2 Server for VSE & VM SQL Reference
|
For Fetch only
|
This new functionality accepts the ″FOR FETCH ONLY″ clause after a cursor select
|
statement. It causes a cursor to become read-only (no UPDATEs or DELETEs are
|
permitted using this cursor). If a read-only cursor is referenced in an UPDATE or
|
DELETE statement, SQLCODE -510 will be issued and the statement is not
|
processed. In addition, under the SBLOCK preprocessor option, ″FOR FETCH
|
ONLY″ forces blocking to be used on the read-only cursor regardless of whether
|
there is a COMMIT. If there is no ″FOR FETCH ONLY″ clause, under SBLOCK,
|
blocking would only be done if a COMMIT was absent.
|
For more information, see the following DB2 Server for VSE & VM documentation:
|
v DB2 Server for VM Messages and Codes
|
v DB2 Server for VSE & VM Application Programming
|
v DB2 Server for VSE & VM Performance Tuning Handbook
|
v DB2 Server for VSE & VM Quick Reference
xv
|
v DB2 Server for VSE & VM SQL Reference
|
Application Message Formatter
|
This functionality provides an Application Programming Interface (API) that
|
retrieves the descriptive text for an SQLCODE, given an SQLCA input parameter.
|
The API will be available for Assembly, COBOL, C, PL/I and FORTRAN.
|
In DB2 for VM and DB2 for VSE Online, the user may specify the language of the
|
returned text. The languages supported by DB2 for VSE/VM are American English
|
(AMENG), uppercase English (UCENG), German (GER), French (FRANC) and
|
Japanese (KANJI). VSE Batch does not support switching to another language.
|
Therefore the default will be used regardless of the user’s specification. The values
|
of SQLCODE, SQLSTATE, SQLERRD1 and SQLERRD2 will be automatically
|
appended to the returned text. The user may also specify to have the entire
|
SQLCA included. If the SQLCODE could not be found in the repository, the entire
|
SQLCA will be returned in the buffer.
|
If the SQLCA was set by another product (such as DB2 UBD), the descriptive text
|
is retrieved if the SQLCODE exists in the DB2 for VM/VSE repositories. However,
|
the token substitutions may not be correct.
|
For more information, see DB2 Server for VSE & VM Application Programming.
|
Convert buffer read/write to compiler macro
|
The DRDA code has over 100 small modules. Each call to an external module has a
|
certain amount of overhead associated with it. Certain modules are called very
|
frequently and this can add up to a significant amount of time. This functionality
|
improves the performance by converting few modules to macros or internal
|
procedures, to reduce this overhead.
|
Modify Build Tree Creation
|
This functionality modifies Build Tree creation used by DRDA parsing and
|
generation. It is built in such a way that every code point that is used to search
|
through the tree must be converted to a different format before the search can be
|
done. If modified build tree was created with the converted point, then the code
|
point would not have to be converted every time the tree must be searched. This
|
improves the performance of the DRDA code path length with the minimal search.
|
Split code point search routines
|
When parsing a data stream within each parser action routine, a binary search is
|
done to find the specific code point. Some action specific routines are quite large,
|
so the binary search can be long. Splitting and spreading the code point evenly
|
among other modules would reduce the overheads and improves the performance
|
of the DRDA code path length.
|
DRDA Multi-Row Insert
|
Multi Row insert is a means of caching homogenous insert statements and sending
|
them as a block to the server for processing. This reduces the overhead of sending
|
a large number of singular inserts and receiving as many responses.
|
Buffering of homogenous inserts eliminates the need to send an SQL statement to
|
the DB2 server every time an insert is made, thereby improving performance over
|
DRDA.
|
For more information, see the following DB2 Server for VSE & VM documentation:
|
v DB2 Server for VSE & VM Application Programming
xvi
Performance Tuning Handbook
|
v DB2 Server for VSE & VM Database Administration
|
v DB2 Server for VM System Administration
|
v DB2 Server for VSE & VM Performance Tuning Handbook
|
v DB2 Server for VSE & VM Quick Reference
|
v DB2 Server for VSE & VM SQL Reference
|
Connection Pooling for DRDA TCP/IP in Online Resource
|
Adapter
|
Connection pooling is a technique that allows multiple users to share a cached set
|
of pre-established connections that provide access to a database. Establishing a
|
connection between a user and a server takes a sizeable time. Users who have
|
validated their entry to a database once need not establish a connection every time
|
a request is submitted. Instead, they can use a pre-established connection from a
|
pool of such connections and get their results much faster.
|
From the user’s point of view, there is a considerable improvement in response
|
time after this line item is implemented.
|
For more information, see the following documentation on DB2 Server for VSE &
|
VM:
|
v DB2 Server for VSE System Administration
|
v DB2 Server for VSE & VM Application Programming
|
v DB2 Server for VSE & VM Operation
|
v DB2 Server for VSE & VM Performance Tuning Handbook
|
IBM DB2 Server for VSE, Client Edition
|
This feature allows the customer the flexibility to install and use only the client
|
(run-time support) component of DB2 Server for VSE without the requirement to
|
buy and install the server component during the installation process of DB2 server
|
for VSE product. The client-only installation enables customers to reduce the total
|
cost of ownership when they have their databases residing on a non-local platform
|
(like VM, z/OS, LUW) and have a large number of their DB2 applications on VSE
|
(like ISQL on CICS, DBSU on VSE, other online/batch applications on VSE).
|
For more information, see the following DB2 Server for VSE & VM documentation:
|
v DB2 Server for VSE System Administration
|
v DB2 Server for VSE Program Directory
|
IBM DB2 Server for VM, Client Edition
|
This feature allows the customer the flexibility to install and use only the client
|
(run-time support) component of DB2 Server for VM without the requirement to
|
buy and install the server component during the installation process of DB2 server
|
for VM product. The client-only installation enables our customers to reduce the
|
total cost of ownership when they have their databases residing on a non-local
|
platform (like VM, z/OS, LUW) and have a large number of their DB2 applications
|
on VM (like ISQL, DBSU, other user applications on VM).
|
For more information, see the following DB2 Server for VSE & VM documentation:
|
v DB2 Server for VM System Administration
|
v DB2 Server for VM Program Directory
Summary of Changes xvii
|
Handling Commit Responses from DB2 UDB Stored Procedures
|
This feature will allow DB2 Resource Manager on VSE/VM to accept and process
|
results of a stored procedure running in a UDB server with a COMMIT statement
|
in the stored procedure.
|
Currently, DB2 for VM/VSE client does not handle responses from ’COMMIT’
|
statements coded in DB2 UDB stored procedures. Implementation of this feature
|
will enable handling responses of COMMIT statements in DB2 UDB stored
|
procedures and thus allow users to have COMMIT statements in their stored
|
procedures, while using DB2 for VM/VSE client.
|
COMMIT statements, however, are not allowed in stored procedures on the DB2
|
Server for VM/VSE.
|
For more information, see DB2 Server for VSE & VM Application Programming.
|
Make on-line programs AMODE 31 RMODE ANY
|
This feature converts DB2 server for VSE online program which presently operate
|
under 24 bit addressing mode from AMODE 24, to AMODE 31 RMODE ANY.
|
Presently, all the online programs are loaded below 16M line. Implementation of
|
this line item ensures that all the online program will be loaded above the 16M
|
line, which results in more virtual storage below the line, which can be utilized by
|
other applications.
|
For more information, see the following DB2 Server for VSE & VM documentation:
|
v DB2 Server for VSE System Administration
|
v DB2 Server for VSE Program Directory
|
Provide BIND File Support in VM and in VSE Batch Environments
|
This feature provides the facility of binding packages across servers. The process of
|
binding is achieved by dividing the program preparation method into two steps.
|
The first step does the precompilation of the embedded SQL programs with the
|
prep parameter ’BIND’. Invocation of VSE/VM preprocessor creates a ’bindfile’.
|
The bindfile can be bound against any DB2 server using VSE/VM binder. During
|
this process, the access path is generated, SQL statements are verified,
|
authorization checks are performed, and package on the target server is created.
|
This line item eliminates the need of re-prepping the source code or porting of
|
packages across DB2 servers.
|
For more information, see the following DB2 Server for VSE & VM documentation:
|
v DB2 REXX SQL for VM/ESA Installation and Reference
|
v DB2 Server for VM Messages and Codes
|
v DB2 Server for VSE & VM Application Programming
|
v DB2 Server for VSE & VM Database Administration
|
v DB2 Server for VM Program Directory
|
v DB2 Server for VSE Program Directory
|
Convert TCP/IP LE/C interface to EZASMI API
|
The feature of converting TCP/IP LE/C interface to EZASMI API intends to
|
replace the current LE/C interface and implement the EZA Assembler Interface
|
(EZASMI)to enhance performance in DB2 Client/Server for VSE over DRDA.
|
Currently, either LE/C interface or CSI Assembler Interface is used for TCP/IP
|
functions. The EZASMI interface makes the code all Assembler.
xviii Performance Tuning Handbook
|
For more information, see DB2 Server for VSE Program Directory
Summary of Changes xix
xx Performance Tuning Handbook
Chapter 1. Improving Performance
Elements of Performance
Performance is the way a computer system behaves given a particular workload. It
can be measured through the system’s response time, throughput, and availability;
and it is affected by:
v The resources available
v How well they are used and shared
In general, you should undertake performance tuning when you want to improve
the cost-benefit ratio of your system. Specific goals would be:
v To process a larger or more demanding work load without increasing processing
costs. (For example, without buying new hardware or using more processor
time.)
v To obtain faster system response or higher throughput without increasing
processing costs.
v To reduce processing costs without affecting service to your users.
Translating performance from technical terms to economic terms is difficult.
Performance tuning certainly costs money (through people’s time and through
processor time), so before you undertake a tuning project, weigh its costs against
its possible benefits. Some of these benefits are tangible, such as more efficient use
of resources and the ability to add more users to the system, others such as greater
user satisfaction because of quicker response time, are intangible. All of these
benefits must be considered.
Tuning Guidelines
The following guidelines should help you develop an overall approach to
performance tuning.
Remember the Law of Diminishing Returns: Your greatest performance benefits
usually come from your initial efforts. Further changes generally produce smaller
and smaller benefits and require more and more effort.
Do Not Tune Just for the Sake of Tuning: Tune to relieve identified constraints. If
you tune resources that are not the primary cause of performance problems, this
has little or no effect on response time until you have relieved the major
constraints, and it can actually make subsequent tuning work more difficult. If
there is any significant improvement potential, it lies in improving the performance
of the resources that are major factors in the response time.
Consider the Whole System: You can never tune one parameter or system in
isolation. Before you make any adjustments, consider how it will affect the system
as a whole.
Change one Parameter at a Time: Do not change more than one performance
tuning parameter at a time. Even if you are sure that all the changes will be
beneficial, you will have no way of evaluating how much each change contributed.
You also cannot effectively judge the trade-off you have made by changing each
parameter. Every time you adjust a parameter to improve one area, you almost
always affect at least one other area.
1
Measure and Reconfigure by Levels: For the same reasons that you should only
change one parameter at a time, tune one level of your system at a time. You can
use the following list as a guide:
v Hardware
v Operating System (VM or VSE)
v CICS (for VSE)
v Application Server and Requester
v Database
v SQL Statement
v Application Program
Check for Hardware and Software Problems: Some performance problems may be
corrected by applying service, either to your hardware, through an engineering
change (EC) or microcode assists, or to your software through a program
temporary fix (PTF). Do not spend excessive time monitoring and tuning your
system, when simply applying service may make it unnecessary.
Understand the Problem Before you Upgrade your Hardware: Even if it seems
that additional storage or processor power could immediately improve
performance, take the time to understand where your bottlenecks are. You may
spend the money on additional DASD only to find that you do not have the
processing power or the channels to exploit it.
Put Fallback Procedures in Place Before You Start Tuning: As noted earlier, some
tuning can cause unexpected performance results. If this leads to poorer
performance, it should be reversed and alternative tuning tried. If the former setup
is saved in such a manner that it can be recalled, the backing out of the incorrect
change becomes much simpler.
Performance Improvement Process
Use the following process to improve the performance of any system:
1. Establish performance indicators.
2. Define performance objectives.
3. Develop a performance monitoring plan.
4. Carry out the plan.
5. Analyze your measurements to determine whether you have met your
objectives. If you have, consider reducing the number of measurements you
make. Performance monitoring itself uses system resources. Otherwise continue
with Step 6.
6. Determine the major constraints in the system.
7. Decide where you can afford to make trade-offs and which resources can bear
an additional load. (Nearly all tuning involves trade-offs among system
resources and the various elements of performance.)
8. Adjust the configuration of your system. If you think that it is feasible to
change more than one tuning option, implement one at a time. If there are no
options left at any level, you have reached the limits of your resources and
need to upgrade your hardware.
9. Return to Step 4 above and continue to monitor your system.
Periodically, or after significant changes to your system or workload:
v Return to Step 1 above
2
Performance Tuning Handbook
v Reexamine your objectives and indicators
v Refine your monitoring and tuning strategy.
How Much Can a System be Tuned?
There are limits to how much you can improve the efficiency of a system. Consider
how much time and money you should spend on improving system performance,
and how much the spending of additional time and money will help the users of
the system.
Your system may perform adequately without any tuning at all, but it probably
will not perform to its potential. Unfortunately using the default tuning parameters
is usually not a good solution. Each database is unique. As soon as you develop
your own database, and applications to use it, investigate the tuning parameters
available and learn how you can customize their settings to reflect your situation.
In some circumstances, there will only be a small benefit from tuning a system,
however in most, the benefit may be significant.
As your system approaches a performance bottleneck, it is more likely that tuning
will be effective. If you are close to this and you increase the number of users on
the system by, say, 10 percent, the response time is likely to rise by much more
than 10 percent. However, there is a point beyond which tuning cannot help you.
At that point, the only thing to do (other than adding new hardware) is to change
your objectives.
Workload
When devising a strategy to improve performance, you need to consider the
workload in two environments: test, and production. Ideally you should have
access to both, but often tuning must be done without the benefit of a test system.
Test Workload: In a test environment you can use strictly defined workloads to
model how changes to performance parameters may affect your production
system. Consider modeling your production system with a small subset of
transactions from it. By running a wide variety of SQL statements from different
applications you can create a rough sketch of your system. While it may not
perform exactly the way the production system will, it can help you discover
unexpected effects before they occur in production.
Production Workload: In contrast, you probably do not have a great deal of
control over the size and nature of the workload in your production
environment—you can measure it, looking for maximums, minimums, averages,
and variances over time, but it is almost impossible to accurately predict exactly
what it will be. Instead look for trends that can help you predict future capacity
requirements. For example, will you need to buy hardware or invest in additional
performance tuning to support a rapidly growing workload.
Performance Indicators
The first rule of control engineering is:
If you cannot measure it, you cannot control it .
When you set your performance objectives, take a practical look at what you can
measure. While you may want to establish a high-level throughput objective of,
say, “55 transactions per second” there may not be an easy way to measure this.
Chapter 1. Improving Performance
3
Instead, consider using an indicator that is readily available. For example, the
BEGINLUW counter records how may logical units of work (LUWs) started during
the last monitoring period. While this does not actually represent the number of
transactions per second, it does act as a rough indicator of throughput.
Establishing Performance Objectives
How you define good performance depends on your particular needs and
priorities. Performance objectives should be realistic, in line with your budget,
understandable, and measurable.
Response Time
Response time represents the elapsed time between when a user submits an SQL
request to a server (usually through an application program), and when the
response arrives on the user’s screen. It can also represent the elapsed time
required to respond to an SQL request submitted from a batch application
program.
The easiest response time objective to state is a maximum time, such as, “SQL
queries will return in under 2 seconds”. However, response times can vary for
many reasons. So, include acceptable tolerances in your targets. For example, “SQL
queries will return in under 2 seconds 80% of the time”. This allows for unusual
transactions that have exceptionally heavy processing or database access
requirements.
Components of Response Time
Response time for any database transaction has three components. The SQL
statement is generated in an application program; it travels through a network to
an application server; and finally, the server generates a response, which is
returned to the program through the network.
Application server response time represents the time it takes for the server to
interpret your request and retrieve or update data. This can be affected not only by
how well your database and SQL statements are designed, but also by how well
the server’s initialization parameters are tuned.
Network response time represents the communication delay between the
application program and the application server. It also represents any delay
between a user’s terminal and the application program. This usually does not
represent a large part of overall response time, unless your server and application
program are physically separated by large distances.
Application program response time can often be the fastest part of the process,
but do not overlook it. Some programs can take more time to process data than
was required to retrieve this data from the server. For example, if you retrieve
floating-point data that needs to be displayed in scientific notation, your program
may take longer to perform the conversion than it took for the server to generate
the answer set. Therefore, do not assume that if you double the speed of your
server, your end users will see their response time cut in half.
You can also use a stored procedure (user-written application program that is
compiled and stored at the server) to eliminate many of the network send and
receive operations, and thereby reduce network cost of distributed database access.
For more information on stored procedures, see the DB2 Server for VSE & VM
Database Administration manual.
4
Performance Tuning Handbook
Throughput
Throughput measures the amount of work processed over a period of time (refer to
“Workload” on page 3). You can measure it either in a controlled test system or in
a production system.
In a test system you are able to define representative workloads and measure how
many of these transactions your system can complete per unit of time. For
example, you can measure the number of transactions per second.
In a production environment, look for measurements that are effective as averages
over time that will give you a rough indicator of throughput of your overall
system, such as BEGINLUW. Also look at the throughput of your various
subsystems — for example, the pages processed per second by your DASD I/O
system.
Availability
Availability is a measure of the proportion of time a system or resource is ready
when it is required.
It is usually measured in hours, weeks, or months. For example, you may want to
set an objective of 8 hours downtime (time when your server is unavailable) per
month, based on a 24-hour day. Downtime is not necessarily caused by a
malfunction. You may need to shut the application server down to apply service or
perform maintenance.
A Less Formal Approach
If you do not have enough time to set performance objectives and to monitor and
tune in a comprehensive manner, you can address performance by listening to
your users. Find out if they are having performance-related problems. You can
usually locate the problem, or at least where to start, by asking a few simple
questions. For example:
v What do you mean by “slow response”? Is it 10% slower than you expect it to
be, or tens of times slower?
v When did you notice the problem? Is it recent or has it always been there?
v How many users are complaining? Is it just one or two individuals, or a whole
group?
v If a whole group of users are experiencing difficulties, are they connected to the
same terminal controller?
v Are the problems related to a specific transaction or application program?
v Do the problems appear during regular periods, such as lunch hour, or are they
continuous?
Monitoring Performance
Performance monitoring can help you understand how the various parts of your
overall computer system are working. There are two types:
Real time
You can monitor the immediate state of your system to solve problems
such as locking contention or storage shortages.
Chapter 1. Improving Performance
5
Statistical
You can also monitor the performance of a system over a period of time to
help you tune the parameters of the system or plan for future capacity
requirements.
Creating a Monitoring Plan
You need to plan how you will monitor your system and how you will analyze the
data that results. When you create your plan, do the following:
v Create a master schedule of monitoring. Large batch jobs or maintenance runs
can cause peaks in activity. Coordinate monitoring with other operations so that
they do not conflict with unusual peaks, unless that is what you want to
monitor.
v Determine the kinds of analysis that you will perform and the tools that you
will use. Document the data that you will extract from each monitoring tool.
Some of these tools provide reports that help to organize data, but in addition
you should create worksheets or utility programs to help you extract and
organize the performance indicators specific to your system.
v Create a list of people who should review the results of your monitoring. These
results should be summarized and shared with everyone involved with your
system. Consider including application programmers, operators, and your end
users.
v Determine standards and criteria for implementing changes in system
parameters and workload. Describe how often you will permit changes, and
outline a strategy to monitor their effects.
Monitoring Interval
An important factor affecting the accuracy of your performance measurements is
the monitoring interval. Most useful performance values, whether measured
directly or calculated from other measures, are averages over time.
If the interval that you use to calculate this average is too long, you may lose
significant values. For example, you would not see a 10-minute peak in DASD
paging load or a 10-minute drop in the effective use of the local buffers if you only
look at your performance indicators once a day.
If the interval is too short, your results may not be statistically valid. For example,
if one checkpoint occurred during one 30-minute interval, you could not
confidently say that the database manager was performing two checkpoints per
hour.
Cost of Monitoring
You need to weigh the benefits of making performance measurements against the
additional overhead involved. While recording performance numbers every 10
seconds may give you an excellent picture of how your database manager is
working, the additional load on the operating system may reduce your overall
performance, or consume large amounts of DASD space.
Measurements
Performance measurements are relative: they tell how a system behaves for a
particular workload. A system is considered to perform well if it can complete a
particular workload faster than other systems or with fewer resources.
6
Performance Tuning Handbook
In a test system, you can control the workload by running the same tasks many
times. During each iteration you can measure how fast your system completed the
tasks and how much resource it used.
However, in a production system it is difficult to compare measurements taken at
different times, because the workload is constantly changing. To obtain a
performance measurement, you must compare the average performance of your
system measured over a period of time to the workload it processed during that
time. To make these comparisons, you need to calculate two types of relative
measurements: load and performance.
Load is usually measured as a rate, in tasks per unit of time. These measurements
help you determine the amount of work that the database manager or the
operating system is performing during a period of time. High load values in some
areas and low load in others may suggest a bottleneck in the system. Also, while
similar load measurements do not guarantee that two workloads are comparable,
different ones show that they are not comparable.
Performance can be measured as a percentage from 0% to 100%, where 100% is
optimal. For practical reasons it is often calculated by comparing the number of
successes compared to the number of attempts. For example, if the database
manager looks in the local buffers for a page 100 times, and finds the page it is
looking for 75 times, the local buffers are 75% effective. This measurement helps
you estimate how effectively various components of the entire system are
performing.
The percentage can be calculated in several ways:
Success
Attempt - Failure
Failure
X
100
=
X
100
=
1 -
X
100
Attempt
Attempt
Attempt
You can also express a performance measurement as a hit ratio, with the following
calculation:
In this case, the higher the ratio the better the performance. The lowest value for a
hit ratio is 1.
Use the formula that makes the most “sense” to you. Some formulas fit some
measurements better or are easier to understand than others. Mathematically, they
are all equivalent.
Tools
A wide range of tools for monitoring performance is available in both VM and in
VSE. Each tool covers a particular area or a different level of the overall system.
VM Tools
The CP Monitor subsystem measures the performance of the VM operating system
and its resources and the VM/Performance Reporting Facility (VM/PRF) product
creates usage and historical reports from those measurements. You can control the
Chapter 1. Improving Performance
7
amount and nature of the data collection, based on the analysis you want to do. To
create reports from the collected data, you must either do some programming, or
you can use VM/PRF to produce standard reports. This facility contains reports
helpful in monitoring the overall DASD I/O performance of your database. The
CP Monitor subsystem is included with the VM system. VM/PRF is available from
IBM.
The CP INDICATE USER and QUERY TIME commands measure the resources
consumed by your database virtual machine. Includes measurements of system
paging use, database manager DASD I/O, and CPU load. Included with VM as a
part of CP. (Refer to page 15.)
The Real Time Monitor VM/ESA (RTM VM/ESA) provides on-line performance
monitoring. Data is typically gathered in short intervals, usually one to three
minutes.
You can use this tool to capture system level data about your system and the
database machine. It is available from IBM.
VSE Tools
The VSE Interactive Interface contains information about CPU use, system paging,
active users, channel and device activity, storage layout, and system activity. Each
is presented in a separate dialog. It is included with VSE. Refer to the DB2 Server
for VSE & VM Operation manual.
VSAM LISTCAT provides information on the location of VSAM data sets. It is
provided with VSE. (Refer to the DB2 Server for VSE & VM Operation manual.)
CICS Tools
The CICS Monitoring Facility measures the performance of CICS under VSE and
CICSPARS/VSE creates historical reports. Both are available from IBM. (Refer to
page 17.)
The CIRD transaction displays a snapshot of the links between CICS and your
application server. It is provided with the DB2 Server for VSE & VM base product.
(Refer to page 21.)
The CICS statistics facility gathers statistical data on CICS performance. It is
provided with CICS. (Refer to the CICS/VSE Performance Guide manual.)
DB2 Server for VSE & VM Tools
As well as the tools described below, the DB2 Family Solutions Directory manual
contains descriptions and ordering information for a wide variety of performance
monitoring and tuning tools. These tools are available from a number of
companies including IBM and are included under the section heading “Database
Administration Tools”.
Whenever the application server starts, it displays how its Initialization
Parameters are set. These parameters describe how the server has been configured.
It is included with the DB2 Server for VSE & VM base product. (Refer to page 20.)
The DB2 Server for VSE & VM system catalog contains information about the
dbspaces, tables, indexes, keys, packages, authorities, and other objects in the
database. Much of the information is used by the database manager when it
8
Performance Tuning Handbook
decides how to retrieve data from the database. It is included with the DB2 Server
for VSE & VM base product. (Refer to page 38.)
The SHOW operator commands are available which display the status of the
application server. For example, user activity, locking, log usage, and storage can
all be monitored with these commands. It is included with the DB2 Server for VSE
& VM base product. (Refer to page 25.)
The COUNTER operator command measures the performance of your application
server by recording how often significant events occur in the database manager.
These events relate to workload, locking, and database manager storage (buffer
pools). It is included with the DB2 Server for VSE & VM base product. (Refer to
page 22.)
IBM DB2 Control Center for VSE & VM automates DBA functions such as
archiving, recovery, adding dbextents, deleting dbextents, adding dbspaces, startup,
shutdown, startup parameter changing, dbspace reorganizations, catalog index
reorganizations, and database monitoring. Any of these functions may be initiated
immediately by an automated user (local or remote), or they may be scheduled to
execute at any specified date and time, or repetitive execution interval. It is
available from IBM.
The DB2 Server for VSE & VM accounting facility records how much CPU time is
consumed and how many buffer pool looks were done during the time that a user
is signed onto the application server. The DB2 Server for VSE & VM trace facility
records the sequence of events that occur in different components of the database
manager (for example, you could trace the sequence of locks that lead up to a
deadlock). While both these tools can be extremely useful in diagnosing
performance problems, use them very sparingly. Both consume a great deal of
system resources and can actually severely affect overall performance when they
have been turned on. For more information on the accounting facility, refer to the
DB2 Server for VSE System Administration or the DB2 Server for VM System
Administration manuals. For more information on the trace facility, refer to the DB2
Server for VSE & VM Operation manual.
The DB2 Server DSS SHOW TARGETWS operator command measures the
amount of main and expanded storage your database machine is currently using. It
is included with the DB2 Server DSS Feature. (Refer to the DB2 Server for VSE &
VM Operation manual.)
The DB2 Server DSS COUNTER POOL operator command measures the
performance of individual storage pools, internal dbspaces and the directory. It is
included with the DB2 Server DSS Feature. (Refer to the DB2 Server for VSE & VM
Operation manual.)
Factors Affecting Performance
Resources
Processor
The processor (sometimes referred to as the CPU) is generally the most expensive
resource in a system. As such, they should be used as efficiently and fully as
possible. In a highly-utilized, well-tuned system, the processor is in use at least
80% of the time. If yours is already above that level, you must either upgrade your
processor or find a more efficient way to do the job. For example, rewrite your
Chapter 1. Improving Performance
9
application program, or investigate the structure of your data or SQL statements.
Refer to Chapter 5, “Improving Data Access Performance,” on page 117.
Storage
Real and Virtual Storage: Your system’s performance is directly affected by how
well the database manager and your operating system share a common pool of
storage between different processes.
For example, agent structures, buffer pools, locks, and packages all require storage.
In general, the more storage allocated to a specific component, the faster it will
perform (within limits). However, you can only allocate storage from the limited
amount available in your database machine or partition. You need to trade-off the
requirements of each component in order to balance the entire system.
For example, if DASD I/O is a performance bottleneck during regular operation
and locking is not, consider using less storage for locks and more for the DASD
buffer pools. For more information, refer to “Real and Virtual Storage” on page 43.
(This is a good example of how performance issues interrelate. By increasing the
number of buffers in the pool you decrease your DASD I/O during regular
operation, but increase it during checkpoint processing. If checkpoint processing
was a problem you have just made it worse. Refer to “Choosing the Checkpoint
Interval” on page 104.)
The DASD I/O System: The database manager moves data to and from DASD as
required. How efficiently it does that has a significant impact on the overall
performance of your application server. How much real storage is available, the
size of the buffer pools, and how often a checkpoint is performed all determine
how often the database manager needs to move data between itself and DASD.
You can also improve the performance of the DASD I/O subsystem by using
DASD caching, Virtual Disks (see “Virtual Disk Support for VSE/ESA for Internal
Dbspaces” on page 48 or “Virtual Disk Support for VM/ESA for Internal
Dbspaces” on page 54), or the DB2 DSS Support (see Chapter 6, “Data Spaces
Support for VM/ESA,” on page 157).
DASD Storage: How you manage DASD storage affects performance in four
ways:
Dividing DASD
How you divide a limited amount of storage between indexes and data,
and among dbspaces and among storage pools determines to a large
degree how each will perform in different situations.
Wasting DASD
Wasted storage in itself may not affect the performance of the system that
is using it, but it may represent a resource that could be used to improve
performance elsewhere.
Distributing DASD I/O
How well you balance the demand for DASD I/O across multiple DASD
devices, controllers and channels can affect how fast the database manager
can retrieve information from DASD, refer to “DASD Balancing” on page
75.
Running out of DASD
While running out of storage can disrupt your users and you are forced to
bring down the application server to add storage, just getting close can
10
Performance Tuning Handbook
degrade performance. (If you reach the application server’s short on
storage level you trigger unnecessary SOSLEVEL checkpoints, refer to
“Short on Storage Cushion” on page 59.)
For more information, refer to “DASD Storage” on page 58.
Overhead
Concurrency
The database manager uses agents and pseudo agents to allow concurrent use of
its resources. It uses agent structures to divide processor time between multiple
users and its own internal tasks, such as checkpoint processing and operator
commands. The number of agents available, combined with how the agents are
scheduled and dispatched can affect the overall performance of your system. For
more information, refer to “Concurrency” on page 88.
Your operating system must also divide processor time among multiple
applications (your application server being one). If the operating system favors
your server and gives it more than its even share of time, your server may perform
well, but at the expense of other applications. For VM, refer to “Fair Share
Scheduling” on page 78. For VSE, refer to “Dispatching Priority” on page 79.
Locking
In multiple user mode (MUM), several agents may need to access the same data at
the same time. This poses a problem if one agent tries to change data while
another agent is still looking at it.
Consider two application programs, each trying to add ten dollars to the same
account at the same time. Both programs read the account balance at the same
time. They both see 100 dollars in the account. The first program updates the value
in the account with 110 dollars, the second program does likewise. The problem is
that when both programs are finished there is only 110 dollars in the account
instead of 120.
To avoid this problem, the database manager can lock the account as soon as the
first program looks at it and hold the lock until the program is finished updating
the balance. The second program waits until the first is complete.
Performance Implications: Of course while locking protects your data, there is a
performance cost. Not only can waiting for locks increase response time (locks can
last to the end of a logical unit of work), but each lock requires additional storage
and processing time. Refer to “Locking Contention” on page 94.
Also, because there are a set number of potential locks defined at initialization
time, you may run out. You may need more than were originally defined. If this
happens, locks will be escalated, (refer to “Lock Escalation” on page 99) a process
that requires additional storage and processor time.
Deadlocks (refer to “Deadlock” on page 101) can also be a problem. While the
database manager detects deadlocks before they occur, the more potential deadlock
situations that you create the more resources are required to avoid them.
Recovery
Maintaining the integrity of your data means preventing its accidental or
intentional destruction, alteration, or loss. If your data is ever affected, there are
three systems to ensure that you can recover it.
Chapter 1. Improving Performance
11
Checkpoint Processing
A checkpoint ensures that any modifications to your database, which are
temporarily stored in main storage, are written to DASD. This ensures that
the integrity of your database is protected even if your application server
crashes, refer to “Checkpoints” on page 103.
Logging
A log is a file maintained on DASD that records the old and new values
each time a change is made in your database. If you lose any changes
because of a system failure, you can use the log to undo or redo the
changes and restore the data to its original state.
Archiving
A database archive is a copy of the entire database. A log archive is an
archive, or series of archives of the log. In the case of a serious failure you
can restore the database archive, and instruct the database manager to redo
any of the changes recorded in the log archive.
For information on both logging and archiving, refer to “Logging and Archiving”
on page 105.
Choosing Between Tuning Trade-offs
The art of tuning is finding and removing constraints. In most systems,
performance is limited by a single constraint. However, removing that constraint,
while improving performance, inevitably reveals a different constraint, and you
often have to remove a series of constraints. Because tuning generally involves
decreasing the load on one resource at the expense of increasing the load on a
different resource, relieving one constraint always creates another. A system will
always be constrained.
When you choose to remove a constraint, consider which resources can accept an
additional load in the system without themselves becoming worse constraints.
Tuning usually involves a variety of actions that can be taken, each with its own
trade-off.
12
Performance Tuning Handbook
Chapter 2. Measuring Performance
This chapter discusses some basic performance measurements you need to make at
the operating system level. It also includes descriptions of several basic
measurement tools included with the DB2 Server for VSE & VM product.
Understanding Performance Measurements
Performance measurements are relative: they tell how a system behaves for a
particular workload. Usually, a system is considered to perform well if it can
complete a particular workload faster than other systems or with fewer resources.
In a test system, you can control the workload in your system by running the same
tasks many times. During each iteration you can measure how fast your system
completed the tasks and how much resource it used.
However, in a production system it is difficult to compare measurements taken at
different times because the workload is constantly changing. To obtain a
performance measurement, you must compare the average performance of your
system measured over a period of time to the workload it processed during that
time. To make these comparisons, you need to calculate two types of relative
measurements:
v Load
v Effective use
Relative Measurements
Load
Measured as a rate, in tasks per unit time. These measurements help you
determine the load on the database manager or the operating system over a period
of time. High load values in some areas and low load in others may suggest a
bottleneck in the system. Also, while similar load measurements do not guarantee
that two workloads are comparable, different ones show that the workloads are not
comparable.
Effective Use
Measured in a range from 0% to 100% (where 100% indicates optimal
performance). These measurements help you estimate how effective the various
buffers in the DASD I/O system are performing.
Effective use is calculated by comparing the number of pages the system looks for
in a buffer to the number it finds there. You can think of this as the number of
successes compared to the number of attempts. For example, if the database
manager looks in the local buffers for a page 100 times, and finds the page it is
looking for 75 times, the local buffers are 75% effective.
This percentage can be calculated in several ways:
Success
Attempt - Failure
Failure
------- X 100% = ----------------- x 100% = 1 - ------- x 100%
Attempt
Attempt
Attempt
You can also express effective use as a hit ratio with the following calculation:
13
Attempt
-------
Failure
In this case, the higher the value of the hit ratio the better the performance, the
lowest value for a hit ratio is 1.
Sampling Interval
An important factor affecting the accuracy of your performance measurements is
the sampling interval. Most useful performance values, whether measured directly
or calculated from other measures, are averages over time.
If the sampling interval is too long, you may lose significant values. For example,
you would not see a 10-minute peak in DASD paging load or a 10-minute drop in
the effective use of the local buffers if you only looked at the VMDSS performance
counters once a day.
If the interval is too short, your results may not be statistically valid. For example,
if one checkpoint occurred during one 30 minute interval, you could not
confidently say that the database manager was performing 2 checkpoints per hour.
You also need to weigh the benefits of making performance measurements against
the additional overhead involved. While recording performance numbers every 10
seconds may give you an excellent picture of how your database is working, the
additional load on the operating system may reduce your database’s performance,
or consume large amounts of DASD space.
Operating System Measurements
There are a wide variety of tools available to measure the performance of your
operating system, some of which are included in “VSE Tools” on page 8, and “VM
Tools” on page 7. When you look for performance measurements in those tools,
focus on three questions. How well is the system performing as a whole? How
well is your database machine or partition performing? How is the database
machine or partition affecting the performance of other processes that are running
at the same time? With that in mind, consider the following generic measurements:
Processor (CPU) Load
Measure the overall percent utilization of your processor (CPU), refer to
“Processor” on page 9. You also need to measure the percentage of the total CPU
time devoted to the database machine or partition, refer to “Concurrency” on page
11.
Real and Virtual Storage Load
Measure the number of virtual pages in your database machine or partition that
have been allocated real storage. Break the real pages into main, and auxiliary
pages (and in the case of VM, expanded storage pages). Refer to “Real and Virtual
Storage” on page 43. Also compare the number of virtual pages that have been
allocated above the 16MB line to those below, refer to “Storage Above 16MB (31 Bit
Addressing)” on page 47.
System Paging DASD Load
Measure the rate of DASD I/O to and from auxiliary storage, refer to “Auxiliary
Storage” on page 43. Pay special attention to I/O to and from system paging
14
Performance Tuning Handbook
DASD. This is the slowest type of auxiliary storage and the largest drain on
performance. Also, compare the overall system paging DASD load to that required
by the database machine or partition.
Machine or Partition DASD I/O Load
Measure the rate of DASD I/O initiated by the database machine or the partition
itself, refer to “Database I/O” on page 85. The database manager directs the
operating system to write and read pages to and from its data, directory, log, and
archive disks or datasets. These I/Os are independent of system paging DASD and
are always measured separately.
Individual Device Utilization
This includes individual DASD volumes, channels, and controllers. Measure the
percentage of time that these individual devices are busy. This is more effective
than using a load measurement because it takes into account the capability of the
device itself. Refer to “DASD Balancing” on page 75.
Translating Performance Measurements to Indicators
The following is a description of the CP INDICATE USER and QUERY TIME
commands included with the VM operating systems. It serves as an example of
how to extract performance counters and simple measurements and translate them
into useful indicators.
CP INDICATE USER and QUERY TIME Commands
These two commands enables you to monitor the overall performance of your
database machine. The most important indicators they provide are:
RES=nnnn
Counts the number of virtual machine pages that are currently in main
storage. Convert the number of pages into bytes by multiplying the value
by 4096 (bytes per page).
READS=nnnnnn
Counts the total number of pages moved from system paging DASD to
main storage for a virtual machine since it was logged on. (Refer to
“Auxiliary Storage” on page 43.)
WRITES=nnnnnn
Counts the total number of pages moved from main storage to system
paging DASD for a virtual machine since it was logged on. (Refer to
“Auxiliary Storage” on page 43.)
CONNECT=hh:mm:ss
Records the total elapsed time the virtual machine was logged on the
system.
VIRTCPU=mmm:ss
Records the total virtual machine processor time used since the virtual
machine was logged on.
TOTCPU=mmm:ss
Records the total virtual machine processor time plus the total CP
processor time used (virtual plus overhead) since the virtual machine was
logged on.
Chapter 2. Measuring Performance
15
IO=nnnnnn
Records the total number of I/O requests issued by the machine since it
was logged on. This includes all I/Os started by the DASD I/O system,
refer to “Database I/O” on page 85.
Note: Several IUCV *BLOCKIO requests may be blocked together to form
a single IO request. This count includes all the IO requests, it does
not count each page or block moved.
The IO value will not equal the DASDIO counter.
These commands are only really useful when you use them together. To issue
QUERY TIME and INDICATE USER together, type the following from the operator
console:
#CP QUERY TIME #CP INDICATE USER
Note: The # symbol is the default escape character. It may be different depending
on how your system has been customized.
You also need to compare two consecutive commands. For example, consider the
following two QUERY TIME and INDICATE USER commands:
#cp query time #cp indicate user
CP QUERY TIME
CP INDICATE USER
TIME IS 15:07:20 EST TUESDAY 02/14/99
CONNECT= 01:21:45 VIRTCPU= 000:06.28 TOTCPU= 000:09.86
USERID=SQLDBA MACH=XC STOR=0009M VIRT=V XSTORE=NONE
IPLSYS=CMS
DEVNUM=00031
PAGES: RES=001497 WS=001260 LOCK=000000 RESVD=000000
NPREF=000000 PREF=000000 READS=000130 WRITES=000018
CPU 00: CTIME=01:22 VTIME=000:06 TTIME=000:10 IO=007553
RDR=000000 PRT=000738 PCH=000000
VVECTIME=000:00 TVECTIME=000:00
#cp query time #cp indicate user
CP QUERY TIME
CP INDICATE USER
TIME IS 15:08:31 EST TUESDAY 02/14/99
CONNECT= 01:22:56 VIRTCPU= 000:07.50 TOTCPU= 000:11.82
USERID=SQLDBA MACH=XC STOR=0009M VIRT=V XSTORE=NONE
IPLSYS=CMS
DEVNUM=00031
PAGES: RES=001499 WS=001472 LOCK=000000 RESVD=000000
NPREF=000000 PREF=000000 READS=000135 WRITES=000022
CPU 00: CTIME=01:23 VTIME=000:08 TTIME=000:12 IO=009049
RDR=000000 PRT=000974 PCH=000000
VVECTIME=000:00 TVECTIME=000:00
The output shows that, during 71 seconds (CONNECT advanced from 01:21:45 to
01:22:56) the following occurred:
RES The number of virtual pages in main storage increased by two (1499-1497).
READS
Five reads from system paging DASD (135-130)
WRITES
Four writes to system paging DASD (22-18)
VIRTCPU
1.22 seconds of virtual machine time were used (07.50-06.28)
16
Performance Tuning Handbook
TOTCPU
1.96 seconds of total CPU time were used (11.82-09.86)
IO
1496 I/O requests were issued (9049-7553)
There are four important values that you can calculate from these numbers:
Sampling Interval
Δ CONNECT. The change in elapsed time between CP QUERY TIME
commands.
Main Storage Load
(RES+ (Δ RES/2) )(4096)/(Total bytes of main storage). Indicates the
average load on main storage.
System Paging DASD Load
(Δ READS+Δ WRITES)/sampling interval. Indicates the average load on
system paging DASD.
Total Processor (CPU) Load
(Δ TOTCPU/sampling interval)x100. Indicates the average percent of total
CPU time your virtual machine is using. While this looks like an effective
use measurement, it is really a measure of the load your database machine
is placing on the CPU.
DASD I/O Load
Δ IO/sampling interval. Indicates the average load on the I/O system (tape
and console I/O is also included, but not Paging or Spooling I/O).
For example, from the previous example:
v Sampling Interval: 71 seconds (01:21:45 to 01:22:56)
v An average of 1498 pages of main storage were used. This converts to 6135808
bytes or 5.85MB. If you knew, for example, that your processor has 32MB of
main storage, you could calculate that the database machine was using almost
18.3% of it (5.85/32x100).
v System Paging DASD Load: 0.127/second ((4+5)/71)
v Total CPU Load: 2.76% ( (1.96/71)x100 )
v DASD I/O Load: 21.07/second (1496/71).
For more information, refer to the VM/ESA: CP Command and Utility Reference
manual.
CICS Monitoring (CICSPARS for VSE)
This facility collects performance data during on-line processing for later off-line
analysis. Monitoring data is recorded in the CICS journal data sets. This data can
be formatted using the CICS Performance Analysis Reporting System (CICSPARS)
field-developed program. The CICSPARS program is used with the VSE system for
generalized performance analysis reporting (DOS/GPAR) to print analysis reports
and summary reports of DB2 Server for VSE data as user clocks and counters.
CICSPARS collects performance class data for two general areas, link usage and
call usage:
v Link usage data collected
- Total number of link requests. This corresponds to the total number of logical
units of work.
- Total number of link requests resulting in a wait because all links are busy.
- Total time waiting for links.
Chapter 2. Measuring Performance
17
- Total time holding links. This corresponds to the total time for all logical units
of work.
v Call usage data collected
- Number of calls to the database manager. This number can be greater than
the total number of SQL statements issued by the application programs. This
can occur because of the implicit connect support (for CICS users not required
to provide user ID and password information to the database manager), the
TPSP support, and the fact that a single SQL statement can result in multiple
database manager calls. Multiple calls may occur when an SQL statement has
a large amount of output.
- Number of failing calls to the database manager. These are calls that result in
negative SQLCODEs.
- Total time waiting for database manager calls to process.
The CICS monitoring facility automatically associates all performance class data
with the CICS transaction running at the time. This allows data reduction
programs that process this information to construct a performance profile for any
given transaction or call summarized by transaction type. With reference to the
DB2 Server for VSE timings listed previously, the transaction profile shown in
Figure 1 can be created.
Not
Waiting
No pending
Waiting
DB2/VSE
for
connected
for a
requests
DB2/VSE
to a link
link
services
(B)
(A)
Holding a link
CICS/VSE transaction
Figure 1. CICS Transaction Time Usage
In Figure 1, blocks (A) and (B) represent intervals during the lifetime of the
transaction when other services within the CICS environment are being used.
Because most of these other services are also represented in the performance class
data, the use of these services can also be broken down, if required, in a manner
similar to the breakdown shown for the database manager. Consequently, the
database manager is integrated into a composite picture of each transaction’s
performance. This allows any transaction (or set of transactions) experiencing
unacceptable response times to be investigated in a simple, systematic manner.
Before the CICS monitoring facility can be run, CICS must be set up to process the
clocks and counters to be used and the journals used to record the data. For
information on the entries required in various CICS tables, see the DB2 Server for
VSE Program Directory.
After the CICS tables have been updated, the CICS monitoring facility can be
started by using either the CICS CSTT transaction or the MONITOR=PER keyword
of the CICS DFHSIT macro. These methods are also shown in the DB2 Server for
VSE Program Directory.
Table 1 on page 19 shows how to relate the DB2 Server for VSE clocks to the
DFHMCT entries. The specification of the keyword ID maps to the clock definition.
The specifications of the ID keyword must use the numeric values shown in
18
Performance Tuning Handbook

Table 1.
Table 1. Relationship of CICS DFHMCT ID Keywords to Clocks
ID Keyword for CICS/VSE
Defines the Clock that Measures
DFHMCT Entry
ID=(PP,16)
Time waiting for a link
ID=(PP,17)
ID=(PP,18)
Time holding a link
ID=(PP,19)
ID=(PP,20)
Time for DB2 Server for VSE processing
ID=(PP,21)
The CICS DFHMCT entries also define the four DB2 Server for VSE counters. The
argument for the ID keyword for these counters must be ID=(PP,22). The order of
the four counters is:
v Counter 1, the number of link allocates
v Counter 2, the number of link waits
v Counter 3, the number of DB2 Server for VSE requests
v Counter 4, the number of DB2 Server for VSE errors.
DB2
Server for VSE & VM Tools
Physical Data Locations
Disk Locations (VM)
The file definitions that the application server uses to point to the directory, log,
and dbextent disks appear in the start up message stream. For example:
sqlstart DB(SQLMACH1)
Ready; T=0.03/0.05 14:22:40
ARI0717I Start SQLSTART EXEC: 09/15/99 14:22:40 EDT.
ARI0663I FILEDEFS in effect are:
ARISQLLD DISK
ARISQLLD LOADLIB Q1
BDISK
DISK
300
LOGDSK1
DISK
301
LOGDSK2
DISK
302
DDSK1
DISK
303
DDSK2
DISK
304
DDSK3
DISK
305
DDSK4
DISK
306
This database has its directory disk at virtual address 300, its log disks at 301 and
302, and its dbextents from 303 to 306. The physical minidisk locations are defined
in the VM Directory. To find out the DASD type, volume identifier, and size of
each disk, type: #CP Q V DASD from the operator console. For example:
Chapter 2. Measuring Performance
19
#cp q v dasd
DASD 0300 3390 PA326B R/W
6 CYL ON DASD
168B
DASD 0301 3390 PA3268 R/W
3 CYL ON DASD
1688
DASD 0302 3390 PA3268 R/W
3 CYL ON DASD
1688
DASD 0303 3390 PA326A R/W
5 CYL ON DASD
168A
DASD 0304 3390 PA326A R/W
5 CYL ON DASD
168A
DASD 0305 3390 PA326A R/W
2 CYL ON DASD
168A
DASD 0306 3390 PA3269 R/W
2 CYL ON DASD
1689
Data Set Placement (VSE)
In DB2 Server for VSE, dbextents are defined as VSAM datasets. To find out their
dataset names, look in the database identification procedure for your server
(shipped as an example procedure ARIS72DB), which is executed just before the
ARISQLDS start up job step in the start up job stream. (Procedure ARIS72DB is
only an example. The database identification procedure for your server may have a
different name and point to different disks.)
// DLBL BDISK,’SQL.BDISK.DBASE.DB’,,VSAM,CAT=SQLCAT
// DLBL LOGDSK1,’SQL.LOGDSK1.DBASE.DB’,,VSAM,CAT=SQLCAT
// DLBL LOGDSK2,’SQL.LOGDSK2.DBASE.DB’,,VSAM,CAT=SQLCAT
// DLBL DDSK1,’SQL.DDSK1.DBASE.DB’,,VSAM,CAT=SQLCAT
// DLBL DDSK2,’SQL.DDSK2.DBASE.DB’,,VSAM,CAT=SQLCAT
// DLBL DDSK3,’SQL.DDSK3.DBASE.DB’,,VSAM,CAT=SQLCAT
// DLBL DDSK4,’SQL.DDSK4.DBASE.DB’,,VSAM,CAT=SQLCAT
// DLBL DDSK5,’SQL.DDSK5.DBASE.DB’,,VSAM,CAT=SQLCAT
// DLBL DDSK6,’SQL.DDSK6.DBASE.DB’,,VSAM,CAT=SQLCAT
You can find the size and location of the datasets either by using the Access
Method Services (IDCAMS) utility (part of VSAM LISTCAT), or through the VSE
interactive interface. Both are documented in the DB2 Server for VSE & VM
Operation manual.
Initialization Parameters
When you initialize the application server, important information is presented on
the operator console:
20
Performance Tuning Handbook